THIRSTY COUNTRY: CLIMATE CHANGE AND DROUGHT IN AUSTRALIA
←
→
Page content transcription
If your browser does not render page correctly, please read the page content below
THIRSTY
COUNTRY:
CLIMATE
CHANGE AND
DROUGHT IN
AUSTRALIA

The Climate Council is an independent, crowd-funded organisation
providing quality information on climate change to the Australian public.

CLIMATECOUNCIL.ORG.AU
Authorship:
Will Steffen
Published by the Climate Council of Australia Limited
ISBN:    978-0-9942453-8-0 (print)
         978-0-9942453-7-3 (web)
© Climate Council of Australia Ltd 2015
This work is copyright the Climate Council of Australia Ltd. All material
contained in this work is copyright the Climate Council of Australia Ltd
except where a third party source is indicated.
Climate Council of Australia Ltd copyright material is licensed under
the Creative Commons Attribution 3.0 Australia License. To view a
copy of this license visit http://creativecommons.org.au
You are free to copy, communicate and adapt the Climate Council of
Australia Ltd copyright material so long as you attribute the Climate
Council of Australia Ltd and the authors in the following manner:
Thirsty Country: Climate change and drought in Australia
by Will Steffen (Climate Council of Australia).

Permission to use third party copyright content in this publication can
be sought from the relevant third party copyright owner/s.
This report is printed on 100% recycled paper.

                  Professor Will Steffen
                  Climate Councillor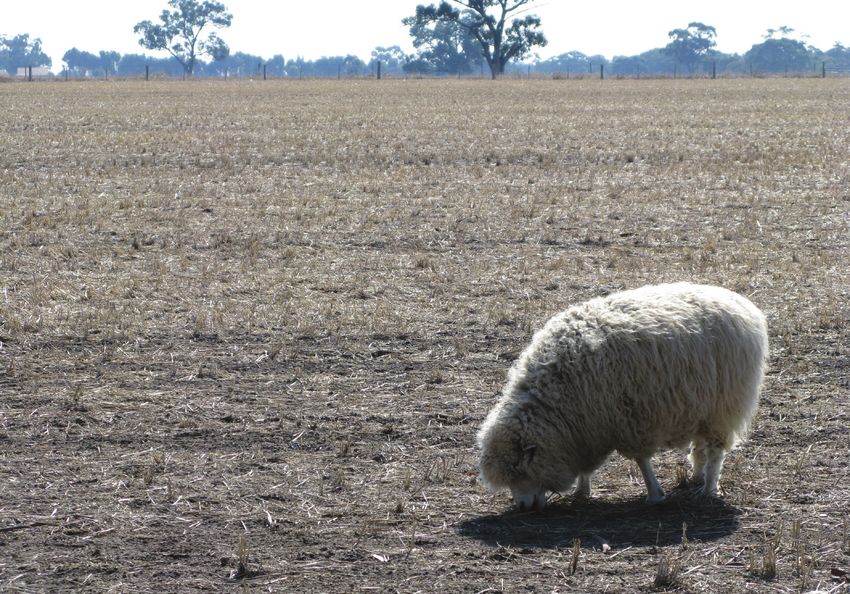
Key Findings:
     1. Climate change is likely                 2. Droughts have far-reaching
        making drought conditions                   impacts on health, agriculture
        in southwest and southeast                  and native species in Australia.
        Australia worse.                           ›› The relative risk of suicide can
       ›› Fronts from the Southern Ocean,             increase by up to 15 percent for
          which typically bring rain across           rural males aged 30-49 as the
          southern Australia during                   severity of drought increases.
          winter and spring, have shifted
                                                   ›› Between 2002 and 2003 decreases
          southwards with a warming
                                                      in agricultural production due to
          climate, leading to declines in
                                                      drought resulted in a 1 percent fall
          rainfall in southwest and southeast
                                                      in the Gross Domestic Product
          Australia and increasing the risk
                                                      (GDP), which is equivalent to half
          of drought conditions in
                                                      of Australia’s decline in annual
          these regions.
                                                      GDP following the global financial
       ›› Since the mid-1990s, southeast              crisis in 2009.
          Australia has experienced a 15
          percent decline in the late autumn
          and early winter rainfall and a 25
          percent decline in average rainfall
          in April and May.
       ›› Average annual stream flow into
          Perth’s dams has already decreased
          by nearly 80 percent since the
          mid-1970s.
       ›› Climate change is driving an
          increase in the intensity and
          frequency of hot days and
          heatwaves in Australia, in turn
          increasing the severity of droughts.

CLIMATECOUNCIL.ORG.AU                                                                        Page i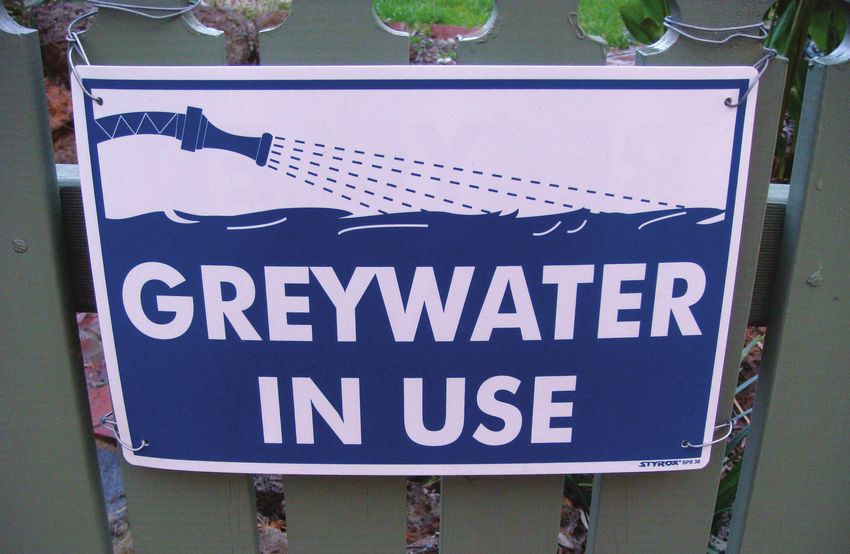
PARCHED COUNTRY: CLIMATE CHANGE AND DROUGHT IN AUSTRALIA

             3. Water scarcity will become                4. Droughts are likely to worsen
                an increasing challenge as                   in severity and duration
                the pressure on urban water                  in southern Australia if
                supplies intensifies.                        greenhouse gas emissions are
                ›› Water inflows to key Sydney
                                                             not cut deeply and rapidly.
                   dams such as Warragamba and              ›› Average rainfall in southern
                   Shoalhaven could decrease by as             Australia during the cool season
                   much as 25 percent by 2070 if               is expected to decline further,
                   greenhouse gas emissions continue           and the time spent in drought
                   on their current trajectory.                conditions is projected to increase.
                ›› Annual water demand is projected         ›› In Western Australia total
                   to outstrip supply in Perth and             reductions in autumn and winter
                   surrounding regions by as much              precipitation could be potentially
                   as 85 billion litres by 2030. That’s        as high as 50 percent in the next
                   enough water to fill 34,000 Olympic         80 years.
                   sized swimming pools.
                                                            ›› To stabilise the climate, we must
                ›› Average annual stream flows to              rapidly reduce greenhouse gas
                   Melbourne’s four major water                emissions, increase investment
                   harvesting storages could decrease          in clean energy, and most of the
                   by seven percent by 2020 and by             world’s fossil fuel reserves – coal,
                   18 percent by 2050.                         oil and gas - must remain in
                                                               the ground.

 Page ii                                                                CLIMATECOUNCIL.ORG.AU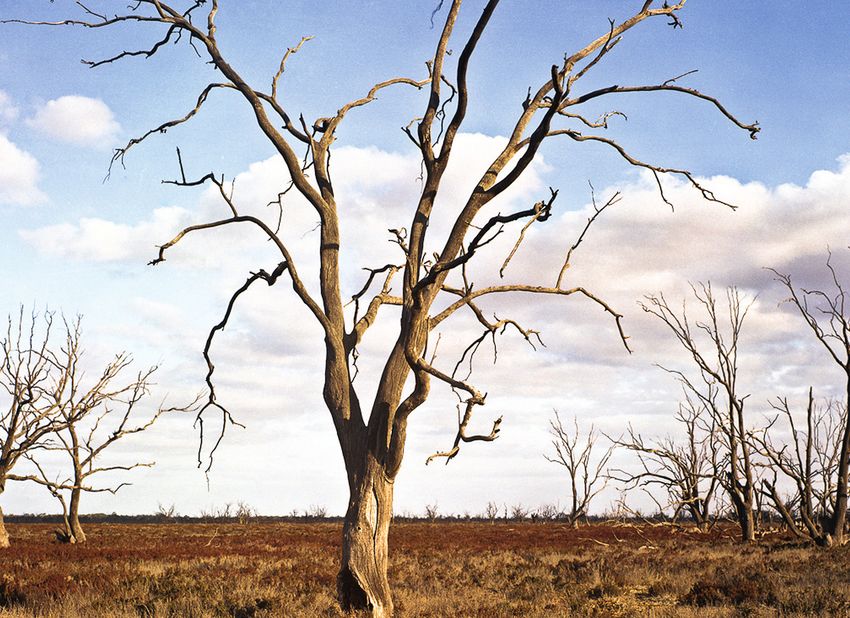
Introduction
     Drought has deeply affected Australia         We begin this report by describing
     throughout its history. The Millennium        what a drought is, before considering
     Drought from 1996-2010 serves as a            its consequences for health, the
     recent reminder of the wide-reaching          economy, ecosystems and urban water
     impacts that drought can have on              supplies. We then outline the changing
     Australia’s people and environment.           drought conditions and increasing
                                                   drying trends in Australia and explore
     Australia is the driest inhabited continent
                                                   recent dry conditions in various parts of
     on Earth and drought is an important
                                                   the country. We conclude by exploring
     feature of Australia’s climate. Whilst
                                                   how climate change is influencing
     Australians have always lived with
                                                   drought conditions in the southeast
     drought and its consequences, it is likely
                                                   and southwest of the continent as well
     that climate change is making drought
                                                   as drying trends globally.
     worse in the southeast and southwest,
     some of our most populous regions.

CLIMATECOUNCIL.ORG.AU                                                                          Page 1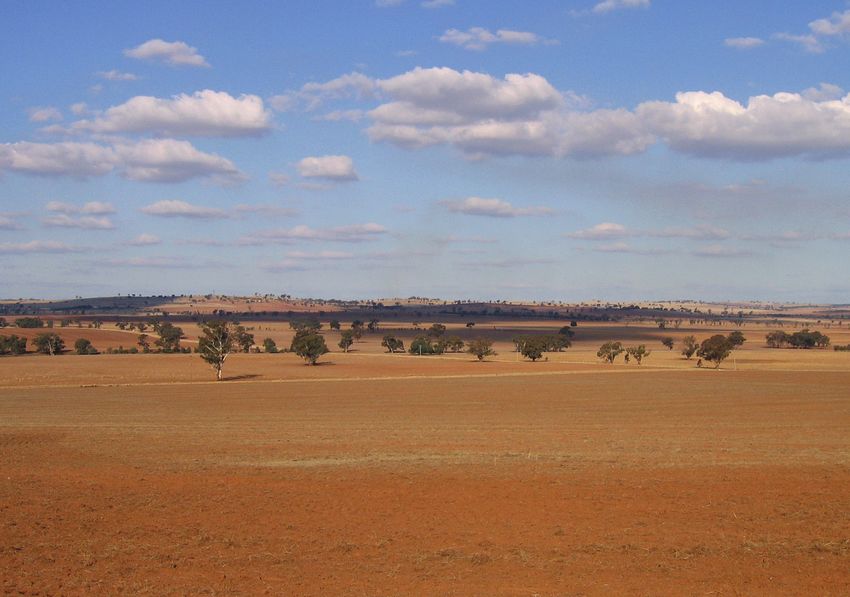
PARCHED COUNTRY: CLIMATE CHANGE AND DROUGHT IN AUSTRALIA

             1. What is a drought?
             Australia is the driest inhabited continent   which is measured through deficits
             on Earth, with some of the world’s most       in soil moisture, and hydrological
             variable rainfall and stream-flow (DFAT       drought, which is based on anomalies
             2014). The country has been deeply            in stream flow, lake and/or groundwater
             affected by drought throughout history,       levels (IPCC 2012). Both of these
             with significant droughts such as the         definitions are important in terms of
             Federation Drought (1895–1903), which         understanding the impacts of drought,
             led to the loss of millions of cattle, and    and the consequences of climate
             the World War II drought (1939–1945),         change for these impacts.
             which contributed to plummeting wheat
                                                           As outlined by the Intergovernmental
             yields and disastrous bushfires (BoM
                                                           Panel on Climate Change (IPCC), ‘climate
             2014a; 2014b). The ‘Big Dry’ of 1996–2010
                                                           extremes, such as drought, may be the
             (also called the Millennium Drought)
                                                           result of an accumulation of weather
             went down in history as one of the worst
                                                           or climate events that are not extreme
             droughts on record for Australia, with
                                                           when considered independently’ (IPCC
             devastating impacts (van Dijk et al. 2013).
                                                           2012, p.7). In Australia, the Bureau of
             Drought can be defined in a variety of        Meteorology (BoM) measures drought
             different ways. In terms of its links to      by monitoring ‘serious’ or ‘severe’ rainfall
             climate change, drought is best defined       deficiencies that have occurred for three
             as meteorological drought, which is           months or more. A rainfall deficiency
             ‘a prolonged, abnormally dry period           is considered ‘serious’ when rainfall is
             when the amount of available water is         in the lowest 5-10 percent of the full
             insufficient to meet our normal use’          range of rainfall amounts, from the very
             and is generally measured by assessing        lowest to the very highest, for the period
             rainfall deficiencies over three or more      measured, and ‘severe’ when rainfall is
             months (BoM 2014c).                           in the lowest 0-5 percent of the range.
                                                           Whilst BoM tracks rainfall deficiencies,
             In addition to meteorological drought,
                                                           it is the responsibility of the State and/or
             two other definitions of drought are
                                                           Federal Governments to officially declare
             used by different economic sectors or
                                                           a drought (BoM 2012).
             areas of research: agricultural drought,

 Page 2                                                                    CLIMATECOUNCIL.ORG.AU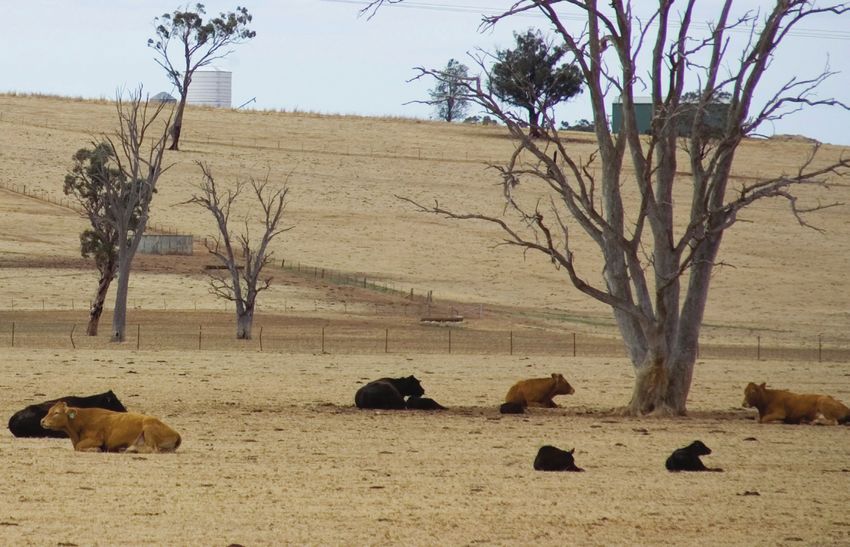
2.	What are the
        consequences
        of drought?
     Drought has significant impacts on
     health, the economy, ecosystems and
                                                 “Drought can contribute to
     urban water supplies.                       declines in human health and
                                                 increases in mortality rates.”
“The World Meteorological
Organization has linked                          found that the relative risk of suicide
                                                 can increase by up to 15 percent for rural
drought to 680,000 deaths                        males aged 30–49 as the severity of
                                                 drought increases (Hanigan et al. 2012).
globally from 1970–2012.”
                                                 2.2 Economic
     2.1 Health
                                                 Drought affects agriculture, tourism,
     Droughts can have wide ranging effects      employment and livelihoods in Australia,
     on health including on nutrition,           with severe economic repercussions.
     infectious diseases, on forest fires        Between 2002 and 2003 decreases in
     causing air pollution, and mental health    agricultural production due to drought
     problems, such as post-traumatic            resulted in a 1% reduction in the Gross
     stress and suicidal behaviour (Haines       Domestic Product (GDP) and a 28.5%
     et al 2006; Climate Commission              fall in the gross value added for the
     2011). Droughts can also contribute to      agricultural industry compared to
     increases in mortality rates. The World     the preceding year (ABS 2004). This
     Meteorological Organization (WMO) has       is a significant hit to the economy,
     linked drought to 680,000 deaths globally   considering that the global financial
     from 1970–2012 (WMO 2014). Declines         crisis caused a reduction of 2 percent
     in physical health are also particularly    in Australia’s annual GDP from 2008 to
     prevalent amongst the elderly in drought    2009 (World Bank 2015). The predicted
     affected rural communities in Australia     increase in drought frequency in the
     (Horton et al. 2010). Furthermore,          future has been estimated to cost
     drought can play a role in exacerbating     $5.4 billion annually, reducing GDP by
     mental health issues and increasing         1 percent per annum (Carroll et al 2007).
     suicide rates in Australian drought-
                                                 Several important agricultural areas,
     affected rural populations, especially
                                                 including southwest Western Australia,
     amongst male farmers (Alston 2012).
                                                 parts of central Queensland and
     A recent study in New South Wales (NSW)

CLIMATECOUNCIL.ORG.AU                                                                         Page 3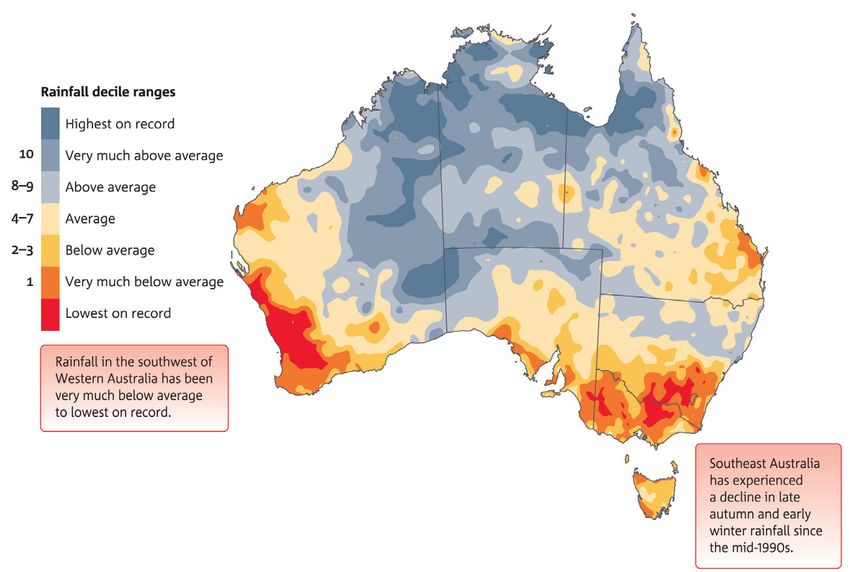
PARCHED COUNTRY: CLIMATE CHANGE AND DROUGHT IN AUSTRALIA

             northern New South Wales, Victoria           More recently the Millennium Drought
             and southern South Australia, and most       in southeast Australia, which lasted
             of Tasmania, received below-average          from 1996 to 2010, was one of the worst
             annual rainfall for 2014 (BoM 2015a).        on record for the region (van Dijk et al.
             Significantly reduced rainfall in winter     2013). Southeast Australia experienced its
             and spring across eastern Australia          lowest 13-year rainfall record since 1865
             affects the intensive cropping and           (CSIRO 2012). The Millennium Drought
             livestock breeding that is commonly          had wide-ranging repercussions. For
             practiced in the region, with potentially    example agricultural production fell
             serious economic repercussions               from 2.9 percent to 2.4 percent of Gross
             (ABARES 2012).                               Domestic Product (GDP) between 2002 to
                                                          2009, with drought playing a significant
             Particularly noteworthy droughts in
                                                          role in these observed declines in GDP
             recent history include the period from
                                                          (van Dijk et al. 2013). It is estimated that
             1982–1983 when Australia experienced
                                                          between 2006 and 2009 the drought
             one of the most intense droughts on
                                                          reduced national GDP by roughly 0.75
             record, with a total loss of $3 billion in
                                                          percent. Between 2007-2008 regional
             agricultural production alone (ABARES
                                                          GDP in the southern Murray-Darling
             2012). The Wimmera Southern Mallee
                                                          Basin fell 5.7 percent below forecast and
             region of Victoria experienced an
                                                          was accompanied by the temporary loss
             80 percent reduction in grain production
                                                          of 6000 jobs (IPCC 2014).
             and a 40 percent reduction in livestock
             production (BCG 2008).

             Figure 1: Cows in drought stricken fields, Wagga Wagga NSW

 Page 4                                                                   CLIMATECOUNCIL.ORG.AU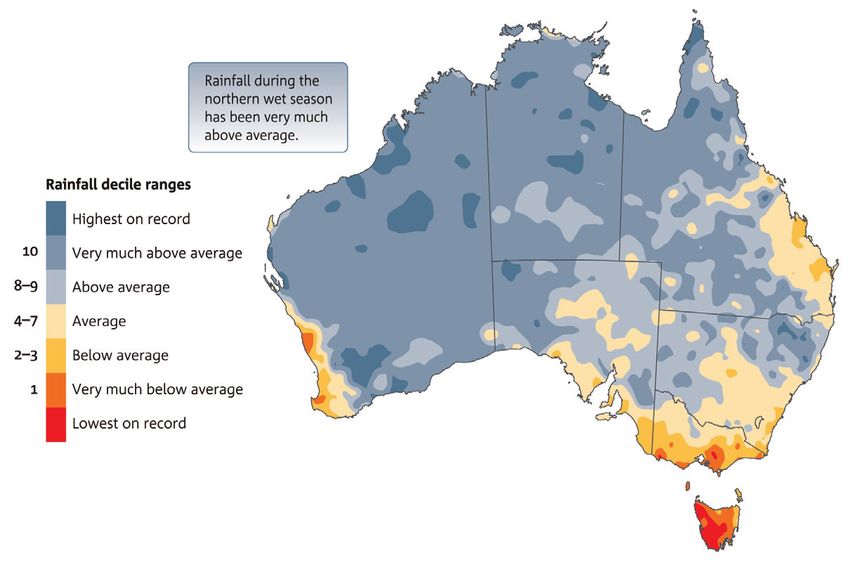
“By mid-2010 the Australian government had paid
     $4.4 billion in direct drought assistance to farmers.”
     Drought can also be costly due to           2.3 Ecosystems
     drought relief packages provided by the
     federal government. By mid-2010 the         Drought has significant impacts on
     Australian government had paid $4.4         Australia’s natural environment. For
     billion in direct drought assistance to     example, aquatic ecosystems are often
     farmers (ABARES 2012). Drought also has     affected by drought, with decreased
     economic repercussions for Australia’s      water supplies reducing the availability
     tourism industry. In the Murray River       of suitable habitat and leading to
     region, it is estimated that the drought    reductions in the populations of many
     caused an estimated $70 million loss        fish and invertebrate species and,
     because of reduced visitor days in 2008     in some cases, contributing to local
     (TRA 2010). A recent report by the WMO      extinctions (Bond et al. 2008). During the
     estimated that the impacts of Australia’s   Millennium Drought, there was a marked
     1981 drought cost US$ 15.15 billion and     decline in water bird, fish and aquatic
     was Australia’s most costly weather-        plant populations in the Murray-Darling
     related event (WMO 2014).                   Basin (LeBlanc et al. 2012).

     Figure 2: Dead trees, South Australia

CLIMATECOUNCIL.ORG.AU                                                                         Page 5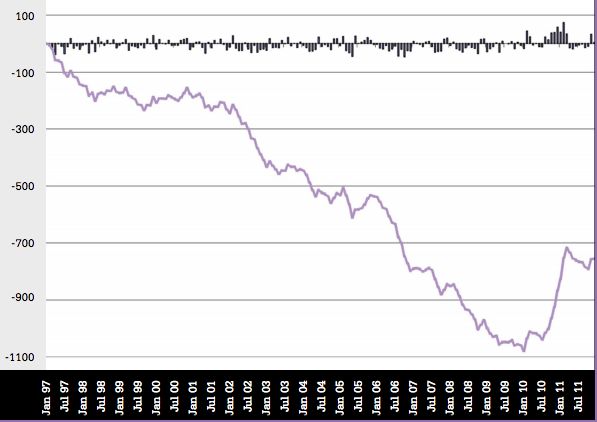
PARCHED COUNTRY: CLIMATE CHANGE AND DROUGHT IN AUSTRALIA

             Many terrestrial ecosystems are also
             affected by drought, with iconic species
                                                          “Many thousands of plants
             such as the river red gum dying over         and animals could be at
             extensive areas in the Murray-Darling
             Basin (Bond et al. 2008). The factors
                                                          risk if the rate of climate
             leading to the decline and death of these    change continues”
             trees, many of which are several hundred
             years old, suggest that the circumstances
                                                          2.4 Urban water supplies
             that led to their decline are ‘beyond
             natural conditions’ (LeBlanc et al. 2012     Water scarcity in major cities, particularly
             p.236).                                      Melbourne, Sydney and Perth, has been
                                                          exacerbated by drought and remains
             Severe heatwaves and drought are also
                                                          an ongoing challenge. As of 2013,
             one of the biggest threats to native
                                                          89 percent of Australia’s population lived
             eucalyptus species (Butt et al. 2013).
                                                          in urban areas (World Bank 2013), placing
             Drought also poses risks to planted
                                                          high demand on urban water supplies as
             forests. During the Millennium Drought,
                                                          populations continue to grow. Pressure
             for example, 57,000 ha of planted forest
                                                          on urban water supplies is projected
             in Australia were lost (van Dijk et al.
                                                          to intensify as droughts increase in
             2013). This is equivalent to the area of
                                                          frequency and severity in the southwest
             28,500 cricket pitches.
                                                          and southeast (Collett and Henry 2011).

    “During the Millennium                                Drought can significantly reduce inflows
                                                          into vital urban water catchments, as
    Drought 57,000 ha of planted                          occurred during the Millennium Drought
    forest in Australia were lost.                        (Section 3), resulting in water restrictions.
                                                          For example, from 2007–2010 Melbourne
    This is equivalent to the area                        was placed on Stage 3 restrictions and

    of 28,500 cricket pitches.“                           in 2009 Melbourne’s water storage levels
                                                          fell to a record minimum of 25.6 percent
                                                          (Melbourne Water 2013; Melbourne Water
             As the trend towards hotter, drier
                                                          2014).
             conditions continues in southern
             Australia (Section 3), native species will   Industries also had to adhere to water
             continue to face habitat degradation,        restrictions, with the agricultural sector
             population declines, and in some cases       particularly affected by water scarcity
             extinction (Reisinger et al. 2014). If the   and a resulting decline in crop yields
             rate of climate change that the continent    (Grant et al. 2013; Melbourne Water
             is currently experiencing continues,         2014). Similarly, during the Millennium
             many thousands of terrestrial and            Drought in southeast Queensland severe
             freshwater species could be at risk, such    water restrictions were implemented
             as the green and golden bell frog, the       that saw average water use in some
             platypus and a variety of eucalypt forests   areas fall to 129 litres per person per
             (MacNally et al. 2009; Klamt et al. 2011;
             IPCC 2014; Climate Council 2014a).

 Page 6                                                                   CLIMATECOUNCIL.ORG.AU
day, in comparison to a regional urban A study by Melbourne Water projects
consumption of 375 litres under normal that under ‘medium’ climate change
operating conditions (Queensland Water scenarios a potential seven percent
Commission 2010). decrease in average annual stream
flows to Melbourne’s four major water
Assessments of future impacts of
harvesting storages could be expected
drought on both water supply and urban
by 2020 and 18 percent by 2050 (Howe
water demand at the regional and/
et al. 2005).
or catchment level suggest that water
scarcity could increase across Australia.
In NSW, under a high emissions scenario “Water scarcity could
along with high population growth and increase across Australia”
less rapid technological change (IPCC
2000), water inflows to key Sydney dams The projected increase in duration
such as Warragamba and Shoalhaven and intensity of droughts in southeast
could decrease by as much as 25 Queensland (CSIRO and BoM 2015;
percent by 2070 (NSW Office of Water Section 3) is expected to increase the
2010). These declines, coupled with a length of time it takes to refill key water
continued rise in annual demand for storages in the region. An assessment
drinking water in the residential and of climate change impacts on water
commercial sectors, could increase the availability in Moreton catchment has
imposition of water restrictions in the found a decline in inflow into water
state (NSW Office of Water 2010).
Figure 3: Recycling water in Melbourne
CLIMATECOUNCIL.ORG.AU Page 7PARCHED COUNTRY: CLIMATE CHANGE AND DROUGHT IN AUSTRALIA
storages when it rains, and longer breaks this into context, Western Australia’s
between significant ‘storage filling Integrated Water Supply Scheme (IWSS)
events’ (UWSRA 2011). currently delivers 289 billion litres of
water to over 2 million people in the
Finally, the pronounced drying trend
region each year. A deficit of 85 billion
over southwest Australia, which is
litres is equivalent to approximately
projected to continue throughout the
30% of current water supply (WA Water
21st century (Section 3), has significant
Corporation 2014). That’s enough water
implications for urban water supplies
to fill 34,000 Olympic sized swimming
in Perth (Collett and Henry 2011). The
pools. Desalination plants, which
Western Australia Department of Water
have been built in all mainland states
(2009) predicts a supply-demand annual
in Australia, can potentially assist in
deficit that is potentially as large as
easing declines in urban water supplies,
85 billion litres by 2030 for the Perth,
although they have significantly varied
goldfields and agricultural regions and
water-producing capacity (Hoang et al.
some parts of the southwest. To put
2012).
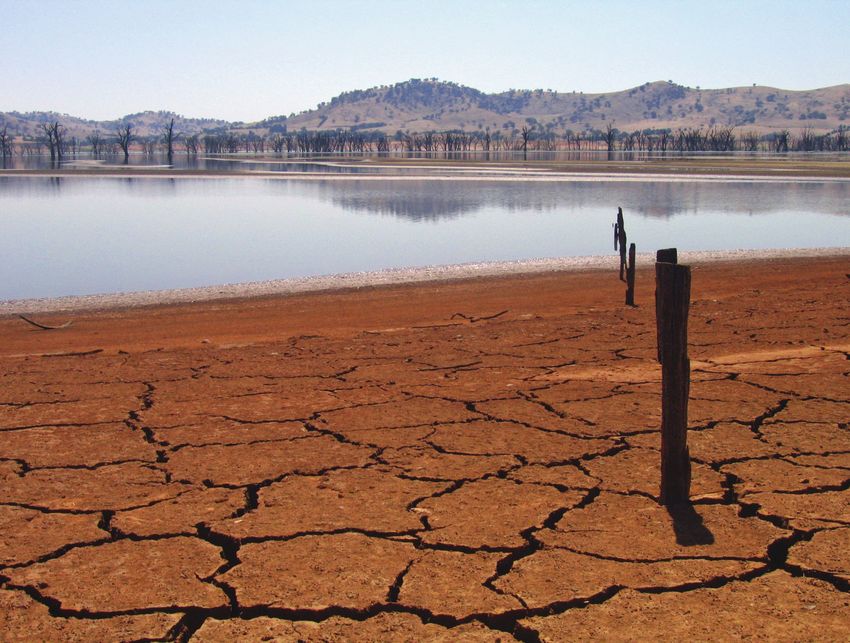
Figure 4: Lake Hume during drought in 2007, Victoria
Page 8 CLIMATECOUNCIL.ORG.AU3. What changes have been
observed in drought
conditions in Australia?
Whilst some parts of Australia are getting wetter, particularly the northwest of the
continent, some of the most populous and agriculturally productive regions in the
south are becoming drier (CSIRO and BoM 2014; Figure 5).
Southern wet season (April-November) rainfall deciles since 1996. A decile
map shows the extent that rainfall is above average, average, or below
average from the specified time period, in comparison with the entire
national rainfall record from 1900. The southern wet season is defined
as April to November by the Bureau of Meteorology
Northern wet season (October-August) rainfall deciles since 1995–6. A decile
map shows the extent that rainfall is above average, average, or below average
from the specified time period, in comparison with the entire national rainfall
record from 1900. The northern wet season is defined as October to April by
the Bureau of Meteorology
Figure 5: Long term changes in rainfall across Australia.
Source: (CSIRO and BoM 2014)
CLIMATECOUNCIL.ORG.AU Page 9PARCHED COUNTRY: CLIMATE CHANGE AND DROUGHT IN AUSTRALIA
A long-term drying trend is particularly need to increase the capacity of the state’s
evident in the southwest and southeast desalination plants, or find alternate
of Australia, with rainfall deficiencies sources of water in order to sustain the
and declines in soil moisture indicative population of the city (The Guardian 2014).
of dry conditions that have persisted in
The drying trend in the southeast of
recent decades (CSIRO and BoM 2015). In
Australia is evidenced by declines in
the southwest, rainfall has declined since
rainfall combined with increases in
the mid-1970s. This drying trend has
temperature. Since the mid-1990s,
been particularly severe in the southwest
southeast Australia has experienced a
corner of Western Australia, which has
15 percent decline in late autumn and
experienced a 15 percent drop in rainfall
early winter rainfall and a 25 percent
since the mid‑1970s (WC 2012; Climate
decline in average rainfall in April
Commission 2013).
and May (CSIRO and BoM 2014). The
Future drying trends in Australia are
region has also experienced significant
projected to be most pronounced over
warming during the last 50 years
southwest Western Australia, with
(Timbal et al. 2010). The warming trend
total reductions in autumn and winter
was especially prominent in 2013 with
precipitation potentially as high as 50
two intense and prolonged heatwaves
percent by the late 21st century (Delworth
affecting the southeast in early January
and Zeng 2014; CSIRO and BoM 2015).
and March 2013 (BoM 2013).
This could have significant implications
for the city of Perth, which has already The combination of dry and hot
experienced a reduction of nearly 80% conditions was particularly severe
in total annual inflow into its dams since in Australia during the Millennium
the mid-1970s (Figure 6). The city may Drought, which was concentrated in
900
Annual Total
Total Annual ‘Inflow to Perth Dams’ (GL)
800
1911-1974 av (338 GL)
700 1975-2000 av (177 GL)
2001-05 av (92.7 GL)
600
2006-12 av (65.8 GL)
500
400
300
2012
200 (18.3 GL)
100
2005
2009
2003
2007
2001
1945
1955
1985
1925
1995
1959
1965
1999
1949
1989
1969
1929
1935
1943
1953
1983
1923
2011
1963
1993
1947
1939
1927
1957
1975
1951
1967
1987
1997
1915
1933
1981
1921
1941
1961
1979
1991
1919
1937
1973
1977
1913
1931
1917
1971
1911
Figure6:
!"#$%&
Figure 20: Trendin
Trend in total
total annual
annualstreamstream flow intointo
flow PerthPerth
damsdams
1911-2012
1911–2012. Source: (Climate
1(#$%#*:02(#$*H#Australia’s south and was exceptional for It will likely be increasingly difficult to
both its length and its severity (CSIRO erase such rainfall deficits in future,
2012; CSIRO and BoM 2015). During this with further declines in average rainfall
drought, average annual rainfall was projected for southern Australia in the
12 percent below the long‑term (1990– cool season (winter and spring), mainly
2010) average of 582 mm, the lowest ever driven by the southward movement
13-year rainfall period was recorded, of winter storm systems. There are no
and there was an absence of ‘wet years’ reliable predictions yet for the direction
and ‘very wet months’ (CSIRO 2012). of change in rainfall in summer and
The decreases in cumulative rainfall autumn (CSIRO and BoM 2015).
rainfall
during the to erase Drought
Millennium the deficit created by long droughts. It will likely be increasingly
(Figure
7) showdifficult to erase such rainfall deficits in future, with below average rainfall projected
that it takes several years of
to persist
above-average acrosstosoutheastern
rainfall Australia towards the end of autumn and into the winter
erase the deficit
created months
by long each year (CSIRO 2012).
droughts.
Figure
Figure 7: 7: Cumulative
Cumulative rainfall
rainfall variation
variation (in (in
mm) mm) from
from the the long-term
long-term average
average for for southeast
southeast
Australia
Australia forfor
thethe period
period January
January 1997
1997 to December
to December 2011.
2011. Individual
Individual monthly
monthly variations
variations are
are shown
shown in theincolumns.
the columns. Source:
Source: (Climate
(Climate Commission
Commission 2013, 2013a,
adaptedadapted from BoM).
from BoM)
Whilst rainfall deficiencies are a key measure for meteorological drought, soil
moisture is also an insightful indicator, with the physical impacts of severe droughts
continuing long after the rainfall has returned as soil moisture can remain severely
depleted (ABARES 2012). Some studies that use soil moisture rather than rainfall
deficiency to assess dryness across Australia have also identified a potential drying
CLIMATECOUNCIL.ORG.AU Page 11
pattern in some regions of the country. This is particularly evident in the more
populous eastern half of the continent, although some other areas have alsoPARCHED COUNTRY: CLIMATE CHANGE AND DROUGHT IN AUSTRALIA
Whilst rainfall deficiencies are a key deficiencies in Queensland can largely be
measure for meteorological drought, attributed to below-average rainfall over
soil moisture is also an insightful the 2013–14 and 2012–13 ‘summer’ wet
indicator, with the physical impacts of seasons (the northern wet season spans
severe droughts continuing long after October–April) (BoM 2015b). Drought
the rainfall has returned because soil conditions are expected to persist,
moisture can remain severely depleted particularly in Queensland and western
(ABARES 2012). Some studies that use soil Victoria (BoM 2015c).
moisture rather than rainfall deficiency
to assess dryness across Australia “In March 2014, 75% of
have also identified a potential drying
pattern in some regions of the country. Queensland was declared
This is particularly evident in the more
populous eastern half of the continent,
in drought”
although some other areas have also In March 2014, 50 local government
experienced decreases in drying, such areas in Queensland (75 percent of the
as central Australia (IPCC 2012). Long- state) were declared in drought, making
term trends in soil moisture down the it the largest area of Queensland to ever
soil profile also point to a possible drying be declared in drought (DAFF 2014; ABC
trend in some regions (CSIRO 2014). 2014a; ABC 2014b). In February 2015,
In Australia, between October 2012 the number of drought-declared local
and February 2015, rainfall deficiencies government areas decreased slightly to
increased across central northern 44, which remains a significant portion
Queensland south of the Cape York of the state (DAFF 2015).
Peninsula, extending through inland Whilst the NSW state government no
southern Queensland to northern New longer issues drought declarations,
South Wales inland of the Great Dividing the NSW government’s February 2015
Range, and in the area covering western seasonal condition report indicates
Victoria and adjacent southeastern South that portions of the state have been
Australia. impacted by severe rainfall deficiencies.
Severe and serious deficiencies are For example, severe rainfall deficiencies
happening in these areas and in small occurred across the northwest and
areas of southwestern Queensland northern tablelands during the last
and adjacent parts of the southeastern 24 months and drier than normal
Northern Territory and northeastern conditions are expected to continue
South Australia, pockets to the east of between February and April 2015 (DPI
Mildura in southern New South Wales 2015).
and around the northeast of Melbourne The long-term drying trend in the
in Victoria, and in small parts of coastal southeast is exacerbated from time to
western Tasmania. Long-term rainfall time by the occurrence of El Niño events,
Page 12 CLIMATECOUNCIL.ORG.AUa feature of natural climate variability The Millennium Drought, one of the
that recurs about every three to eight most severe droughts on record, was
years (BoM 2005). El Niño events in exacerbated by two separate El Niño
Australia are often associated with below events (ABARES 2012). At present, while
average rainfall in winter and spring, the tropical Pacific Ocean is in neutral
particularly across eastern Australia conditions, the likelihood of an El Niño
(BoM 2010; ABARES 2012) and above developing in 2015 has increased.
average temperatures (Arblaster and Therefore, the ENSO Tracker status has
Alexander 2012). recently been raised to El Niño ‘WATCH’
(BoM 2015d).
Figure 8: Dry paddocks near Junee, NSW
CLIMATECOUNCIL.ORG.AU Page 13PARCHED COUNTRY: CLIMATE CHANGE AND DROUGHT IN AUSTRALIA
Trends in heat also play a role in the impacts of Australia’s Millennium
exacerbating the severity of drought. Drought were exacerbated by extreme
The relationship between drought heat, with temperatures 0.3–0.6°C above
and heat is often one of mutual the long-term average (Head et al. 2013).
reinforcement; the reduced soil moisture Australia’s climate has continued to
associated with drought contributes warm over the last century and 2013
to rises in air temperature, and in turn was Australia’s warmest year on record
these hotter conditions further increase (BoM and CSIRO 2013). In addition, hot
loss of soil moisture (Climate Council extremes are becoming more frequent
2014b). For example, it is likely that and intense (IPCC 2014).
Figure 9: A sheep grazes in a dry paddock in Victoria, 2008
Page 14 CLIMATECOUNCIL.ORG.AU4. How is Climate Change
Influencing Drought?
Climate change is exacerbating drought have increased as a result of increasing
conditions in Australia through changes greenhouse gas concentrations (Timbal
in rainfall patterns and increasing and Drosdowsky 2012; CSIRO 2012). The
heat. In the future severe droughts are intensification of the STR is estimated
expected to happen more often. to account for roughly 80 percent of
the recent rainfall decline in southeast
The evidence for the influence of climate
Australia (Murphy and Timbal 2008;
change on observed drought patterns
Climate Commission 2013).
is strongest for southwest Western
Australia and the far southeast of the The observed drying trends during the
continent - Victoria and southern parts cooler months in the southwest and
of South Australia (CSIRO 2012). The southeast of the continent, which are
link is related to the southward shift of likely influenced by climate change
the fronts from the Southern Ocean that already, are expected to continue.
bring rain across southern Australia Average rainfall in southern Australia
during the cool months of the year during the cool season is expected to
(winter and spring) (CSIRO and BoM decline further, and the time spent in
2015). This shift, which is consistent with drought conditions is projected to
the changes in patterns of atmospheric increase with a greater frequency of
circulation expected in a warming severe droughts in the region (CSIRO
climate system, has led to the observed and BoM 2015).
declines in rainfall in the southwest
The ongoing drying trend and projected
and southeast of the continent and the
increase in severe droughts could lead
resulting drought conditions (Timbal and
to decreases in production in Australia’s
Drowdowsky 2012; Climate Commission
most important agricultural regions,
2013).
including the largest catchment and
As part of the changes in atmospheric most productive agricultural area in the
circulation, the subtropical ridge (STR), country, the Murray-Darling basin, and
an area of high pressure that commonly southwest wheat belt (IPCC 2014). The
lies over the Australian continent, has projected drying trend across southern
intensified as global air temperatures Australia could also threaten urban water
“In parts of Southern Australia severe droughts
are expected to continue. ”
CLIMATECOUNCIL.ORG.AU Page 15PARCHED COUNTRY: CLIMATE CHANGE AND DROUGHT IN AUSTRALIA
supplies, as nearly 13 million of Australia’s (IPCC 2013; IPCC 2014; CSIRO and BoM
population is concentrated in the southern 2015), which in turn contributes to an
cities of Perth, Adelaide, Melbourne, increase in the severity of droughts
Canberra and Sydney (ABS 2014). (Climate Commission 2013). Since 2001,
the number of extreme heat records
Climate change is also contributing to an
in Australia has outnumbered extreme
increase in the intensity and frequency
cool records by almost 3 to 1 for daytime
of hot days and heatwaves in Australia
Change in consecutive dry days (CDD) Soil moisture anomalies (SMA)
2046 - 2065 2046 - 2065
2081 - 2100 2081 - 2100
− Dryness + + Dryness −
-0.6 -0.4 -0.2 0 0.2 0.4 0.6 -0.75 -0.50 -0.25 0 0.25 0.50 0.75
Standard Deviation Standard Deviation
Figure 10: Projected annual changes assessed from two indices. Left column: Change
in annual maximum number of consecutive dry days (CDD: days with precipitationmaximum temperatures and almost 5 to Finally, on a global scale, whilst it is
1 for night-time minimum temperatures likely that some regions of the planet
(CSIRO and BoM 2015). Australia’s capital will become increasingly wetter, others
cities have experienced hotter, longer or are likely to experience drier conditions
more frequent heatwaves. For example, as measured by consecutive dry days
the average intensity of heatwaves in and decreases in soil moisture (Figure
Melbourne is now 1.5 °C hotter and they 10). Consistent with the CSIRO and BoM
occur on average 17 days earlier than analysis (2015), southern Australia is one
between 1950 and 1980. Whilst in Sydney, of the regions that is likely to become
heatwaves now start 19 days earlier drier through the century, with some
and the number of heatwave days has other regions, such as the Mediterranean
increased by 50% (Perkins and Alexander and southern Africa, expected to
2013). The IPCC warns that it is very experience particularly severe
likely (over 90 percent probability) that drying trends (IPCC 2012).
warm days will increase and cold days
will decrease in Australia (IPCC 2012). In
addition, it is likely that more frequent
and/or longer heatwaves and warm
spells will occur across the continent
(IPCC 2012). These projected increases
in heat will compound existing
drought conditions in Australia.
CLIMATECOUNCIL.ORG.AU Page 17PARCHED COUNTRY: CLIMATE CHANGE AND DROUGHT IN AUSTRALIA
5. This is the
Critical Decade
The impacts of climate change are Societies will have to adapt to even more
already being observed. Sea levels are serious impacts as the temperature rises.
rising, heatwaves are increasing in For Australia, these impacts include
length and intensity, and southern increases in the severity of drought in
Australia is experiencing a long-term the south, with implications for human
drying trend. health, agriculture, urban water supplies
and the environment. Ensuring that the
We are now more confident than ever
2°C guardrail is not exceeded will prevent
that the emission of greenhouse gases
even worse impacts in the second half of
by human activities, mainly carbon
the century.
dioxide from the combustion of fossil
fuels, is the primary cause for many of The evidence is clear and compelling.
the changes in climate that have been To stabilise the climate, the trend of
observed over the past half-century increasing global emissions must be
(IPCC 2013; 2014). Projections of future halted within the next few years and
climate change and its impacts have emissions must be trending downwards
convinced nations that the global by 2020. Investment in renewable, clean
average temperature, now at 0.85°C energy must therefore increase rapidly.
above the pre-industrial level (IPCC And, importantly, most of the known
2013), must not be allowed to rise above fossil fuel reserves - coal, oil and gas -
2°C, the so-called ‘2°C guardrail’. must remain in the ground.
This is the critical decade to get on
with the job.
Page 18 CLIMATECOUNCIL.ORG.AUReferences
ABC (Australian Broadcasting Corporation) BoM (2012) Climate Glossary: Drought. Bureau of
(2014a) Queensland farmers told to expect ‘tough Meteorology. Accessed at http://www.bom.gov.au/
times’ as drought conditions expected to worsen. climate/glossary/drought.shtml.
11 July 2014. Accessed at http://www.abc.net.au/
BoM (2013) Annual Climate Report 2013. Bureau
news/2014-07-11/qld-farmers-told-to-brace-for-
of Meteorology. Accessed at http://www.bom.gov.
tough-times/5589468.
au/climate/annual_sum/2013/AnClimSum2013_
ABC (2014b) How severe is the drought in LR1.0.pdf.
Queensland and New South Wales? 18 March 2014.
BoM (2014a) The Federation Drought 1895–1902.
Accessed at http://www.abc.net.au/news/
Bureau of Meteorology. Accessed at http://www.
2014-03-12/tony-abbott-drought-severity-
bom.gov.au/lam/climate/levelthree/c20thc/
claim-checks-out/5295232.
drought1.htm.
ABARES (Australian Bureau of Agricultural and
BoM (2014b) The World War II Droughts. Bureau of
Resource Economics and Sciences) (2012) Drought
Meteorology. Accessed at http://www.bom.gov.au/
in Australia: context, policy and management.
lam/climate/levelthree/c20thc/drought3.htm.
Canberra: ABARES report to client. Accessed at
http://www.daff.gov.au/SiteCollectionDocuments/ BoM (2014c) Rainfall Deficiencies: what is a
abares/publications/clientreports/Drought_in_ drought? Bureau of Meteorology. Accessed at
Australia_2012.pdf. http://www.bom.gov.au/climate/drought/.
ABARES (2014) Australian Crop Report: BoM (2014d) Drought Statement: rainfall
September 2014. Canberra. Accessed at: deficiencies worsen in Victoria and Tasmania.
http://data.daff.gov.au/data/warehouse/ Bureau of Meteorology. Accessed at http://www.
aucrpd9abcc003/aucrpd9abcc201409/ bom.gov.au/climate/drought/#tabs=Drought-
AustCropRrt20140909_v1.0.0.pdf. Statement.
ABS (Australian Bureau of Statistics) (2004) Yearbook BoM (2014e) Climate outlook for October to
Australia 2004—Economic Impact of Drought in December: 25 September 2014. Bureau of
2002-03. Canberra, Australia: Australian Bureau of Meteorology. Accessed at http://www.bom.gov.au/
Statistics; 2004. Accessed at http://www.abs.gov.au/ climate/ahead/archive/outlooks/latest-outlook.shtml.
ausstats/abs@.nsf/0/81A2E2F13AA7994BCA256DEA
00053932?opendocument. BoM (2015a) National Climate and Water Briefing,
29 January 2015.
ABS (2014) Regional Population Growth, Australia,
2012–13. The Australian Bureau of Statistics. BoM (2015b) Drought Statement updated on 4
Accessed at http://www.abs.gov.au/ausstats/abs@. March 2015. Accessed at http://www.bom.gov.au/
nsf/Products/3218.0~2012-13~Main+Features~ climate/drought/.
Australian+Capital+Territory?OpenDocument. BoM (2015c) Climate Outlooks issued 26 February
Alston M (2012) Rural male suicide in Australia. 2015. Accessed at http://www.bom.gov.au/climate/
Social Science & Medicine 74:515–522. outlooks/#/overview/summary.
Arblaster JM and Alexander LV (2012) The BoM (2015d) ENSO Tracker: Official status of the El
Impact of the El Niño-Southern Oscillation Niño–Southern Oscillation. Issued 17 March 2015.
on Maximum Temperature Extremes. Accessed at http://www.bom.gov.au/climate/enso/
Geophysical Research Letters 39(20). tracker/.
BCG (Birchip Cropping Group) (2008). Critical Bond RN, Lake SP and Arthington HA (2008). The
breaking point? The effects of drought and other Impacts of Drought on Freshwater Ecosystems: an
pressures on farming families. Final report of the Australian perspective. Hydrobiologia (600): 3–16.
twelve month study. Accessed at http://www. Butt N, Pollock L and McAlpine AC (2013) Eucalypts
daff.gov.au/__data/assets/pdf_file/0008/842246/ face increasing climate stress. Ecology and
Birchip_Cropping_Group.pdf. Evolution (15): 5011–5022.
BoM (Bureau of Meteorology) (2005) El Niño, Carroll N, Fritjers P and Shields MA (2007)
La Niña and Australia’s Climate. Bureau of Quantifying the costs of drought: new evidence
Meteorology. Accessed at http://www.bom.gov.au/ from life satisfaction data. Journal of Population
info/leaflets/nino-nina.pdf. Economics 20:445-461.
BoM (2010) Australian Rainfall Patterns During Climate Commission (2011) The Critical
El Niño Events. Bureau of Meteorology. Accessed Decade: Climate Change and Health. Hughes
at http://www.bom.gov.au/climate/enso/nino L and McMichael M. Accessed at https://www.
comp.shtml. climatecouncil.org.au/commission-climate-
change-and-health.
CLIMATECOUNCIL.ORG.AU Page 19PARCHED COUNTRY: CLIMATE CHANGE AND DROUGHT IN AUSTRALIA
Climate Commission (2013) The Critical Decade Grant BS, Fletcher DT, Feldman D, Saphores JD,
2013: extreme weather by Will Steffen, Lesley Cook LM, Stewardson M, Low K, Burry K and
Hughes and David Karoly. Accessed at https:// Hamilton JA (2013) Adapting Urban Water
www.climatecouncil.org.au/extreme-weather- Systems to a Changing Climate: Lessons from
report. the Millennium Drought in Southeast Australia.
Environmental science & technology 47(19): 10727-
Climate Council (2014a) Unpacking the Fifth
10734.
Assessment Report: impacts, adaptation and
vulnerability by Lesley Hughes. Accessed at Hanigan IC, Butler CD, Kokic PN and Hutchinson
https://www.climatecouncil.org.au/ipcc. MF (2012) Suicide and drought in New South Wales,
Australia, 1970–2007. Proceedings of the National
Climate Council (2014b) Heatwaves: hotter,
Academy of Sciences 109:13950–13955.
longer, more often by Will Steffen, Lesley Hughes
and Sarah Perkins. Accessed at https://www. Haines A, Kovats RS, Campbell-Lendrum D and
climatecouncil.org.au/heatwaves-report. Corvalán C (2006) Climate change and human
health: Impacts, vulnerability and public health.
Collett B and Henry N (2011) Urban Water Supply
Public health, 120(7), 585-596.
Use. The Australian Collaboration. Accessed at
http://www.australiancollaboration.com.au/pdf/ Head L, Adams M, McGregor VH and Toole S
FactSheets/Urban-water-FactSheet.pdf. (2013) Climate Change and Australia. WIREs
Climate Change, 5: 175–197.
CSIRO (The Commonwealth Scientific and Industrial
Research Organisation) (2012) Climate and water Hoang M, Bolto B, Haskard C, Barron O, Gray S
availability in south-eastern Australia: A synthesis and Greg L (2012) Desalination in Australia Report.
of findings from Phase 2 of the South Eastern CSIRO. Accessed at http://www.csiro.au/Portals/
Australian Climate Initiative (SEACI) CSIRO, 41 pp. Publications/Research--Reports/Desalination-In-
Australia-Report.aspx.
CSIRO (2014) Australian Water Availability Project.
CSIRO. Accessed at http://www.eoc.csiro.au/awap/. Horton G, Hanna L and Kelly B (2010) Drought,
drying and climate change: Emerging health issues
CSIRO and BoM (2014) State of the Climate 2014.
for ageing Australians in rural areas. Australasian
CSIRO and Bureau of Meteorology, Melbourne.
Journal on Ageing 29:2–7.
CSIRO and BoM (2015) Climate change in Australia:
Howe C, Jones RN, Maheepala S and Rohdes B
Projections for Australia’s NRM regions. Technical
(2005) Implications of Potential Climate Change
Report, 216pp.
for Melbourne’s Water Resources. Melbourne
DAFF (Department of Agriculture, Fisheries Water. Accessed at http://www.melbournewater.
and Forestry) (2014) Drought and Natural com.au/whatwedo/Liveability-and-environment/
Disaster Declaration: 12 September. Queensland Documents/Climate_Change_Study.pdf.
Government. Accessed at https://www.long
IPCC (Intergovernmental Panel on Climate
paddock.qld.gov.au/queenslanddroughtmonitor/
Change) (2000) IPCC Special Report Emissions
queenslanddroughtreport/.
Scenarios: summary for policy makers. Accessed
DAFF (2015) Drought Declared Areas in Queensland. at https://www.ipcc.ch/pdf/special-reports/spm/
Queensland State Government. Accessed at https:// sres-en.pdf.
www.longpaddock.qld.gov.au/queenslanddrought
IPCC (2012) Field C, Barros V, Stocker T, Qin
monitor/queenslanddroughtreport/index.php.
D, Dokken D, Ebi K, Mastrandrea M, Mach K,
Delworth TL and Zeng F (2014) Regional rainfall Plattner G, Allen S, Tignor M and Midgley P
decline in Australia attributed to anthropogenic (2012) Managing the Risks of Extreme Events and
greenhouse gases and ozone levels. Nature Disasters to Advance Climate Change Adaptation.
Geoscience. Accessed at http://www.nature.com/ In: A Special Report of Working Groups I and II of
ngeo/journal/vaop/ncurrent/full/ngeo2201.html. the Intergovernmental Panel on Climate Change.
Cambridge UK and New York NY USA.
Department of Foreign Affairs and Trade (DFAT)
(2014) Australia’s Environment at a Glance. IPCC (2013) Summary for Policymakers. In:
Australia Government. Accessed at Climate Change 2013: The Physical Science Basis.
http://www.dfat.gov.au/facts/env_glance.html. Contribution of Working Group I to the Fifth
Assessment Report of the Intergovernmental Panel
DPI (Department of Primary Industries NSW) (2014) on Climate Change [Stocker TF, Qin D, Plattner
NSW Seasonal Conditions Report: September 2014. G-K, Tignor M, Allen SK, Boschung J, Nauels A, Xia
NSW State Government. Accessed at http://www. Y, Bex V and Midgley PM (eds.)].
dpi.nsw.gov.au/__data/assets/pdf_file/0009/529380/
nsw-seasonal-conditions-report-sept-2014.pdf. IPCC (2014) Impacts, Adaptation, and Vulnerability.
Contribution of Working Group II to the Fifth
DPI (2015) NSW Seasonal Conditions Report: Assessment Report of the Intergovernmental
February 2015. NSW State Government. Accessed at Panel on Climate change [Field C, Barros V,
http://www.dpi.nsw.gov.au/agriculture/emergency/ Mach K and Mastrandrea M (eds)]. Cambridge
seasonal-conditions/regional-seasonal-conditions- University Press, Cambridge, United Kingdom
reports/seasonal-conditions/feb-2015. and New York, NY USA.
Page 20 CLIMATECOUNCIL.ORG.AUKlamt M, Thompson R and Davis J (2011) Early Timbal B, Arblaster J, Braganza K, Fernandez E,
response of the platypus to climate warming. Global Hendon H, Murphy B, Raupach M, Rakich C, Smith
Change Biology. 17(10): 3011-3018. I, Whan K and Wheeler M (2010). Understanding
the Anthropogenic Nature of the Observed Rainfall
LeBlanc M, Tweed S, Van Dijk A and Timbal B
Decline Across South-Eastern Australia. The Centre
(2012) A review of historic and future hydrological
for Australian Weather and Climate Research.
changes in the Murray Darling Basin. Global
Accessed at http://www.cawcr.gov.au/publications/
Planetary Change (80–81): 226–246.
technicalreports/CTR_026.pdf.
MacNally R, Horrocks G, Lada H, Lake PS, Thomson
Timbal B and Drosdowsky W (2012). The relationship
JR and Taylor AC. (2009) Distribution of anuran
between the decline of south eastern Australia
amphibians in massively altered landscapes in
rainfall and the strengthening of the sub tropical
southeastern Australia: effects of climate change
ridge. International Journal of Climatology 33(4):
in an aridifying region. Global Ecology and
1021–1034.
Biogeography. 18(5): 575-585.
TRA (Tourism Research Australia) (2010) Impact of
Melbourne Water (2013) Annual Report 2012–13.
the Drought on Tourism in the Murray River Region:
Accessed at http://www.melbournewater.com.au/
Summary of Results. Tourism Research Australia
aboutus/reportsandpublications/Annual-Report/
(TRA), Department of Resources, Energy and
Documents/2013_Annual_Report.pdf.
Tourism, Canberra, ACT, Australia, 3 pp.
Melbourne Water (2014) Melbourne Water Use.
Urban Water Security Research Alliance (UWSRA)
The Victorian Government. Accessed at http://
(2011) Impact of Climate Change on Urban
www.melbournewater.com.au/waterdata/wateruse/
Water Security in SEQ. Accessed at http://www.
Pages/default.aspx.
urbanwateralliance.org.au/publications/factsheets/
Murphy B and Timbal B (2008) A review of UWSRA_Fact_Sheet_2.pdf.
recent climate variability and climate change in
van Dijk AIJM, Beck HE, Crosbie RS, de Jeu RAM,
southeastern Australia. International Journal of
Liu YY, Podger GM, Timbal B and Viney NR (2013)
Climatology 28(7): 859–879.
The Millennium Drought in southeast Australia
NSW Office of Water (2010) Climate Change and its (2001–2009): Natural and human causes and
Impacts on Water Supply and Demand in Sydney. implications for water resources, ecosystems,
The Department of Environment, Climate Change economy, and society. Water Resources Research
and Water. Accessed at http://www.metrowater.nsw. 49:1040–1057.
gov.au/sites/default/files/publication-documents/
WC (Water Corporation (Western Australia)) (2012).
climatechange_impact_watersupply_summary.pdf.
Yearly stream flow for major surface water sources.
Perkins S and Alexander L (2013) On the Accessed at http://www.watercorporation.com.
measurement of heatwaves. Journal of Climate. 26: au/d/dams_streamflow.cfm.
4500-4517.
Western Australia Department of Water (2009)
Queensland Water Commission (2010) South Climate change, water demand and water
East Queensland Water Strategy. Queensland availability scenarios to 2030. Government of
Government. Accessed at http://www.dews.qld.gov. Western Australia. Accessed at http://www.water.
au/__data/assets/pdf_file/0019/32734/seqws.pdf. wa.gov.au/PublicationStore/first/88706.pdf.
Reisinger A, Kitching RL, Chiew F, Hughes L, Western Australia Water Corporation (2014) What
Newton PCD, Schuster SS, Tait A and Whetton is the Integrated Water Supply Scheme. Accessed
P (2014) Australasia. In: Climate Change 2014: at http://www.watercorporation.com.au/home/
Impacts, Adaptation, and Vulnerability. Part faqs/water-supply-and-services/what-is-the-
B: Regional Aspects. Contribution of Working integrated-water-supply-scheme
Group II to the Fifth Assessment Report of the
Wittwer G and Griffith M (2011) Modelling drought
Intergovernmental Panel on Climate Change
and recovery in the southern Murray-Darling basin.
[Barros VR, Field CB, Dokken DJ, Mastrandrea MD,
Australian Journal of Agricultural and Resource
Mach KJ, Bilir TE, Chatterjee M, Ebi KL, Estrada
Economics, 55(3): 342-359.
YO, Genova RC, Girma B, Kissel ES, Levy AN,
MacCracken S, Mastrandrea PR and White LL (eds.)] World Bank (2013) Urban Population (% of total).
Cambridge University Press, Cambridge, United Accessed at http://data.worldbank.org/indicator/
Kingdom and New York, NY, USA, pp. 1371-1438. SP.URB.TOTL.IN.ZS.
The Guardian (2014). Southern Australia faces World Bank (2015) GDP growth (annual %). Accessed
water crisis by end of century due to climate at http://data.worldbank.org/indicator/NY.GDP.
change. 14 July 2014. Oliver Millman. Accessed at MKTP.KD.ZG?page=1.
http://www.theguardian.com/science/2014/jul/14/
World Meteorological Organization (WMO) (2014)
southern-australia-faces-water-crisis-by-end-
Atlas of Mortality and Economic Losses from
of-century-due-to-climate-change.
Weather, Climate and Water Extremes (1970–2012).
World Meteorological Organisation no. 1123.
Accessed at http://www.wmo.int/pages/prog/drr/
transfer/2014.06.12-WMO1123_Atlas_120614.pdf.
CLIMATECOUNCIL.ORG.AU Page 21IMAGE CREDITS Cover image: “It can break innumerable times” by Flickr user Lotus Carroll licensed under CC by -NC-SA 2.0 Page 4: Figure 1 “Cows in drought stricken fields, Wagga Wagga NSW” by Flickr user John Shilling licensed under CC by –NC-ND 2.0 Page 5: Figure 2 “Dead trees, South Australia” by Flickr user Gary Sauer- Thompson licensed under CC by –NC 2.0 Page 7: Figure 3 “Recycling water in Melbourne” by Flickr user Louisa Billeter licensed under CC by –NC-SA 2.0 Page 8: Figure 4 “Lake Hume during drought in 2007, Victoria” by Flickr user Tim J Keegan licensed under CC by –SA 2.0 Page 13: Figure 8 “Dry paddocks near Junee, NSW” by Flickr user Tim J Keegan licensed under CC by –SA 2.0 Page 14: Figure 9 “A sheep grazes in dry pasture” by Flickr user Jo Morcom licensed under CC by –NC-SA 2.0.
You can also read