LAKE LEMON MONITORING PROGRAM 2013 RESULTS - May 2014 - Prepared for: Lake Lemon Conservancy District Prepared by: Melissa A.L. Clark& Sarah ...
←
→
Page content transcription
If your browser does not render page correctly, please read the page content below

LAKE LEMON MONITORING PROGRAM
         2013 RESULTS

               Prepared for:

     Lake Lemon Conservancy District

               Prepared by:

     Melissa A.L. Clark& Sarah Powers
  School of Public & Environmental Affairs
             Indiana University
       Bloomington, Indiana 47405

                May 2014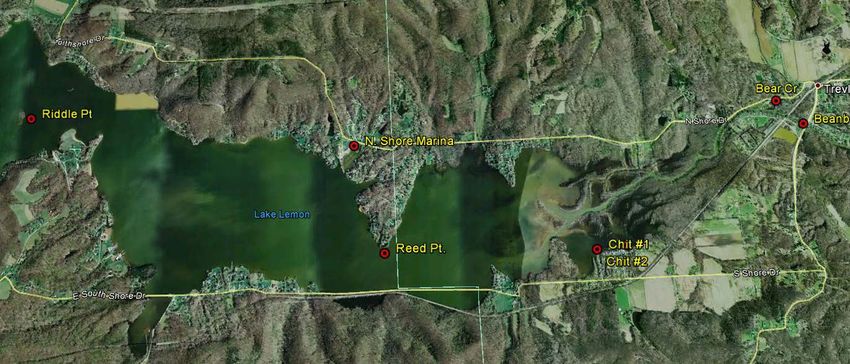
Acknowledgments

         We’d like to thank the following SPEA students for their help in collecting and
analyzing the data used in this report: Dan Warner, Tim Clark, Alex Kian, Chris Hall, Jon
Kruse, Maggie Messerschmidt, and Megan Swartz. We’d also like to thank Bob
Madden and James Van Tassel of the Lake Lemon Conservancy District for their help in
facilitating our sampling efforts.

                                           ii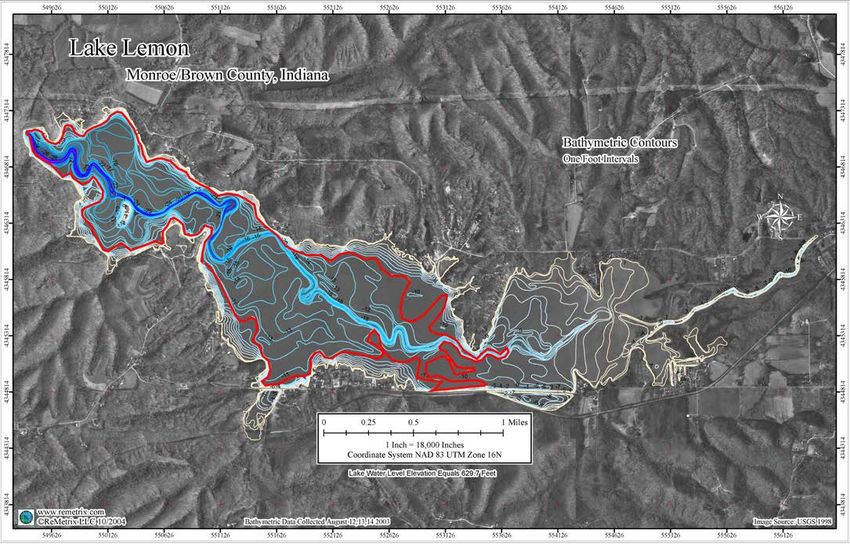
CONTENTS

1.0 INTRODUCTION ...................................................................................................... 1

2.0 METHODS ............................................................................................................... 1

3.0 RESULTS ................................................................................................................. 6
     3.1 Water Quality ................................................................................................. 6
     3.2 Comparison with Other Indiana Lakes......................................................... 17
     3.3 Stream Results ............................................................................................ 17
     3.4 Trophic State ............................................................................................... 20
           3.4.1 Introduction .................................................................................... 20
           3.4.2 Trophic State Indices ..................................................................... 20
           3.4.3 Trophic State Scores ..................................................................... 22

4.0 TROPHIC STATE TRENDS ................................................................................... 23

5.0 WATER QUALITY TRENDS .................................................................................. 25

6.0 CONCLUSIONS ..................................................................................................... 27

7.0 REFERENCES ....................................................................................................... 30

                                                              iii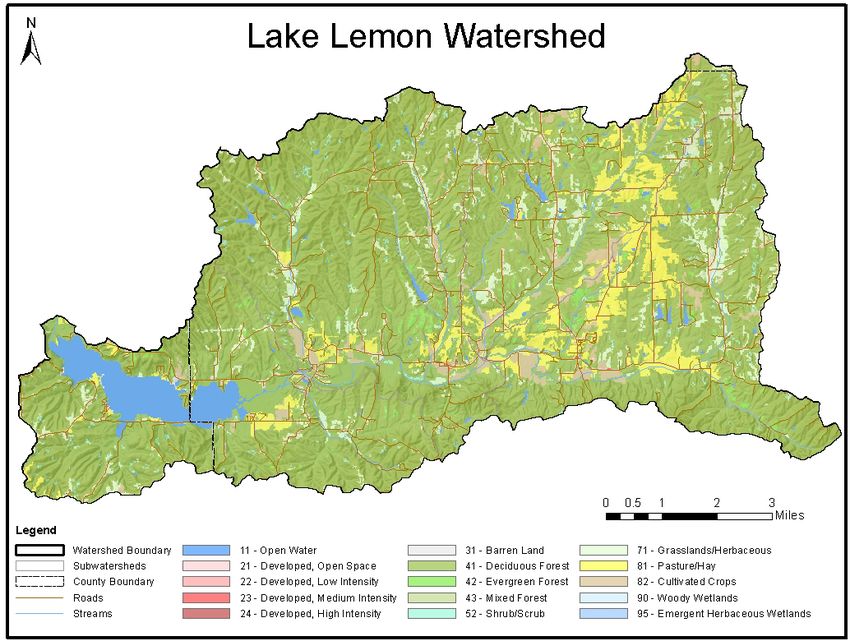
1.0 INTRODUCTION

       The Lake Lemon Conservancy District (LLCD) has entered into a lease
agreement with the City of Bloomington Utilities Service Board (USB) to maintain Lake
Lemon in such condition necessary to protect the lake’s water quality consistent with its
potential use as a drinking water source. LLCD also agreed to maintain the lake in such
condition to meet all state and federal requirements for recreational waters and to
maintain the quality of the water in the lake at least at its present level.

       The LLCD has contracted with Indiana University’s School of Public &
Environmental Affairs (SPEA) to evaluate the condition of Lake Lemon since 1997. This
report is the result of SPEA’s 2013 monitoring efforts.

2.0 METHODS

       The water sampling and analytical methods used for Lake Lemon were consistent
with those used in IDEM’s Indiana Clean Lakes Program and IDNR’s Lake and River
Enhancement Program. We collected water samples for various parameters on 5/8/13,
6/17/13, and 7/31/13 from over the point of maximum depth off Cemetery Island near
Riddle Point and in the channel off Reed Point in the eastern end of Lake Lemon (Figure
1).

 Figure 1. Sampling locations for the Lake Lemon Water Monitoring Program, 2013.

         We collected water samples from one meter below the surface (epilimnion) and
from one meter above the bottom (hypolimnion) at each lake site that was thermally
stratified, except the Chitwood site where we only sampled the epilimnion due to the very
shallow channel. These samples were preserved as needed, placed in coolers and
transported to our laboratory for analysis. Chlorophyll was determined only for the
epilimnetic sample.      Other parameters such as Secchi disk transparency, light
transmission, and oxygen saturation are single measurements. In addition, dissolved

                                           1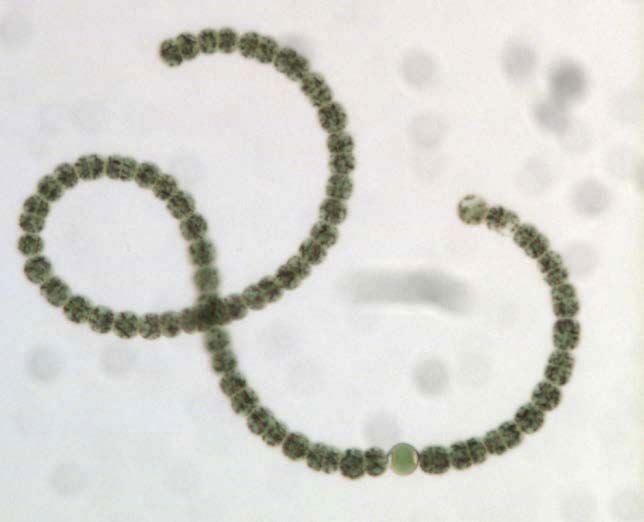
oxygen and temperature were measured at one-meter intervals from the surface to the
bottom. A tow to collect zooplankton was made from the 1% light level to the water
surface.      An integrated sampler was used to collect phytoplankton within the first
two meters of the water column.

       Because Lake Lemon’s condition is heavily influenced by runoff from its
watershed, it was also important to monitor the main inlet to the lake - Beanblossom
Creek. Therefore, we sampled Beanblossom Creek on 5/8/13 and 7/31/13 during base
flow conditions and 5/31/13 to capture a high flow event, at one location at mid-depth
near its discharge point to the lake.

       The following parameters were measured for both the lake and stream samples:
              -   pH                                          -   soluble reactive
              -   alkalinity                                      phosphorus
              -   conductivity                                -   nitrate+nitrite
              -   dissolved oxygen                            -   ammonia
              -   temperature                                 -   total organic nitrogen
              -   total phosphorus                            -   total suspended solids
                                                              -   fecal coliform bacteria

      In addition to the water sampling stations described above, we also monitored
several other locations for fecal coliform bacteria. At the Chitwood addition, we collected
water samples from just inside the entrance (Chitwood #1) and ¾ of the way down the
main channel (Chitwood #2), Bear Creek and the North side Marina drainage inlet to
Lake Lemon (Figure 1 and 2).

Figure 2.    Zoomed in eastern section of Lake Lemon for the two Chitwood sampling
locations.

                                            2
All sampling techniques and laboratory analytical methods were performed in
accordance with procedures in Standard Methods for the Examination of Water and
Wastewater, 21th Edition (APHA, 2005). Phytoplankton counts were made using a
nannoplankton chamber (PhycoTech, Inc.) and a phase contrast light microscope and
zooplankton counted using a standard Sedgewick-Rafter counting cell. Fifteen fields per
cell were counted for phytoplankton and the entire slide was counted for zooplankton.
Plankton identifications were made according to: Wehr and Sheath (2003), Prescott
(1982), Ward and Whipple (1959) and Whitford and Schumacher (1984).
The comprehensive evaluation of lakes and streams require collecting data on a
number of different, and sometimes hard-to-understand, water quality parameters.
Some of the more important parameters that we analyze include:
Temperature. Temperature can determine the form, solubility, and toxicity of a broad
range of aqueous compounds. Likewise, life associated with the aquatic environment in
any location has its species composition and activity regulated by water temperature.
Since essentially all aquatic organisms are ‘cold-blooded’ the temperature of the water
regulates their metabolism and ability to survive and reproduce effectively (EPA, 1976).
The Indiana Administrative Code (327 IAC 2-1-6) sets maximum temperature limits to
protect aquatic life for Indiana streams. For example, temperatures during the month of
May should not exceed 80 oF (23.7 oC) by more than 3 oF (1.7 oC). June temperatures
should not exceed 90 oF (32.2 oC).
Dissolved Oxygen (D.O). D.O. is the dissolved gaseous form of oxygen. It is essential
for respiration of fish and other aquatic organisms. Fish need at least 3-5 mg/L of D.O.
Cold-water fish such as trout generally require higher concentrations of D.O. than warm
water fish such as bass or Bluegill. The IAC sets minimum D.O. concentrations at 6
mg/L for cold-water fish. D.O. enters water by diffusion from the atmosphere and as a
byproduct of photosynthesis by algae and plants. Excessive algae growth can over-
saturate (greater than 100% saturation) the water with D.O. Conversely, dissolved
oxygen is consumed by respiration of aquatic organisms, such as fish, and during
bacterial decomposition of plant and animal matter.
Conductivity. Conductivity is a measure of the ability of an aqueous solution to carry
an electric current. This ability depends on the presence of ions: on their total
concentration, mobility, and valence (APHA, 1998). During low discharge, conductivity is
higher than during storm water runoff because the water moves more slowly across or
through ion containing soils and substrates during base flow. Carbonates and other
charged particles (ions) dissolve into the slow-moving water, thereby increasing
conductivity measurements.
pH. The pH of water is a measure of the concentration of acidic ions (specifically H+)
present in the water. The pH also determines the form, solubility, and toxicity of a wide
range of other aqueous compounds. The IAC establishes a range of 6-9 pH units for the
protection of aquatic life.
2Alkalinity. Alkalinity is a measure of the acid-neutralizing (or buffering) capacity of
water. Certain substances, if present in water, like carbonates, bicarbonates, and
sulfates can cause the water to resist changes in pH. A lower alkalinity indicates a lower
buffering capacity or a decreased ability to resist changes in pH. During base flow
conditions, alkalinity is usually high because the water picks up carbonates from the
bedrock. Alkalinity measurements are usually lower during storm flow conditions
because buffering compounds are diluted by rainwater and the runoff water moves
across carbonate-containing bedrock materials so quickly that little carbonate is
dissolved to add additional buffering capacity.
Nitrogen. Nitrogen is an essential plant nutrient found in fertilizers, human and animal
wastes, yard waste, and the air. About 80% of the air we breathe is nitrogen gas.
Nitrogen gas diffuses into water where it can be “fixed”, or converted, by Blue-green
algae to ammonia for their use. Nitrogen can also enter lakes and streams as inorganic
nitrogen and ammonia. Because of this, there is an abundant supply of available
nitrogen to aquatic systems. The three common forms of nitrogen are:
Nitrate (NO3-) – Nitrate is an oxidized form of dissolved nitrogen that is converted
to ammonia by algae. It is found in streams and runoff when dissolved oxygen is
present, usually in the surface waters. Ammonia applied to farmland is rapidly
oxidized or converted to nitrate and usually enters surface and groundwater as
nitrate. The Ohio EPA (1999) found that the median nitrate-nitrogen
concentration in wadeable streams that support modified warmwater habitat
(MWH) was 1.6 mg/L. Modified warmwater habitat was defined as: aquatic life
use assigned to streams that have irretrievable, extensive, man-induced
modification that preclude attainment of the warmwater habitat use (WWH)
designation; such streams are characterized by species that are tolerant of poor
chemical quality (fluctuating dissolved oxygen) and habitat conditions (siltation,
habitat amplification) that often occur in modified streams (Ohio EPA, 1999).
Nitrate concentrations exceeding 10 mg/L in drinking water are considered
hazardous to human health (Indiana Administrative Code IAC 2-1-6).
Ammonia (NH4+) – Ammonia is a form of dissolved nitrogen that is the preferred
form for algae use. It is the reduced form of nitrogen and is found in water where
dissolved oxygen is lacking. Important sources of ammonia include fertilizers and
animal manure. In addition, bacteria produce ammonia as a by-product as they
decompose dead plant and animal matter. Both temperature and pH govern the
toxicity of ammonia for aquatic life.
Organic Nitrogen (Org N) – Organic nitrogen includes nitrogen found in plant
and animal materials. It may be in dissolved or particulate form. In the analytical
procedures, total Kjeldahl nitrogen (TKN) was analyzed. Organic nitrogen is TKN
minus ammonia.
Phosphorus. Phosphorus is an essential plant nutrient, and the one that most often
controls aquatic plant (algae and macrophyte) growth in freshwater. It is found in
3fertilizers, human and animal wastes, and yard waste. There are few natural sources of
phosphorus to streams other than what is attached to soil particles, and there is no
atmospheric (vapor) form of phosphorus. For this reason, phosphorus is often a limiting
nutrient in aquatic systems. This means that the relative scarcity of phosphorus may
limit the ultimate growth and production of algae and rooted aquatic plants. Therefore,
management efforts often focus on reducing phosphorus inputs to receiving waterways
because: (a) it can be managed and (b) reducing phosphorus can reduce algae
production. Two common forms of phosphorus are:
Soluble reactive phosphorus (SRP) – SRP is dissolved phosphorus readily
usable by algae. SRP is often found in very low concentrations in phosphorus-
limited systems where the phosphorus is tied up in the algae themselves.
Because phosphorus is cycled so rapidly through biota, SRP concentrations as
low as 0.005 mg/L are enough to maintain eutrophic or highly productive
conditions in lake systems (Correll, 1998). Sources of SRP include fertilizers,
animal wastes, and septic systems.
Total phosphorus (TP) – TP includes dissolved and particulate phosphorus. TP
concentrations greater than 0.03 mg/L (or 30µg/L) can cause algal blooms in
lakes and reservoirs. The Ohio EPA (1999) found that the median TP in
wadeable streams that support MWH for fish was 0.28 mg/L.
Total Suspended Solids (TSS). A TSS measurement quantifies all particles suspended
and dissolved in stream water. Closely related to turbidity, this parameter quantifies
sediment particles and other solid compounds typically found in stream water. In
general, the concentration of suspended solids is greater during high flow events due to
increased overland flow. The increased overland flow erodes and carries more soil and
other particulates to the stream. Although the State of Indiana sets no standard for TSS,
total dissolved solids should not exceed 750 mg/L. In general, TSS concentrations >80
mg/L have been found to be deleterious to aquatic life (Waters, 1995).
E. coli and Fecal Coliform Bacteria - is used as an indicator organism to identify the
potential for the presence of pathogenic organisms in a water sample. Pathogenic
organisms can present a threat to human health by causing a variety of serious
diseases, including infectious hepatitis, typhoid, gastroenteritis, and other gastrointestinal
illnesses. Fecal coliforms can come from the feces of any warm-blooded animal.
Wildlife, livestock, and/or domestic animal defecation, manure fertilizers, previously
contaminated sediments, and failing or improperly sited septic systems are common
sources of the bacteria. The IAC sets the maximum standard at 200 colonies/100 ml in
any one sample within a 30-day period or a geometric mean of 125 colonies per 100 ml
for five samples collected in any 30-day period. In general, fecal coliform bacteria have
a life expectancy of less than 24 hours.
Secchi Disk Transparency. This refers to the depth to which the black & white Secchi
disk can be seen in the lake water. Water clarity, as determined by a Secchi disk, is
affected by two primary factors: algae and suspended particulate matter. Particulates
4(for example, soil or dead leaves) may be introduced into the water by either runoff from
the land or from sediments already on the bottom of the lake. Many processes may
introduce sediments from runoff; examples include erosion from construction sites,
agricultural lands, and riverbanks. Bottom sediments may be resuspended by bottom
feeding fish such as carp, or in shallow lakes, by motorboats or strong winds.
Light Transmission. Similar to the Secchi disk transparency, this measurement uses a
light meter (photocell) to determine the rate at which light transmission is diminished in
the upper portion of the lake’s water column. Another important light transmission
measurement is determination of the 1% light level. The 1% light level is the water depth
to which one percent of the surface light penetrates. This is considered the lower limit of
algal growth in lakes and is referred to as the photic zone.
Plankton. Plankton are important members of the aquatic food web. The plankton
include the algae (microscopic plants) and the zooplankton (tiny shrimp-like animals that
eat algae). The zooplankton net is towed up through the lake’s water column from the
one percent light level to the surface utilizing a 80-micron mesh on the net and bucket.
Beginning in 2010, phytoplankton were sampled using a 2-meter integrated sampler and
in the lab whole water samples of phytoplankton were concentrated using Utermoehl
settling chambers. Either 25-ml or 50-ml of sample is concentrated to insure sufficient
cell density. Settled concentrate is transferred into a 2-mL micro-centrifuge tube for
storage. Counts are made using a nanoplankton chamber (PhycoTech, Inc.) and a
phase contrast light microscope. Historically in our analysis of Lake Lemon algae are
reported as natural units, which records one colonial filament of multiple cells as one
natural unit and one cell of a singular alga also as one natural unit. According to the
literature, (Ward and Whipple, 1959; Prescott, 1982; Whitford and Schumacher, 1984;
Wehr and Sheath, 2003; and St. Amand, 2010) in order to provide a more accurate
representation of lake algal community composition, in 2011, we have also included
counts of only individual cells. For example, the previous method would count a single
filamentous green algae (ie: Ulothrix) with 20 cells or 10 cells as one unit, whereas the
new method would default to a count of 20 or 15 individual cells (Figure 3). Ten to thirty
(based on variability of cells per natural unit) representative specimens were selected at
random and a mean number of cells per natural unit was calculated. Final counts of each
genera appear lower however, because they are reported as # of cells per milliliter as
opposed to natural units per L. In this report we report only cell counts in replacement of
natural units. Of the many different algal species present in the water, we are particularly
interested in the blue-green algae. Blue-green algae are those that most often form
nuisance blooms and their dominance in lakes may indicate poor water conditions.
Chlorophyll-a. The plant pigments of algae consist of the chlorophylls (green color) and
carotenoids (yellow color). Chlorophyll-a is by far the most dominant chlorophyll pigment
and occurs in great abundance. Thus, chlorophyll-a is often used as a direct estimate of
algal biomass.
5Figure 3. Phytoplankton can be counted
with two techniques: natural unit per liter
(N.U./L) and cells per milliliter (cells/ml).
Colonial species, like this blue-green algae
can be enumerated using both methods.
This Anabaena is counted as one (1) N.U./L,
whereas it would be also counted as 74
cells/ml.
3.0 RESULTS
3.1 Water Quality
Temperature – Temperature profiles for May, June and July indicated slight
thermal stratification at Riddle Point, while Reed Point primarily illustrates no stratification
(Figures 4 and 5). In most Indiana lakes, thermal stratification is weakest in the spring
and gets stronger as summer progresses. The May temperatures at Riddle Point
indicate thermal stratification, with the warmer surface 19.7°C surface temperature and
13.4°C bottom temperature. By June, the Riddle Point temperature profile was more
strongly stratified with the hypolimnion starting at 3m deep. The whole water column
continued to warm with the July surface temperature reaching 25.2°C and the
hypolimnion reaching 23.8°C and the hypolimnion extending to the depth of 5m
respectively. Reed Point basically was isothermal throughout the whole summer, with a
slight temperature decrease at the 1m depth in July, which is likely due to calm water
conditions reducing the mixing of this shallow sampling site. Reed Point is shallow
enough that turbulence from winds and boating activity usually keeps it well mixed.
6Lake Lemon Temperature and Dissolved Oxygen Profiles - Riddle Point
0
1
2
Temp - 5/8
3 D.O. - 5/8
Depth (m)
4 Temp - 6/17
5 D.O. - 6/17
Temp - 7/31
6
D.O. - 7/31
7
8
0 5 10 15 20 25 30
mg/L and °C
Figure 4. Temperature and dissolved oxygen profiles for Lake Lemon at Riddle Point on
5/8/13, 6/17/13, and 7/31/13.
Lake Lemon Temperature and Dissolved Oxygen Profiles - Reed Point
0
1
Temp - 5/8
2
D.O. - 5/8
Depth (m)
3 Temp - 6/17
D.O. - 6/17
4
Temp - 7/31
5 D.O. - 7/31
6
0 5 10 15 20 25 30
mg/L and °C
Figure 5. Temperature and dissolved oxygen profiles for Lake Lemon at Reed Point on
5/8/13, 6/17/13, and 7/31/13.
7Dissolved Oxygen – Dissolved oxygen (D.O.) profiles generally follow the
temperature profiles. Typically, early spring profiles are characterized by an orthograde
oxygen profile, where the oxygen concentrations remain uniform throughout the water
column because of recent spring turnover. While neither site illustrated this orthograde
temperature profile, the May profile results a fully oxic water column. Riddle Point was
characterized by a clinograde oxygen profile by June, where oxygen levels decrease
below the thermocline and continue to decrease rapidly. The upper 4 meters of water
remained oxygenated during both June and July sampling at Riddle Point (Figures 4).
The July dissolved oxygen concentrations averaged 7.5 mg/L in the epilimnion. Anoxic
conditions develop below 4 meters depth, which are likely due to significant organic
matter on the lake bottom, creating a biochemical oxygen demand (BOD) that results in
decomposition processes consuming all the available oxygen. Because stratification
does not allow surface water to mix into this deeper water, oxygen is not replenished.
The shallow depth of Reed Point and lake turbulence keep this portion of the lake well-
mixed and oxygenated (Figure 5). The decreased dissolved oxygen at 3m at Reed is
likely the consequence of a very calm night, which allowed that shallow area to slightly
thermally stratify and permitted the bottom meter to near anoxia due to decomposition.
Phosphorus – Water quality data for Lake Lemon are presented in Tables 1- 3.
Phosphorus and nitrogen are the primary plant nutrients in lakes. Typically, mean total
phosphorus (TP) concentrations increase throughout the summer within Lake Lemon
due to watershed inputs (Figure 6). Soluble phosphorus (SRP) concentrations are lower
than total phosphorus because algae rapidly take up and use soluble phosphorus. Mean
SRP concentrations were below the method detection (0.01 mg/L) limit in all samples
with exception of the July Reed Point sample (0.145 mg/L). All spring and summer TP
concentrations were greater than the level indicative of eutrophication (0.030 mg/L),
except the June Riddle Point epilimnetic sample.
Nitrogen – Typically we only detect low concentrations of nitrate-nitrogen
throughout the sampling season. The 2012 spring sampling event captured spring runoff
following spring fertilizer application, which resulted in elevated nitrate concentrations
during April and June. Nitrate concentrations decreased to the minimum detection level
(0.013 mg/L) in June and July at Riddle and Reed Points (Figure 7). Nitrate, an oxidized
form of inorganic nitrogen, is highly soluble in water and is carried into the lake from
fertilized agricultural fields, livestock, and other sources by watershed runoff. Ammonia,
a reduced form of inorganic nitrogen, is the primary by-product of bacterial
decomposition of organic matter and is also found in animal wastes. Riddle Point
ammonia concentrations initially decreased following the May sample but then increased
throughout the summer in the hypolimnion to 0.187 mg/L (Figure 8). The increased
ammonia concentrations are due to thermal stratification and anoxic conditions within the
hypolimnion coupled with significant decomposition of organic matter, which generates
ammonia as a by-product. The Reed Point ammonia concentrations typically remain
lower throughout the summer. Sufficient mixing within the shallower waters of Reed
Point usually keeps the water column oxygenated preventing the concentration of the
chemically-reduced ammonia. Very calm water and wind conditions can allow short-term
and temporary thermal stratification within the bottom 2 meters. During these periods
8ammonia concentrations can increase due to the reduced environment, then mixing
throughout when turbulence returns.
Table 1. Water Quality Characteristics of Lake Lemon – Riddle Point and Reed Point,
5/8/2013.
Riddle Reed
Parameter
Epilimnion Hypolimnion Epilimnion
Secchi (m) 1.2 -- 1
Light trans @ 3' (%) 13.3 -- 7.8
1% Light Level (ft) 11.5 -- 8
% Water Column Oxic 100 -- 100
pH 7.7 6.7 7.4
Conductivity (uS/cm)) 0.179 0.192 0.192
Alkalinity (mg/L) 53 56 59
Total Suspended Solids (mg/L) 5.5 19.2 8.3
Nitrate (mg/L) 0.083 0.085 0.104
Ammonia (mg/L) 0.047 0.167 0.0285
Total Organic Nitrogen (mg/L) 0.416 0.435 0.702
Soluble Reactive Phosphorus (mg/L) 0.010* 0.010* 0.010*
Total Phosphorus (mg/L) 0.030 0.035 0.044
Chlorophyll-a (ug/L) 1.925 -- 3.08
Plankton (Cells/ml) 1,272 -- 505
Plankton (#/L) 217,440 -- 91,272
Blue-green dominance NU (%) 47 -- 37.6
Blue-green dominance – cells/ml (%) 88.9 -- 86.5
* Method Detection Limit
9Table 2. Water Quality Characteristics of Lake Lemon – Riddle Point and Reed Point,
6/17/13.
Riddle Reed
Parameter
Epilimnion Hypolimnion Epilimnion
Secchi (m) 0.8 -- 0.75
Light trans @ 3' (%) 0.1564 -- 0.06
1% Light Level (ft) 3.5 -- 7
% Water Column Oxic 62.5 -- 100
pH 6.55 6.7 6.9
Conductivity (uS/cm) 0.199 0.217 0.201
Alkalinity (mg/L) 65.75 68.5 68
Total Suspended Solids (mg/L) 7.1 17 10.1
Nitrate (mg/L) 0.013* 0.013* 0.013*
Ammonia (mg/L) 0.018* 0.039 0.018*
Total Organic Nitrogen (mg/L) 0.561 0.279 0.479
Soluble Reactive Phosphorus (mg/L) 0.011 0.010* 0.145
Total Phosphorus (mg/L) 0.010* 0.040 0.016
Chlorophyll-a (ug/L) 13.14 -- 15.14
Plankton (Cells/ml) 39,309 -- 643
Plankton (#/L) 5,804,272 -- 109,272
Blue-green dominance NU (%) 46.5 -- 46.7
Blue-green dominance – cells/ml (%) 81.7 -- 88.6
* Method Detection Limit
10Table 3. Water Quality Characteristics of Lake Lemon – Riddle Point and Reed Point,
7/31/13.
Riddle Reed
Parameter
Epilimnion Hypolimnion Epilimnion
Secchi (m) 0.5 -- 0.4
Light trans @ 3' (%) 3.36 -- 2.03
1% Light Level (ft) 6 -- 5
% Water Column Oxic 83 --
pH 8.1 7.1 8.1
Conductivity (uS/cm)) 0.208 0.274 0.211
Alkalinity (mg/L) 71 83.5 74.5
Total Suspended Solids (mg/L) 9 14 12
Nitrate (mg/L) 0.013* 0.013* 0.013*
Ammonia (mg/L) 0.018* 0.186 0.018*
Total Organic Nitrogen (mg/L) 0.939 1.048 1.134
Soluble Reactive Phosphorus (mg/L) 0.010* 0.010* 0.010*
Total Phosphorus (mg/L) 0.038 0.080 0.051
Chlorophyll-a (ug/L) 35.46 -- 27.55
Plankton (Cells/ml) 4,445 -- 4,281
Plankton (#/L) 505,268 -- 950,038
Blue-green dominance NU (%) 88.3 -- 96.9
Blue-green dominance – cells/ml (%) 92.7 -- 83.2
* Method Detection Limit
11Mean Total Phosphorus
0.07
0.06
0.05
0.04
mg/L
0.03 Reed
Riddle
0.02
0.01
0
4/26 5/6 5/16 5/26 6/5 6/15 6/25 7/5 7/15 7/25 8/4 8/14
Figure 6. Mean total phosphorus concentrations at Riddle and Reed Point during summer
2013.
Mean Nitrate
0.12
0.1 Reed
Riddle
0.08
mg/L
0.06
0.04
0.02
0
4/26 5/6 5/16 5/26 6/5 6/15 6/25 7/5 7/15 7/25 8/4 8/14
Figure 7. Mean nitrate concentrations at Riddle and Reed Point during summer 2013.
12Mean Ammonia
0.12
0.1
0.08
mg/L
0.06 Reed
Riddle
0.04
0.02
0
4/26 5/6 5/16 5/26 6/5 6/15 6/25 7/5 7/15 7/25 8/4 8/14
Figure 8. Mean ammonia concentrations at Riddle and Reed Point during summer 2013.
Plankton – Lake Lemon is characterized by relatively low to average plankton
densities. Usually, Lake Lemon is characterized by lower spring densities that increase
by July and August. In 2013, Riddle plankton counts increased by mid-June but at a
lower rate, which is most likely due to the flushing effect of the multiple storm events that
occurred prior to sampling (Table 4). Reed plankton counts were generally lower in
densities (Table 5). Typically, the plankton assemblage shifted towards a strongly
dominant blue-green algae proportion by August, which is definitely the case with blue-
green dominating both late July samples at approximately 90%. Blue-green algae are
less desirable in lakes because they: 1) may form extremely dense nuisance blooms; 2)
may cause taste and odor problems; and 3) are unpalatable as food for many
zooplankton grazers. Blue-green algae usually have an advantage over other plankton
tend to dominate reaching nuisance proportions. These competitive advantages include:
1) ability to regulate buoyancy and thus stay up in the light, 2) nitrogen fixation, and 3)
more efficient use of nutrients. Dominant blue-green algae populations are typical of
temperate lakes with high nutrient availability, especially from a large watershed that is
predominately agriculture.
Zooplankton, which are microscopic animals equivalent to cows grazing in the
pasture, feed on phytoplankton (Figure 10). Zooplankton densities significantly
increased by late July. Typically, rotifer populations (small zooplankton) dominate at
both Riddle and Reed Point samples over Cladacera and Copepod populations (large
zooplankton).
Transparency – The low Secchi disk transparencies in Lake Lemon are a
reflection of the relatively high amount of suspended material (sediments, algae, etc.) in
the water. Both Riddle and Reed start the season with transparencies just over 1 m and
13decrease to half a meter by end of July. Sources of suspended sediments to Lake
Lemon include soils washed in from the watershed, resuspended lake sediments, and
algal cells produced within the lake. The fine clays and silts of the sediments (Zogorski
et al., 1986) can be suspended in the shallow east end of the lake by wind directed along
the main west-east axis of the lake. In addition, turbulence from motorboats is capable
of resuspending fine clay sediments from a depth exceeding ten feet (Yousef et al.,
1978). All of these actions likely contribute to the poor clarity of Lake Lemon and of
shallow lakes in general.
Figure 10. Generalized aquatic
food chain. Tiny shrimp-like
animals called zooplankton eat
algae. Zooplankton, in turn, are
eaten by small plankton-eating
fish such as minnows, gizzard
shad and young sunfish.
14Table 4. Phytoplankton and Zooplankton Community for Lake Lemon at Riddle Point,
enumerated as # cells/ml for phytoplankton and # Natural Units per liter for zooplankton.
5/8/13 6/17/13 7/31/13
Phytoplankton Total Total Total
% % %
(Algae) (Cells/ml) (Cells/ml) (Cells/ml)
Blue-greens 1,131 88.92% 32,124 81.72% 4,121 92.71%
Greens 68 5.35% 6,558 16.68% 298 6.70%
Diatoms 27 2.12% 393 1.00% 19 0.43%
Other algae 46 3.62% 234 0.60% 7 0.16%
Total Phytoplankton 1,272 39,309 4,445
Total Total Total
Zooplankton
(#/L) (#/L) (#/L)
Rotifers 46 81 199
Zooplankton* 206 281 48
*Zooplankton counts include Cladocera and Copepods.
Table 5. Phytoplankton and Zooplankton Community for Lake Lemon at Reed Point,
enumerated as # cells/ml for phytoplankton and # Natural Units per liter for zooplankton.
5/8/13 6/17/13 7/31/13
Phytoplankton Total Total Total
% % %
(Algae) (Cells/ml) (Cells/ml) (Cells/ml)
Blue-greens 437 86.53% 570 89% 3,563 74.17%
Greens 49 9.70% 33 5% 719 14.97%
Diatoms 5 0.99% 28 4% 44 0.9%
Other algae 14 2.77% 7 1% 478 9.95%
Total phytoplankton 505 638 4,804
Total Total Total
Zooplankton
(#/L) (#/L) (#/L)
Rotifers 44 1 1
Zooplankton* 222 4641 0
*Zooplankton counts include Cladocera and Copepods.
Chlorophyll-a – Chlorophyll-a, which is a measure of the primary pigment in algae,
is a direct measure of algal productivity. In the integrated samples from the surface to
the 2-meter depth, the chlorophyll-a concentrations ranged from 1.925 μg/L in May to
35.46 μg/L in July. Chlorophyll-a concentrations >7 µg/L are indicative of eutrophic lake
conditions. Overall, we see a seasonal pattern of nutrient increase by late summer,
which is characteristic of Lake Lemon. This pattern is mirrored by increases in
chlorophyll-a concentrations. This suggests that conditions exist for increasing growth of
algae (Figure 11 and 12).
15Seasonal Changes - Riddle Point Epilimnion
40 0.04
Chl-a
35 0.04
TSS
Chl a (mg/L), TSS (mg/L)
30 0.03
TP
25 0.03
TP (mg/L)
20 0.02
15 0.02
10 0.01
5 0.01
0 0.00
4/26 5/6 5/16 5/26 6/5 6/15 6/25 7/5 7/15 7/25 8/4 8/14
Date
Figure 11. Seasonal changes in total phosphorus, total suspended solids, and
chlorophyll-a in the surface waters (epilimnion) at Riddle Point in Lake Lemon in 2013.
Seasonal Changes - Reed Point Epilimnion
30 0.06
Chl-a
25 TSS 0.05
Chl a (mg/L), TSS (mg/L)
TP
20 0.04
TP (mg/L)
15 0.03
10 0.02
5 0.01
0 0
4/26 5/6 5/16 5/26 6/5 6/15 6/25 7/5 7/15 7/25 8/4 8/14
Date
Figure 12. Seasonal changes in total phosphorus, total suspended solids, and
chlorophyll-a in the surface waters (epilimnion) at Reed Point in Lake Lemon in 2013.
163.2 Comparison with Other Indiana
Table 6 gives values of water quality parameters determined for 355 Indiana lakes
during July-August 1998-2010 by the Indiana Clean Lakes Program. This table can be
used to compare values determined for Lake Lemon with other Indiana lakes. Table 6
shows that only chlorophyll-a exceeded the median values for these 355 lakes, but fell
well below the maximum concentrations.
Table 6. July-August Water Quality Characteristics of 355 Indiana Lakes Sampled From
1998 thru 2010 by the Indiana Clean Lakes Program compared to Riddle Point of Lake
Lemon (7/31/13). Means of epilimnion and hypolimnion samples were used for Lake
Lemon.
Secchi NO3 NH4 TKN TP SRP Chl. a
Disk (m) (mg/L) (mg/L) (mg/L) (mg/L) (mg/L) (µg/L)
Median 1.7 0.046 0.455 1.199 0.082 0.028 4.42
Maximum 16 16.679 16.348 20.873 4.894 1.427 380.38
Minimum 0.1 0.013* 0.018* 0.230* 0.010* 0.010* 0.010
Mean Values
for Riddle Pt. 0.5 0.013* 0.102 0.993 0.059 0.010* 35.46
(7/31/13)
* Method Detection Limit
3.3 Stream Results
Results from the Beanblossom Creek samples are given in Table 7. Stream
values generally fell within the range of lake parameters. Variation among the sample
parameters was slight. Historically, most of the parameters increased throughout the
summer. Solubility of oxygen in water is influenced by temperature, with less dissolved
oxygen dissolving in warmer water. Beanblossom Creek’s late July temperature
(23.0°C) resulted in a decreased dissolved oxygen concentration (5.9 mg/L). Storm
event samples were collected on May 31st (Figure 13). There was no significant
increase in any nutrients or other parameters, which is likely due to smaller previous
storms flushing the tributaries and since we collected samples towards the beginning of
the sampled storm event.
17Table 7. Water Quality Characteristics of Beanblossom Creek, Bear Creek, and the small
stream that enters Lake Lemon from the North Shore Marina in 2013. Bear Creek and the
North Shore Marina Creek only included TSS and F. coliform bacteria analysis.
Beanblossom Creek Bear Creek North Shore Marina Creek
5/31 5/31 5/31
5/8 7/31 5/8 7/31 5/8 7/31
(Storm) (Storm) (Storm)
pH 7 6.8 7.4
Conductivity
0.203 0.220 0.311
(mS/cm)
Alk (mg/L) 64 92 112
Temperature (°C) 16.4 23.6 23.0
D.O. (mg/L) 7.7 6.4 5.9
TSS (mg/L) 4.3 9.5 7 3 8 6.5 2 98.8 15
-
NO3 (mg/L) 0.169 0.103 0.053
NH4+ (mg/L) 0.026 0.085 0.018*
TKN (mg/L) 0.215 -- 0.595
SRP (mg/L) 0.010* 0.010* 0.010*
Total Phos (mg/L) 0.027 0.031 0.054
Fecal Coliform
50,800 53,096 64 34,060 17,240 16 7,920 TNTC** 48
(col/100ml)
* Method Detection Limit
** TNTC = Too Numerous To Count
In addition to collecting fecal coliform bacteria at Riddle Point and Reed Point, two
locations adjacent to the Chitwood neighborhood and three stream locations within 1)
Bear Creek, 2) the North Shore Marina tributary, and 3) Beanblossom Creek (Table 8).
All spring May samples exceeded the state standard of 200 colonies per 100 ml
threshold, which followed multiple rain events that likely saturated soils reducing
necessary infiltration for septic leach fields and livestock waste. The storm event
concentrations significantly exceeded state standards as well, with the sample from the
tributary that enters the lake east of the North Shore Marina too numerous to count.
Total suspended solids (TSS) were sampled at the three stream sites. While the
concentrations increased at Beanblossom and Bear Creek in July, the values are
significantly below the cautionary value of 80 mg/L, considered harmful to aquatic life
(Waters, 1995).
18Sampling Season Precipitation - 2013
1.6
Precipitation
1.4
Sample date (base)
Sample date (storm)
1.2
Precipitation (in)
1
0.8
0.6
0.4
0.2
0
Figure 13. Precipitation amounts during the 2013 sampling season.
Table 8. Fecal coliform bacteria summary for 2013 Lake Lemon samples. The state
standard for full body contact and recreation is 200 colonies per 100mls.
Fecal Coliform Bacteria (#/100mls) E. coli (#/100mls)
5/31/13
5/8/13 7/31/13 7/31/13
(storm event)
Riddle Point 250 -- 8 0
Reed Point 790 -- 0 0
Chitwood #1 1,584 -- 72 28
Chitwood #2 2,760 -- 56 8
Beanblossom Creek 50,800 53,096 64 0
Bear Creek 34,060 17,240 16 4
N. Shore Marina Creek 7,920 TNTC** 48 16
**TNTC = Too numerous To Count
193.4 Trophic State
3.4.1 Introduction
The most widely used standard for assessing the condition of a lake is by
considering its trophic state. The trophic state of a lake refers to its overall level of
nutrition or biological productivity. Trophic categories include: oligotrophic, mesotrophic,
eutrophic and hypereutrophic, with productivity increasing from oligotrophic to eutrophic
(Table 9).
Table 9. Some characteristics of the different trophic state index classifications. Note,
that while those salmonid fisheries, which have higher oxygen requirements, are lost in
more eutrophic lakes, there are still many fish species present.
Classification Transparency Nutrients Algae D.O. Fish
Oligotrophic clear Low few algae Hypo has D.O. can support
TP < 6 µg/L salmonids
(trout and
salmon)
Mesotrophic Less clear Moderate healthy Less D.O. in lack of
TP 10-30 µg/L populations of hypo salmonids
algae
Eutrophic transparency High abundant No D.O. in the Warm-water
35 µg/L algae and hypo during fisheries only.
weeds the summer Bass may
dominate.
Hypereutrophic transparency extremely high thick algal No D.O. in the Rough fish
80 µg/L scum hypo during dominate;
Dense weeds the summer summer fish
kills possible
The changes in a lake from oligotrophy to eutrophy (higher trophic state) is called
eutrophication. Eutrophication is defined as the excessive addition of inorganic nutrients,
organic matter and silt to lakes and reservoirs at rates sufficient to increase biological
production and to lead to a decrease in lake volume. By this definition, high phosphorus
alone does not make a lake eutrophic. The phosphorus levels must also cause an
increase or potential increase in plant production and/or sedimentation.
3.4.2 Trophic State Indices
The large amount of water quality data collected during lake water quality
assessments can be confusing to evaluate. Because of this, Indiana and many other
states use a trophic state index (TSI) to help evaluate water quality data. A TSI
condenses water quality data into a single, numerical index. Different index (or
eutrophy) points are assigned for various water quality concentrations. The index total,
or TSI, is the sum of individual eutrophy points for a lake.
20The most widely used and accepted TSI is one developed by Bob Carlson (1977)
called the Carlson TSI (Figure14). Carlson analyzed total phosphorus, chlorophyll-a,
and Secchi disk transparency data for numerous lakes and found statistically significant
relationships among the three parameters. He developed mathematical equations for
these relationships that form the basis for the Carlson TSI. Using this index, a TSI value
can be generated by one of three measurements: Secchi disk transparency, chlorophyll-
a or total phosphorus. Data for one parameter can also be used to predict a value for
another. The TSI values range from 0 to 100. Each major TSI division (10, 20, 30, etc.)
represents a doubling in algal biomass.
CARLSON'S TROPHIC STATE INDEX
Oligotrophic Mesotrophic Eutrophic Hypereutrophic
20 25 30 35 40 45 50 55 60 65 70 75 80
Trophic State
Index └────┴────┴────┴────┴────┴────┴────┴────┴────┴────┴────┴────┘
15 10 8 7 6 5 4 3 2 1.5 1 0.5 0.3
Transparency
(Meters) └─┴────┴──┴─┴─┴──┴───┴───┴─────┴───┴────┴───────┴──────┴────┘
0.5 1 2 3 4 5 7 10 15 20 30 40 60 80 100 150
Chlorophyll-a
(ug/L or PPB) └───┴─────┴─────┴────┴──┴─┴───┴───┴──┴──┴───┴──┴───┴──┴─┴───┘
Total 3 5 7 10 15 20 25 30 40 50 60 80 100 150
Phosphorus
(ug/L or PPB) └┴─────┴────┴────┴────┴───┴───┴──┴───┴──┴──┴───┴────┴────┴──┘
Figure 14. Carlson's trophic state index.
213.4.3 Trophic State Scores
Using Carlson’s TSI for the May, June, and July data, Lake Lemon varied slightly
by parameter and month but was mostly characterized by the eutrophic classification
(Table 10). The earlier April TSI scores start the growing season with eutrophic
conditions. Except the July chlorophyll and the May Secchi disk classifications, all the
TSI scores increased throughout the growing season, which is the historic trend for Lake
Lemon.
Table 10. Summary of Trophic State Index Scores Using Mean 2013 Water Quality Data
for Riddle/Reed Points.
Carlson’s Carlson’s Carlson’s
DATE Secchi Disk TSI Total Phosphorus TSI Chlorophyll TSI
May 57/60 54/59 37/42
Eutrophic Eutrophic Mesotrophic
61/65 56/51 55/56
June
Eutrophic Eutrophic Eutrophic
70/73 63/61 66/63
July Hypereutrophic Eutrophic Eutrophic
How to read:
Riddle Pt. TP = 0.051mg/L = 51ug/L Reed Pt. TP = 0.334mg/L = 334ug/L
Carlson’s TP TSI
Graph on Carlson’s TP scale Graph on Carlson’s TP scale
65 / 88
Carlson’s TSI value Eutrophic/Hypereutrophic Carlson’s TSI value
224.0 TROPHIC STATE TRENDS
Using Riddle Point Carlson TSI scores to look at the historic trend for Lake Lemon
shows that the lake is generally characterized as eutrophic conditions. Figures 14-16
illustrate the Carlson TSI historic trends for Secchi disk, total phosphorus, and
chlorophyll-a. Overall, a pattern is seen within the seasonal variation with the late spring
months scoring significantly lower (less eutrophic) while increasing during the late
summer months to a eutrophic/hypereutrophic status.
Carlson Secchi Disk TSI Historic Trend
90
80
70
60
Carlson TSI
Eutrophic
50
40
30
20
10
0
Figure 14. The 15-year historic trend for Carlson Secchi disk TSI scores. All but three late
summer (August) samples, shown in orange, scored above the mean for eutrophic status.
The green dashed line illustrates the 15-year mean. The purple dotted line illustrates
eutrophic status for the Carlson TSI.
23Carlson TP TSI Historic Trend
90
80
70
60
Carlson TSI
Eutrophic
50
40
30
20
10
0
Figure 15. The 15-year historic trend for Carlson total phosphorus TSI scores. All August
samples, shown in orange, score above the mean for eutrophic status. The green dashed
line illustrates the 15-year mean. The purple dotted line illustrates eutrophic status for the
Carlson TSI. The black line shows a decreasing trend for the last 5 years.
Carlson Chl-a TSI Historic Trend
90
80
70
Carlson TSI
60
Eutrophic
50
40
30
20
10
0
Figure 16. The 15-year historic trend for Carlson chlorophyll-a TSI scores. Most August
samples, shown in orange, score above the mean for eutrophic status. The 15-year mean
is just above the Carlson TSI eutrophic status score of 50 (purple dotted line).
245.0 WATER QUALITY TRENDS
Compiled Secchi disk transparency data from volunteer monitors and SPEA
monitoring studies over the past 20 years are shown in Figure 17. There is no apparent
long-term trend in transparency except that late July and August samples are generally
lower in transparency. All measures of record would be considered indicative of
eutrophic conditions.
Total phosphorus (TP) concentrations are quite variable over the past 20 years at
Lake Lemon’s Riddle Point sampling site (Figure 18). There is little visible long-term
trend. Most of the values were above the eutrophic threshold of 0.030 mg/L. The earlier
April and June 2012 samples were below this threshold, but exceed the concentration by
late July. The variable concentrations have tightened over the years with the average
just about 0.030 mg/L.
Epilimnetic total phosphorus concentrations at Riddle Point are mostly in the
eutrophic range but the resulting chlorophyll-a concentrations (Figure 19) do not always
reach the eutrophic range of greater than 7 µg/L; however, the majority of the August
chlorophyll-a samples over the 20 years do fall above the eutrophic classification. It is
typical that the chlorophyll-a concentrations would align with the TP concentrations;
however, Lake Lemon watershed inputs of suspended solids contribute and elevate the
TP concentrations, which also shade out the photic zone.
Secchi Disk Transparency Trend - Riddle Point
0.0
0.5
Transparency (m)
1.0
1.5
Eutrophic
2.0
2.5
Figure 17. Historic Secchi disk transparency data for Lake Lemon. All data are less than
the general eutrophic indicator of 2 meters (dotted line). Orange markers indicate August
or late July samples.
25Total Phosphorus Trend - Riddle Point
0.30
0.25
Concentration (mg/L)
0.20
0.15
0.10
Eutrophic
0.05
0.00
Figure 18. Historic epilimnetic total phosphorus trend for Lake Lemon. Most
concentrations are higher than 0.030 mg/L (dotted line), the level generally considered
high enough to support eutrophic conditions. Orange markers indicate August or late
July samples.
Chlorophyll a Trends - Riddle Point
60
55
50
45
Concentration (ug/L)
40
35
30
25
20
15
Eutrophic
10
5
0
Figure 19. Historic chlorophyll-a data for Lake Lemon. The dotted line illustrates
concentrations indicative of eutrophic conditions. Orange markers indicate
August or late July samples.
266.0 CONCLUSIONS
The water characteristics of Lake Lemon are highly variable due, in large part, to
runoff from the very large watershed that can replace the entire lake volume in a
relatively short time (Figure 20). This causes difficulties in monitoring because the water
conditions at any particular time depend on several immeasurable variables, including:
time since the last major storm and the intensity and duration of that storm. All base flow
samples fell within rain events so there was likely significant flushing of algal cells
(Figure 13). While these variables affect other Indiana lakes and reservoirs, they have a
much greater influence at Lake Lemon because of its very large watershed and short
residence time. The watershed drainage area to lake area ratio is very large at 31:1 for
Lake Lemon. While the flushing rate will need to be recalculated once the dredging work
is complete, previously Lake Lemon had a hydraulic flushing rate of 5/yr, meaning the
whole lake volume replaces itself 5 times per year. This makes this reservoir very
responsive to watershed inputs.
Lake Lemon suffers from seasonally high levels of phosphorus, and suspended
sediments and relatively low Secchi disk transparency throughout the year; however, the
overall trend for Lake Lemon has not changed in over 19 years (Figures 17-19). Current
water conditions unquestionably place the lake into the ‘eutrophic’ or over-productive
trophic category. Eutrophic lakes produce more algae and rooted plants than the
bacteria and microbes can decompose annually. As a result, decaying organic matter
accumulates on the sediments where it contributes to low dissolved oxygen levels and
decreased lake volume.
27Figure 20. Lake Lemon watershed.
The delivery of eroded watershed soils to the lake has created bars and shallow
water depths in the eastern end of the lake. In addition to posing navigation problems,
sediment accumulations provide more potential habitat for rooted aquatic plants. The
abundant shallow water and freshly deposited sediments in Lake Lemon provide ideal
conditions for the growth of rooted plants. These rooted aquatic plants then provide
additional hydraulic resistance encouraging sedimentation, which exacerbates the
siltation in the eastern end of the lake. While the overabundance of macrophytes has
decreased over the years by active harvesting and recent dredging, watershed
sedimentation continues to deliver excessive suspended solids.
Sedimentation and its consequences are likely the most pervasive and historic
problems of Lake Lemon. Since the LLCD has initiated a dredging program, controlling
the watershed sources of sediment delivery, are the most needed lake management
activities currently at the lake. While nutrient mitigation is not the primary objective of the
current sediment dredging, removing those nutrient rich lake sediments will impact the
nutrient release and resuspension, consequently reducing nutrients in the lake.
28However, since most lake sediments were dredged from the epiliminetic sediments, the
nutrient release is chemically limited but fully susceptible to boat wave action. It is well
documented that a 50 horse power recreational boat motor can resuspend silt sized lake
sediment particles in 10 feet of water. While there are a many idle speed areas within
the lake, a large portion of the lake area that is 10 feet deep and shallower permits high
speed motor boating (Figure 21). This certainly contributes to the high sediment
resuspension in addition to watershed inputs.
Figure 21. Lake Lemon 2004 Bathymetry. The red line follows the 10 foot depth contour.
While Lake Lemon continues to face watershed and lake challenges ranging from
eutrophic water conditions that usually peak towards the end of the summer season to
watershed land uses, there has been no significant change over the last 15 years. Key
eutrophy parameters (total phosphorus, chlorophyll-a, Secchi disk transparency) have
produced similar yearly results. Additional time is needed to discover if the multiple
benefits of dredging significantly contribute to nutrient reduction.
297.0 REFERENCES
APHA et al. 2005. Standard Methods for the Examination of Water and Wastewater,
21th edition. American Public Health Association, Washington, D.C.
Carlson, R.E. 1977. A trophic state index for lakes. Limnology and Oceanography,
22(2): 361-369.
Correll, David L. 1998. The role of phosphorus in the eutrophication of receiving
waters: a review. J. Environ. Qual., 27(2):261-266.
IDEM. 1976. Indiana Lake Classification System and Management Plan. Stream
Pollution Control Board, Indianapolis, Indiana.
IDEM. 1986. Indiana Lake Classification System and Management Plan. Department
of Environmental Management, Indianapolis, Indiana.
Jones, W.W. and seven others. 1997. Lake Monroe Diagnostic and Feasibility Study.
School of Public and Environmental Affairs, Indiana University, Bloomington, IN,
324pp.
Ohio EPA. 1999. Association between nutrients, habitat, and the aquatic biota in Ohio
rivers and streams. Ohio EPA Technical Bulletin MAS/1999-1-1, Columbus.
Prescott, G.W. 1982. Algae of the Western Great Lakes Area. Otto Koeltz Science
Publishers, West Germany.
St. Amand, Ann. 2010. Aquatic Microorganism Image Library (CD). PhycoTech, Inc., St.
Joseph, MI
U.S. Department of Commerce. 2009. National Oceanic and Atmospheric
Administration, National Weather Service.
Walker, R.D. 1978. Task force on Agricultural Nonpoint Sources of Pollution
Subcommittee on soil Erosion and Sedimentation. Illinois Institute for
Enbironmental Qaulity, 72pp.
Ward, H.B. and G.C. Whipple. 1959. Freshwater Biology, Second Edition. W.T.
Edmondson, editor. John Wiley & Sons, Inc., New York.
Wehr, J.D. and R.G. Sheath. 2003. Freshwater ALgae of North America, Ecology and
Classification. Academic Press, San Diego.
Whitford, L.A. and G.J. Schumacher. 1984. A Manual of Fresh-Water Algae.
Sparks Press, Raleigh, N.C.
30Yousef, Y.A. et. al. 1978. Mixing effects due to boating activities in shallow lakes. Draft
Report to OWRT, U.S. Dep. Inter. Tech. Rep. ESEI 78-10, Washington, D.C.
Zogorski, J.S., W.W. Jones and others. 1986. Lake Lemon Diagnostic/Feasibility
Study. ESAC-86-02. School of Public and Environmental Affairs, Indiana
University, Bloomington, Indiana.
31You can also read