Use of reflectance near-infrared spectroscopy to investigate the effects of daily moisturizer application on skin optical response and barrier ...
←
→
Page content transcription
If your browser does not render page correctly, please read the page content below
Use of reflectance near-infrared
                 spectroscopy to investigate the effects
                 of daily moisturizer application on
                 skin optical response and barrier
                 function

                 Meha Qassem
                 Panayiotis Kyriacou

Downloaded From: https://www.spiedigitallibrary.org/journals/Journal-of-Biomedical-Optics on 17 Jan 2021
Terms of Use: https://www.spiedigitallibrary.org/terms-of-use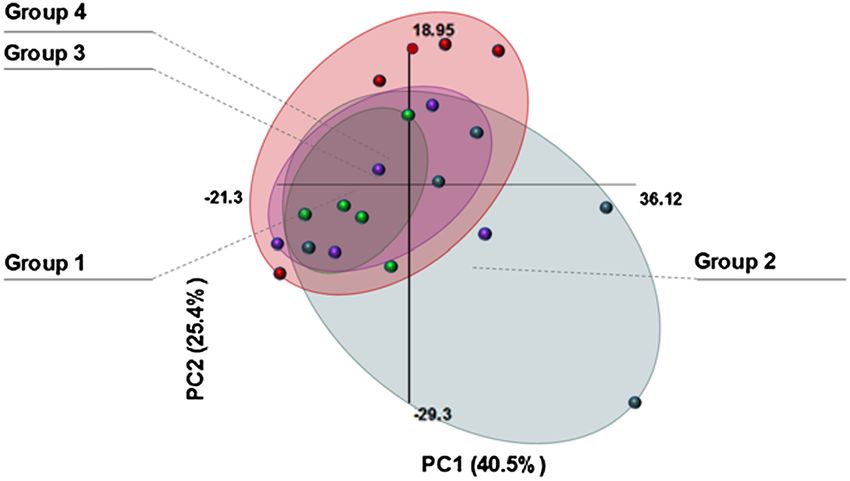
Journal of Biomedical Optics 19(8), 087007 (August 2014)

                Use of reflectance near-infrared spectroscopy
                to investigate the effects of daily moisturizer
                application on skin optical response and barrier
                function
                Meha Qassem* and Panayiotis Kyriacou
                City University London, Biomedical Engineering Research Group, Northampton Square, London, EC1V 0HB, United Kingdom

                              Abstract. A number of noninvasive techniques and instruments have emerged over the years allowing much
                              progress toward clarifying the structure and function of human skin and studying the effects of various applied
                              substances. All of this research has provided great insight into the interactions between skin and various prod-
                              ucts through quantitative and qualitative measurements. Such methods include near-infrared spectroscopy
                              (NIRS), a technique which has gained popularity over the years and has often been employed to accurately
                              determine the moisture levels and water content of skin based on its sensitivity to hydrogen bonding. NIRS
                              has also been applied in many studies to report the efficacy of moisturizing products and assess their benefits
                              to the skin. However, many of these studies have reported an increase in skin water content following moisturizer
                              application while some have challenged the benefits of long-term moisturizer use, particularly on normal skin,
                              and even suggested that it can increase the skin’s susceptibility to irritants. This paper reports the results of a
                              pilot in vivo study carried out on the skin of 20 healthy volunteers, categorized into groups depending on their skin
                              type and frequency of moisturizer use, in order to investigate the optical response of human skin after direct
                              short-term contact with water followed by application of a moisturizer. The measurements were obtained using a
                              highly advanced spectrophotometer in the region of 900 to 2100 nm equipped with a customized reflectance fiber
                              optic handheld probe. Scatter graphs of group results and second derivative spectra have shown an interesting
                              pattern between frequent users of moisturizers and individuals who do not use moisturizers, suggesting that
                              long-term daily moisturization may have an effect on skin barrier function. The results also raise some questions
                              regarding the optical characteristics of different skin types, as well as the varying response between different
                              water bands in the NIR region. Future work will focus on gaining more knowledge about these subjects and
                              obtaining results from a larger population, as well as performing statistical analysis through regression methods
                              in order to further improve optical skin measurements. © 2014 Society of Photo-Optical Instrumentation Engineers (SPIE) [DOI: 10
                              .1117/1.JBO.19.8.087007]

                              Keywords: near-infrared spectroscopy; water content; skin barrier function; moisturization.
                              Paper 130879RR received Dec. 10, 2013; revised manuscript received May 16, 2014; accepted for publication Jul. 28, 2014; pub-
                              lished online Aug. 28, 2014.

                1     Introduction                                                                 which are responsible for driving the SC’s exfoliating process
                The study of skin hydration and skin barrier function have long                    and regulating the epidermal barrier function. The level of SC
                been areas of great interest and extensive research in the fields of               hydration or water-retaining capacity is highly dependent upon
                cosmetics and dermatology due to their importance as biophysi-                     the structure and arrangement of the intercellular lipid matrix,
                cal parameters of skin health.1–3 In humans, skin features play a                  and on natural moisturization factors (NMFs) which comprise
                vital role in allowing humans to survive in a terrestrial environ-                 water-soluble substances. It is also dependent on the permeation
                ment by delicately regulating the amount of water loss from the                    path length through the SC. In turn, barrier function is influ-
                skin through its outer epidermal layer known as the Stratum                        enced by the water content of the skin which regulates hydro-
                Corneum (SC).1,3 The nature of this layer is complex, consisting                   lytic enzyme activities involved in SC maturation and
                of several layers of dead keratin-filled squamous cells called cor-                desquamation of corneocytes.
                                                                                                       In some cases, the skin barrier function becomes impaired
                neocytes, embedded in an intercellular lipid matrix, and acting
                                                                                                   causing irritation and dry skin, and hence requires the applica-
                together as an essentially selective permeable, heterogeneous,
                                                                                                   tion of moisturizers to treat the condition by locking water inside
                composite outer layer of the epidermis that controls the level
                                                                                                   the SC and creating an extra barrier that prevents oils from
                of transcutaneous water loss and provides protection against
                                                                                                   escaping and harmful elements from entering.6 Moisturizers
                desiccation and environmental challenges.1,4,5 Moreover, the
                                                                                                   are also commonly used for cosmetic purposes to improve
                water content of the SC layer allows it to maintain its flexibility
                                                                                                   the appearance and feel of skin. However, some studies have
                and facilitates the occurrence of certain enzymatic reactions
                                                                                                   suggested that long-term use of certain moisturizers or overhy-
                                                                                                   dration can compromise the integrity of the SC layer, weaken

                *Address all correspondence to: Meha Qassem, Email: meha.qassem.1@city
                 .ac.uk                                                                            0091-3286/2014/$25.00 © 2014 SPIE

                Journal of Biomedical Optics                                               087007-1                                          August 2014   •   Vol. 19(8)

Downloaded From: https://www.spiedigitallibrary.org/journals/Journal-of-Biomedical-Optics on 17 Jan 2021
Terms of Use: https://www.spiedigitallibrary.org/terms-of-use
Qassem and Kyriacou: Use of reflectance near-infrared spectroscopy to investigate the effects. . .

                skin barrier function, enhance susceptibility to irritants, and in-                2.1     Experimental Design
                fluence skin barrier recovery.7–10 Therefore, more knowledge
                about the effects of moisturizing agents on the skin and its                       The participants were categorized into four groups depending on
                barrier function is required.                                                      their skin type and frequency of moisturizer use: (Group 1) com-
                    Although water is an important and vital component of                          prised those who apply moisturizer daily on the test area and
                human skin, prolonged skin contact with extrinsic water can                        have normal skin; (Group 2) also included those with normal
                                                                                                   skin, but that do not use moisturizers on the test area;
                impair the skin barrier function, act as a potential strong irritant,
                                                                                                   (Group 3) consisted of individuals who moisturize daily or
                and can even lead to skin damage.11–13 Skin contact with extrin-
                                                                                                   on most days, but have dry skin (most with a history of
                sic water for extended periods of time can strip the skin of its
                                                                                                   eczema/dermatitis, asthma, or allergies); and last, (Group 4)
                natural oil and moisturizers and lead to a number of profound
                                                                                                   included individuals with random patterns of moisturizer appli-
                effects such as SC swelling, increasing SC suppleness, weaken-
                                                                                                   cation and varying skin types. Each group consisted of five par-
                ing SC corneocyte cohesion, and increasing the permeability of
                                                                                                   ticipants and was a mixture of skin colors, classified in the
                all substances that penetrate the skin.14,15
                                                                                                   questionnaire using categories that reflect the Fitzpatrick skin
                    This paper reports the initial findings of a pilot in vivo experi-
                                                                                                   color scale.
                ment conducted on a small number of volunteers where the opti-
                                                                                                       For skin moisture measurements, it is common to carry out
                cal properties of skin were assessed after direct short-term
                                                                                                   tests on the lower leg area as many studies have done in the
                contact with extrinsic water, and then after application of a mois-
                                                                                                   past.17,18,27–30 In this case, readings were obtained by placing
                turizer. The measurements were recorded using a highly                             a customized reflectance probe slightly above the ankle on
                advanced spectrophotometer equipped with a customized                              the internal lower left leg of each volunteer, then taking three
                fiber optic handheld probe to obtain near-infrared (NIR) reflec-                   spectrophotometric scans for each measurement for averaging
                tance spectra of skin.                                                             purposes. Spectra were recorded from participants at three
                    This particular technique was employed here due to its                         different intervals. Three averaged spectra were obtained
                ability to directly and accurately detect water inside the                         from each volunteer and used for further analysis. The first
                skin using the intensities of overtone and combination                             set of recorded spectra, which were later averaged into a single
                bands of OH and HOH water bonds occurring in the NIR                               spectrum for each volunteer, was considered as the control
                region, which are good indicators of the level of skin hydra-                      measurement, where the skin of the individual was at its natural
                tion and water content.16–19 NIR spectra can also provide                          state (without undergoing a wash-out period or application of
                additional insight regarding other skin constituents including                     tape stripping, moisturizer, or wet patch). Once this first reading
                lipids and proteins, can differentiate between different types                     was obtained, a wet patch previously immersed in water was
                of water in the skin,17,18 and monitor changes in skin water                       immediately placed on the same site and left on the skin for
                mobility.2 Furthermore, this technique has the added advan-                        10 min. Then the patch was removed and the skin surface
                tage of great flexibility, allowing both in vitro and in vivo                      was gently tapped with a paper towel to remove any residual
                assessments to be carried out since its instrumentation can                        water before immediately replacing the probe on the same
                easily be equipped with fiber optic probes.                                        site to obtain the second set of measurements. After taking this
                    Unfortunately, a reliable instrument based on NIR spectros-                    measurement, the skin was left for an extra minute to dry in
                copy (NIRS) designed specifically for skin hydration measure-                      order to ensure that it was no longer wet from the patch.
                ments is not yet available, although a few recent studies have                     Participants were asked to take a roughly quarter-sized amount
                looked at various ways to improve or miniaturize this tech-                        of a commercial moisturizing agent with their finger and rub this
                nique.20–23 Results from this experiment will be used in conjunc-                  on the test site without leaving any residue. After 30 min, a third
                tion with our previous work24–26 to aid the future design and                      set of spectral scans were recorded. All participants used the
                development of a portable NIR spectroscopic device that                            same moisturizer whose list of ingredients stated on the pack-
                would allow accurate, fast, and noninvasive in vivo measure-                       aging were as follows: Aqua, Cyclopentasiloxane, Sorbitol,
                ments of skin hydration and water content.                                         Caprylic/Capric Triglyceride, Stearic Acid, Helianthus Annuus
                                                                                                   Hybrid Oil, Isohexadecane, Glycol Stearate, Dimethicone,
                                                                                                   Collagen Amino Acids, Isomerized Linoleic Acid, Lactic Acid,
                2     Materials and Methods                                                        Potassium Lactate, Sodium PCA, Urea, Serica Powder,
                Twenty healthy volunteers (5 male, 15 women; age range: 17–                        Hydrolyzed Silk, Dimethiconol, Stearamide AMP, Glyceryl
                53 years old; mean age: 26.1 years; SD: 8.0387) were                               Stearate, Cetyl Alcohol, Polysorbate 80, Sorbitan Oleate,
                recruited and asked to complete a skin health questionnaire                        Triethanolamine, Carbomer, Xanthan Gum, Sodium Acrylate/
                prior to performing any measurements. The study was                                Sodium Acryloyldimethyl Taurate Copolymer, Parfum, Benzoic
                approved by City University London Senate Research Ethics                          Acid, Imidazolidinyl Urea, Methylparaben, Phenoxyethanol,
                Committee, and all participants gave written informed consent                      Propylparaben, Sodium Benzoate, Alpha-Isomethyl Ionone,
                before any personal details were collected. Volunteers with                        Benzyl Alcohol, Citronellol, Coumarin, Hydroxyisohexyl-3-
                obvious skin pathology, deep suntan, or any other condition                        Cyclohexene Carboxaldehyde, Limonene, Linalool, and CI 77891.
                with the exception of dry legs, were excluded. For female par-
                ticipants, some had shaved, waxed, or used laser hair removal
                                                                                                   2.2     Instrumentation
                in the past, but this had been carried out at least a day before
                taking part in the study. As for male participants, hair inter-                    NIR skin spectra were collected using the Lambda 1050 dual
                ference was easily avoided as most did not have hair on the                        beam UV/Vis/NIR spectrophotometer (PerkinElmer Corp,
                selected sight near the ankle and the experiment did not con-                      Waltham, Massachusetts) at increments of 2 nm in the spectral
                sider or examine the differences in skin roughness between                         region of 900 to 2100 nm, with an InGaAs detector operating
                male and female participants.                                                      throughout the entire region. Light was provided by a tungsten

                Journal of Biomedical Optics                                               087007-2                                          August 2014   •   Vol. 19(8)

Downloaded From: https://www.spiedigitallibrary.org/journals/Journal-of-Biomedical-Optics on 17 Jan 2021
Terms of Use: https://www.spiedigitallibrary.org/terms-of-use
Qassem and Kyriacou: Use of reflectance near-infrared spectroscopy to investigate the effects. . .
lamp and a gain setting of three on the InGaAs detector was also order to perform pretreatment processes such as averaging
added to measure the energy in the single-mode beam and give and smoothing as well as standard normal variate (SNV) scatter
better quality spectra. The scanning period for each interval was corrections. For qualitative analysis of data, principal compo-
set at 0.2 s; this value seemed to give a reasonable balance nent analysis (PCA) was performed with Multibase 2014
between sensitivity and scan time. Therefore, each scan lasted Excel plugin (Numerical Dynamics).
2 min, and three cycles were performed so that each averaged
spectrum was taken over a period of 6 min for each test. 3 Results
Attenuator settings were kept constant at 1% for the refer- Skin reflectance spectra obtained with the fiber optic probe were
ence beam to improve the noise levels at high absorbance transformed into absorbance using the equation Log 1∕R, prior
and were maintained at 100% attenuation for the sample to undergoing smoothing, averaging, and scatter correction
beam. Slit size controls for the InGaAs detector, which allows using the SNV method. Smoothing was applied using the
one to adjust the amount of light entering, was set on “servo block average method with a window of 50 data points in
mode” so that the system could oversee the reference beam order to maximize the noise reduction. For the three set of spec-
energy and select the slit size accordingly. tral measurements taken from each participant (control, after
Initial baseline corrections were performed to eliminate the application of a wet patch, and then 30 min after treatment
irrelevant bands and background noise which especially evident with a moisturizer), the average was calculated again for
in highly absorbing media such as skin. These corrections were each set to give the mean of the mean of all data. This graph
carried out at 100% T/0A baseline to correct the maximum sam- is shown in Fig. 2. All the spectra in this graph clearly display
ple and reference beams, and at 0% T/blocked beam to regulate the dominant OH stretching overtone and combination bands of
the beams at 0% for the sample and 100% for the reference. water at 1450 nm and between 1910 and 1920 nm, as well as a
In order to acquire reflectance measurements, it was neces- shoulder around 2000 nm indicative of bound water, and a
sary to replace the sample holder compartment with a universal weaker band at 1760 to 1780 nm arising from alkyl CH groups
reflectance accessory that permitted the attachment of a fiber in skin lipids and protein. However, other bands belonging to
optic probe (Ocean optics, Duiven, The Netherlands). This NH groups are less visible and seemed to have merged with
probe consists of a bundle of seven optical fibers in a stainless those belonging to water.
steel ferrule with six of them arranged around one light detecting Comparing the three resulting spectra averaged from all par-
fiber and acting as illumination fibers. Depending on the con- ticipants, the overtone band around 1450 nm is greater for the
nection of the probe to the spectrophotometer, it was possible to first measurement (control), recorded before the application of
use the single fiber as the source of radiation and the other six the wet patch or moisturizer, which indicates higher water con-
fibers as detectors. The fiber core diameter was 600 μm, tent. However, at the combination band of OH and HOH bend-
allowing a fairly reasonable area of skin to be sampled. ing in the region of 1900 to 1920 nm, all three spectra are nearly
It was essential to introduce a small gap between the probe equal, although the average spectrum obtained after applying the
and the test site to prevent the blockage of light leaving and wet patch was slightly dominant in this particular region.
entering the probe, since occlusion can lead to a build up of It appears that spectra showing a smaller intensity at the
water and increase hydration, thereby falsely raising skin water absorption bands had more prominent features at peaks
water content measurements. Therefore, the reflectance probe belonging to NH and CH groups in correlation to spectra
was modified by enclosing its tip with a Perspex tube layer where water absorption was dominant, but the baseline of the
that was longer than the end of the probe by 1.5 mm. This coat- spectra was not significantly different among the three recorded
ing ensured that the desired separation distance was maintained measurements.
throughout all tests. In addition, this particular coating was over- Before looking into the results from the wet patch and mois-
turizer tests, PCA was performed for the control measurement
laid with another white coating to eliminate interference from
which was taken from volunteers at their normal state. The
ambient light while scanning. Figure 1 shows this probe placed
analysis was performed using the second derivative spectra
on a volunteer with the separation distance indicated.
with the four groups of participants as the different variables.
All spectra obtained were transferred from the standard
PerkinElmer UV Winlab software (Perkin ElmerCorp,
2
Massachusetts, USA) to the UVWinlab Data Processor and
Viewer software (Perkin ElmerCorp, Massachusetts, USA) in 1.5
1
0.5
0
−0.5
−1
−1.5
900 1000 1100 1200 1300 1400 1500 1600 1700 1800 1900
Wavelength (nm)
Control Water Cream
Fig. 1 Image showing the reflectance fiber optic probe used indicat- Fig. 2 Mean of the mean absorption graph of all volunteers before,
ing the separation distance introduced and as applied on a participant. and after application of a wet patch followed by a moisturizer.
Journal of Biomedical Optics 087007-3 August 2014 • Vol. 19(8)
Downloaded From: https://www.spiedigitallibrary.org/journals/Journal-of-Biomedical-Optics on 17 Jan 2021
Terms of Use: https://www.spiedigitallibrary.org/terms-of-useQassem and Kyriacou: Use of reflectance near-infrared spectroscopy to investigate the effects. . .
Derivative spectra were calculated on the UVWinlab software and no moisturizing routines. In order to focus the analysis on
using the Savitzky–Golay method. PCA was performed to reduce the water-related bands, only spectral values between 1300 to
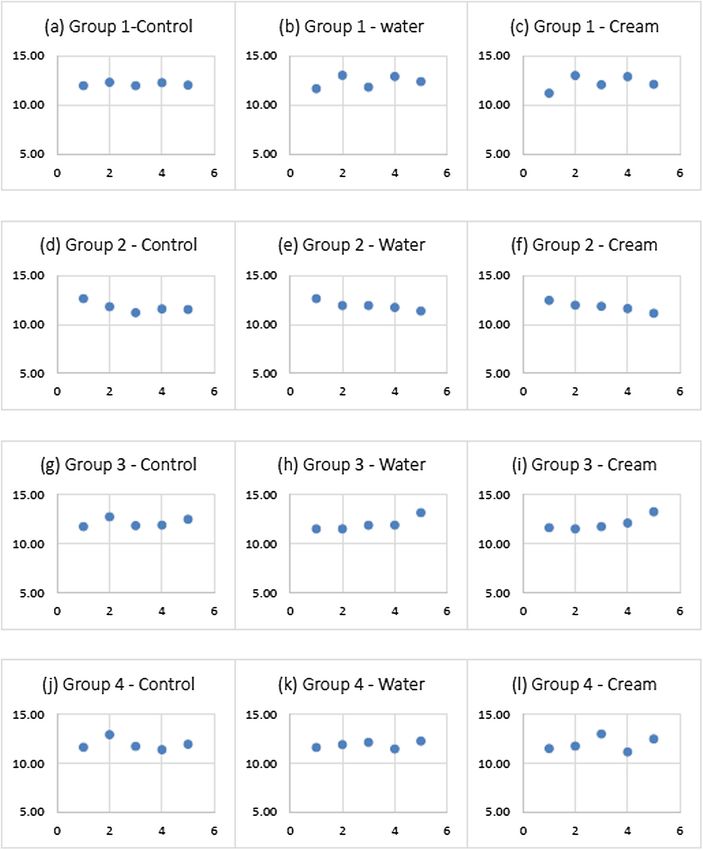
the complexity of the dataset and to determine whether a pattern 1600 and 1750 to 2050 nm were included. The resulting scatter
existed among individuals with consistent, nonconsistent, plot of the samples’ scores is shown in Fig. 3. The minimum of
the 1450 nm band contributed mostly to the loadings of the first
principal component (PC1), whereas the minimum of the
1900 nm water band dominated that of the second principal com-
ponent (PC2). Overall, these two principal components accounted
for 40% and 25% of the total variation, respectively. The scores’
plot in Fig. 3 clearly distinguishes among groups with different
moisturizing patterns, with those from Group 1 showing the least
variation. Moreover, the plot shows a marked increase in separa-
tion as the frequency of moisturizer applications decreases,
regardless of skin type.
Then, peak values at the 1900-nm water band were analyzed
using the post-treated absorption spectra from all participants.
This particular band was chosen because previous studies2,31
have reported that the 1900-nm water band is a more suitable
indicator of the state of water molecules in the SC than the
Fig. 3 Scores plot of PCA analysis performed on the control mea- 1450 nm band, which is often influenced by adjacent protein
surements of individuals with varied moisturizing patterns. bands. Therefore, peak values from the band near 1900 nm
Fig. 4 Scatter graphs of group peak values at 1900 nm for each test performed.
Journal of Biomedical Optics 087007-4 August 2014 • Vol. 19(8)
Downloaded From: https://www.spiedigitallibrary.org/journals/Journal-of-Biomedical-Optics on 17 Jan 2021
Terms of Use: https://www.spiedigitallibrary.org/terms-of-useQassem and Kyriacou: Use of reflectance near-infrared spectroscopy to investigate the effects. . .
were plotted on a scatter graph (Fig. 4) for each group and each minimum at 1463 nm, which corresponds to the overtone
test performed (control, water, and cream). In accordance with water absorption band at 1450 nm, was highest for the control
PCA results, the control measurement for Group 1, which con- measurement, indicating increased water contents. The peak
sisted of individuals with normal skin and who moisturized intensity of a local minimum at 1901 nm, related to the water
daily, showed the least variation between individuals compared absorption at 1900 nm, was highest in the spectrum recorded
to the results from other tests and groups. However, this was after treatment with cream. However, the 1450 nm band is influ-
different for the other two tests performed, although both graphs enced by two bands around 1400 and 1500 nm resulting from
[Figs. 4(b) and 4(c)] yielded similar patterns. This same pattern the combination of CH-stretching and CH-bonding modes
consistency in the water and cream tests was also evident for and the first overtone of the NH2 -stretching mode, making it
individuals in Group 3, but there was a difference in their initial less suitable for accurate water determination. Peak height
control measurement. Overall, the results of individuals with differences at this minimum were also smaller than those at
normal skin and that do not moisturize (Group 2), varied the 1463 nm.
least between all tests conducted and generally yielded a similar The same derivative calculations were then repeated, this
pattern when observed on scatter graphs. Results from Group 4 time separating the resulting spectra of Groups 1–3 at each set-
individuals were random, with no obvious trend detected, how- ting to investigate their individual response. These results are
ever, this was expected since this group consisted of individuals shown in Figs. 6–8. Again, the intensity of the local minimum
with different skin types and moisturizing routines. For this rea- at 1463 and 1901 nm did not reflect each other, probably
son, further analysis from this point was restricted to Groups 1– because of the influence of proteins at 1450 nm and differences
3 to allow the investigations of groups that could be easily cat- in measurement depths. It can be noted that these bands almost
egorized in terms of skin type and moisturizing routine. have an opposing behavior. Second derivative spectra from
In addition, it is known that NIRS is capable of providing Group 2 consistently showed the highest intensities for local
more in-depth recordings of skin because its light can penetrate minima at 1463 nm in comparison to Groups 1 and 3, and
deeper into the skin. It has been reported32 to travel an average the lowest intensity peaks for local minimum at 1901 nm.
path length of 1.5 to 2.8 mm in the region between 1400 and On the other hand, the derivative spectra of Group 1 are nearly
1900 nm, reaching the topmost part of the dermis. However, the opposite of this, mostly having smaller intensities at
the beam path length in media is highly influenced by wave-
length since optical properties such as scattering and absorption
coefficients and anisotropy parameters are the functions of 3
wavelength. Previous studies33 have concluded that the water 2
bands at 1450 and 1900 nm visible in skin spectra have different
d ²(Log 1/R)/d² (a.u)
1
absorption coefficients, and, therefore, have a different measure-
ment depth. The water band around 1900 nm was shown to have 0
a higher absorption coefficient, resulting in a shorter measure- −1
ment in comparison to the band near 1450 nm since photons lose −2
their energy more rapidly in the spectra range of strong water
−3
absorption. To investigate this point, the second derivative of
spectra shown in Fig. 2 was used again instead of the absorption −4
curves to minimize the errors from baseline fluctuations that −5
occur in absorbance measurements as a result of changes in opti- 900 1000 1100 1200 1300 1400 1500 1600 1700 1800 1900 2000
cal parameters, such as the scattering coefficient. These are Wavelength (nm)
shown in Fig. 5. Looking at this figure, there was no apparent Group 1 Group 2 Group 3
shift in water absorption bands or any other bands from the
three recordings and for each after contact with water or after Fig. 6 Second derivative spectra at control setting (taken before
applying wet patch or moisturizer) for Groups 1–3.
moisturizer application. However, the peak intensity of local
3 4
2 3
d ²(Log 1/R)/d?² (a.u)
2
1
d²(Log 1/R)/d ² (a.u)
1
0 0
−1 −1
−2 −2
−3
−3
−4
−4 −5
900 1000 1100 1200 1300 1400 1500 1600 1700 1800 1900 2000 −6
Wavelength (nm) 900 1000 1100 1200 1300 1400 1500 1600 1700 1800 1900 2000
Wavelength (nm)
Control Water Cream
Group 1 Group 2 Group 3
Fig. 5 Second derivative spectra of mean of the mean absorption
graph (Fig. 2) of all volunteers before, and after application of a Fig. 7 Second derivative spectra after applying a wet patch for
wet patch followed by moisturizer use. 10 min. Response for Groups 1–3.
Journal of Biomedical Optics 087007-5 August 2014 • Vol. 19(8)
Downloaded From: https://www.spiedigitallibrary.org/journals/Journal-of-Biomedical-Optics on 17 Jan 2021
Terms of Use: https://www.spiedigitallibrary.org/terms-of-useQassem and Kyriacou: Use of reflectance near-infrared spectroscopy to investigate the effects. . .
4 4
3 3
2 2
d²(Log 1/R)/d ² (a.u)
d²(Log 1/R)/d² (a.u)
1 1
0 0
−1 −1
−2 −2
−3 −3
−4 −4
−5 −5
−6 −6
900 1000 1100 1200 1300 1400 1500 1600 1700 1800 1900 2000 1800 1820 1840 1860 1880 1900 1920 1940 1960 1980 2000
Wavelength (nm) Wavelength (nm)
Group 1 Group 2 Group 3 Control Water Cream
Fig. 8 Second derivative spectra after treatment with a cream. Fig. 9 Second derivative spectra of Group 1 for the three measure-
Response for Groups 1–3. ments recorded.
1463 nm and the largest at 1901 nm, except at the control setting 3
where the intensity peak at 1901 nm for Group 3 very slightly
2
exceeded that of Group 1 although they are nearly identical.
d ²(Log 1/R)/d² (a.u)
Overall, spectra obtained after application of a moisturizer 1
showed the least amount of variation between groups, although
0
showing the same pattern as explained above. Therefore, since
previous studies34 have shown that the light beam would have −1
traveled deeper into the skin at the shorter wavelength, i.e.,
around 1463 nm, it can be assumed that individuals from −2
Group 1 who normally moisturize their skin on a daily basis −3
had a higher concentration of water at the more superficial
parts of the skin, whereas for participants in Group 2, the oppo- −4
1800 1820 1840 1860 1880 1900 1920 1940 1960 1980 2000
site would be true and water was able to travel deeper into the
Wavelength (nm)
skin. As previously reported in the literature,2,18,35 NIR skin
spectra can also be used to investigate changes in skin water Control Water Cream
mobility by monitoring a possible peak shift at around
1900 nm, which is dependent on the skin condition and envi- Fig. 10 Second derivative spectra of Group 2 for the three measure-
ronment. It was also reported2,35 that an increase in the skin ments recorded.
water content causes an increase in water mobility marked
by a peak shift toward shorter wavelengths at the 1900 nm
water band. Therefore, the procedure outlined by Egawa2 4
was applied here to analyze the water mobility in the SC for 3
Groups 1–3, and to examine the differences between each 2
d ²(Log 1/R)/d² (a.u)
group. In this case, the second derivative spectra from each 1
group were analyzed separately for the three tests performed
0
and are shown in Figs. 9–11. As illustrated by these spectra,
Group 1 expressed no changes in water mobility between the −1
control reading and those taken after moisturizer application, −2
but a small peak shift toward a longer wavelength (1909 nm −3
to 1911 nm) did occur after the water test. As for Group 2,
−4
minor peak shifts towards longer wavelengths were observed
−5
at the 1900 nm band in spectra recorded after the wet patch 1800 1820 1840 1860 1880 1900 1920 1940 1960 1980 2000
test and after moisturizer application. This indicates a slight Wavelength (nm)
decrease in water mobility. In contrast, moisturizer use failed Control Water Cream
to cause a peak shift in individuals belonging to Group 3; how-
ever, a small shift from 1908 to 1906 nm did occur as a result of Fig. 11 Second derivative spectra of Group 3 for the three measure-
the water test, this time indicating a slight increase in water ments recorded.
mobility.
Finally, PCA was performed again, this time on the mean
second derivative spectra from Groups 1–3, and for all three of sample scores. Here, the first and second principal compo-
tests (control, water, and cream). Again, only spectral values nents, PC1 and PC2, accounted for 59% and 19% of the overall
measured between 1300 to 1600 and 1750 to 2050 nm were deviation, respectively, and have clearly separated the three
entered into the analysis to narrow the model to the water-related groups regardless of the tests performed. However, the closest
regions of skin spectra. Figure 12 shows the resulting scatter plot relationship remains between the control measurements of
Journal of Biomedical Optics 087007-6 August 2014 • Vol. 19(8)
Downloaded From: https://www.spiedigitallibrary.org/journals/Journal-of-Biomedical-Optics on 17 Jan 2021
Terms of Use: https://www.spiedigitallibrary.org/terms-of-useQassem and Kyriacou: Use of reflectance near-infrared spectroscopy to investigate the effects. . .
In conclusion, it seems many questions remain regarding the
optical properties of different skin types and the influence of fre-
quent moisturizer use, as well as the relationship between differ-
ent water absorption bands in the NIR in relation to moisturizer
use. Future work will focus on acquiring data from more subjects
and employing statistical regression methods for more in-depth
analysis of these results in order to improve optical and spectro-
scopic skin measurements, and hopefully support the design and
development of a portable and/or miniaturized optical device that
could provide reliable, accurate, and fast skin hydration readings
in vivo to eliminate the use of current bench-top instruments with
the same performance standards used today.
Fig. 12 Scores plot of PCA analysis performed on the averaged sec-
ond derivative spectra from Groups 1 to 3 for all tests carried out on References
volunteers.
1. A. V. Rawlings and C. R. Harding, “Moisturization and skin barrier
function,” Dermatol. Ther. 17(Suppl 1), 43–48 (2004).
Groups 1 and 3, thus highlighting the obvious influence of daily 2. M. Egawa, “In vivo simultaneous measurement of urea and water in the
human stratum corneum by diffuse-reflectance near-infrared spectros-
or frequent use of moisturizers.
copy,” Skin Res. Technol. 15(2), 195–199 (2009).
3. S. Verdier-Sévrain and F. Bonté, “Skin hydration: a review on its
molecular mechanisms,” J. Cosmet Dermatol. 6(2), 75–82 (2007).
4 Discussions and Conclusions 4. M. Lodén and H. I. Maibach, Treatment of Dry Skin Syndrome: The Art
A state-of-the-art spectrophotometer equipped with a custom- and Science of Moisturizers, Springer, Heidelberg, Germany (2012).
5. L. D. Rhein, Surfactants in Personal Care Products and Decorative
ized fiber optic reflectance probe was employed to perform Cosmetics, CRC Press, Boca Raton, Florida (2007).
an in vivo experiment investigating the effects of short-term 6. C. W. Lynde, “Moisturizers: what they are and how they work,” Skin
direct water contact with skin and application of a common Therapy Lett. 6(1), 3–5 (2001).
moisturizer on a small group of participants divided into catego- 7. I. Buraczewska et al., “Changes in skin barrier function following long-
ries depending on their type of skin and frequency of typical term treatment with moisturizers, a randomized controlled trial,” Br. J.
moisturizer use. Looking at the mean spectra of all participants Dermatol. 156(3), 492–498 (2007).
8. M. Lodén, “Barrier recovery and influence of irritant stimuli in skin
for the three tests, it was evident that the resulting spectrum from treated with a moisturizing cream,” Contact Dermatitis 36(5), 256–
recordings taken prior to contact with water or treatment with a 260 (1997).
moisturizing agent showed higher peak values around the OH 9. E. Held, S. Sveinsdóttir, and T. Agner, “Effect of long-term use of mois-
overtone band of water near 1450 nm, which is probably turizer on skin hydration, barrier function and susceptibility to irritants,”
expected since the majority of volunteers were frequent users Acta Derm. Venereol. 79(1), 49–51 (1999).
10. E. Held and T. Agner, “Effect of moisturizers on skin susceptibility to
of moisturizers. However, this was not the same for the OH com-
irritants,” Acta Derm. Venereol. 81(2), 104–107 (2001).
bination band of water around 1900 nm, where peak values from 11. T. F. Tsaif and H. I. Maibach, “How irritant is water? An overview,”
all tests were quite similar in that region. Contact Dermatitis 41(6), 311–314 (1999).
Second derivative spectra have shown an interesting pattern 12. C. D. Lynggaard, D. B. Knudsen, and G. B. E. Jemec, “Stratum cor-
between frequent users of moisturizers and individuals who do neum damage and ex vivo porcine skin water absorption; a pilot
not moisturize. Participants who do not use moisturizers consis- study,” Skin Pharmacol. Physiol. 22(6), 295–298 (2009).
13. D. Voegeli, “The effect of washing and drying practices on skin barrier
tently had the lowest intensity at 1901 nm, but the highest at
function,” J. Wound Ostomy Cont. Nurs. 35(1), 84–90 (2008).
1463 nm, and since previous studies34 have shown that meas- 14. R. R. Warner et al., “Water disrupts stratum corneum lipid lamellae:
urement depths of NIR light largely depend on water absorption damage is similar to surfactants,” J. Invest. Dermatol. 113(6), 960–
and that higher water absorption leads to shorter light path 966 (1999).
lengths, the beam would have traveled deeper into the skin at 15. R. R. Warner, K. J. Stone, and Y. L. Boissy, “Hydration disrupts human
the shorter wavelength. Based on this, it may be possible to sug- stratum corneum ultrastructure,” J. Invest. Dermatol. 120(2), 275–284
(2003).
gest that individuals who moisturized daily (Group 1) had a
16. A. V. Rawlings and J. J. Leyden, Eds., Skin Moisturization, 2nd ed.,
higher concentration of water at the more superficial parts of Informa Healthcare, New York (2009).
the skin, whereas for the other group (Group 2), the opposite 17. P. L. Walling and J. M. Dabney, “Moisture in skin by near-infrared
would be true and water was able to travel deeper into the reflectance spectroscopy,” J. Soc. Cosmet. Chem. 40(3), 151–171
skin. However, results from a larger population are required (1989).
to give further insight into this hypothesis. 18. K. A. Martin, “Direct measurement of moisture in skin by NIR spec-
troscopy,” J. Soc. Cosmet. Chem. 44(5), 249–249 (1993).
PCA results were able to yield valuable clusters of the data.
19. I. Bodén et al., “Characterization of healthy skin using near infrared
The first of those (Fig. 3) showed that randomization and sep- spectroscopy and skin impedance,” Med. Biol. Eng. Comput. 46(10),
aration between individuals increased with decreased moistur- 985–995 (2008).
izer application with little consideration for skin type. A 20. Y. A. Woo et al., “Development of a method for the determination of
second PCA (Fig. 12) scores plot, made up of the averaged sec- human skin moisture using a portable near-infrared system,” Anal.
ond derivative spectra of Groups 1–3 performed including all Chem. 73(20), 4964–4971 (2001).
21. A. F. Omar and M. Z. MatJafri, Optical Fiber Near Infrared
tests that were carried out, was reasonably able to distinguish
Spectroscopy for Skin Moisture Measurement, INTECH Open
among the three groups, but showed moisturization patterns Access Publisher, Rijeka, Croatia (2012).
to be an apparent influential factor since the control measure- 22. M. Mohamad, A. R. Msabbri, and M. Z. MatJafri, “Conceptual design
ment from Groups 1 and 3 had the closest overall relationship. of near infrared spectroscopy instrumentation for skin moisture
Journal of Biomedical Optics 087007-7 August 2014 • Vol. 19(8)
Downloaded From: https://www.spiedigitallibrary.org/journals/Journal-of-Biomedical-Optics on 17 Jan 2021
Terms of Use: https://www.spiedigitallibrary.org/terms-of-useQassem and Kyriacou: Use of reflectance near-infrared spectroscopy to investigate the effects. . .
measurement,” in Proc. 2011 IEEE Colloq. on Humanities Science 32. H. Arimoto and M. Egawa, “Skin moisture measurement based on near-
Engineering, pp. 801–804 (2011). infrared spectroscopy and regression analysis,” in Proc. 25th Annual
23. M. Egawa et al., “Determining water content in human nails with a port- Int. Conf. IEEE on Eng. Med. Biol. Soc. 2003, Cancun, Mexico,
able near-infrared spectrometer,” Appl. Spectrosc. 57(4), 473–478 Vol. 4, pp. 3438–3441, IEEE (2003).
(2003). 33. H. Arimoto, M. Egawa, and Y. Yamada, “Depth profile of diffuse reflec-
24. M. Qassem and P. A. Kyriacou, “In-vitro spectrophotometric near infra- tance near-infrared spectroscopy for measurement of water content in
red measurements of skin absorption and dehydration,” in Conf. Proc. skin,” Skin Res. Technol. 11(1), 27–35 (2005).
IEEE Eng. Med. Biol. Soc. 2012, pp. 6044–6047 (2012). 34. H. Arimoto and M. Egawa, “Non-contact skin moisture measurement
25. M. Qassem and P. A. Kyriacou, “Comparing the rates of absorption and based on near-infrared spectroscopy,” Appl. Spectrosc. 58(12), 1439–
weight loss during a desorption test using near infrared spectroscopy,” 1446 (2004).
Skin Res. Technol. 19(2), 137–144 (2013). 35. M. Egawa et al., “Regional difference of water content in human skin
26. M. Qassem and P. A. Kyriacou, “In vivo optical investigation of short studied by diffuse-reflectance near-infrared spectroscopy: consideration
term skin water contact and moisturizer application using NIR spectros- of measurement depth,” Appl. Spectrosc. 60(1), 24–28 (2006).
copy,” in Conf. Proc. IEEE Eng. Med. Biol. Soc. 2013, pp. 2392–2395
(2013). Meha Qassem is a doctoral student and research assistant in the
27. F. A. Simion, E. S. Abrutyn, and Z. D. Draelos, “Ability of moisturizers Biomedical Engineering Research Centre at City University
to reduce dry skin and irritation and to prevent their return,” J. Cosmet London. Her main research interests are in the area of spectropho-
Sci. 56(6), 427–444 (2005). tometric and spectroscopic analysis, and in the development and
28. C. Rosado, P. Pinto, and L. M. Rodrigues, “Assessment of moisturizers application of instrumentation and sensors for diagnostic or therapeu-
and barrier function restoration using dynamic methods,” Skin Res. tic purposes.
Technol. 15(1), 77–83 (2009).
29. M. Lodén, “Role of topical emollients and moisturizers in the treatment Panayiotis Kyriacou is a professor of Biomedical Engineering, asso-
of dry skin barrier disorders,” Am. J. Clin. Dermatol. 4(11), 771–788 ciate dean for Research and Enterprise at City University London and
(2003). Director of the Biomedical Engineering Research Centre. His main
30. J. M. Crowther et al., “Measuring the effects of topical moisturizers on research activities are primarily focused upon the understanding,
changes in stratum corneum thickness, water gradients and hydration in development and applications of instrumentation, sensors and
vivo,” Br. J. Dermatol. 159(3), 567–577 (2008). physiological measurement to facilitate the prognosis, diagnosis
31. J. W. Wiechers et al., “NIR for the study of human skin,” in 11th Int. and treatment of disease or the rehabilitation of patients.
Conf. Near Infrared Spectroscopy, pp. 959–964, NIR Publications,
Chichester (2004).
Journal of Biomedical Optics 087007-8 August 2014 • Vol. 19(8)
Downloaded From: https://www.spiedigitallibrary.org/journals/Journal-of-Biomedical-Optics on 17 Jan 2021
Terms of Use: https://www.spiedigitallibrary.org/terms-of-useYou can also read