Implication of metabolic and dopamine transporter PET in dementia with Lewy bodies
←
→
Page content transcription
If your browser does not render page correctly, please read the page content below
www.nature.com/scientificreports
OPEN Implication of metabolic
and dopamine transporter PET
in dementia with Lewy bodies
Sung Woo Kang1,7, Seun Jeon1,2,7, Young‑gun Lee1, Mincheol Park1, Kyoungwon Baik1,
Jin Ho Jung1, Seok Jong Chung3, Han Soo Yoo1, Seong Ho Jeong5, Mijin Yun4, Phil Hyu Lee1,
Young H. Sohn1, Alan C. Evans6 & Byoung Seok Ye1*
To evaluate the implication of 18F-fluorodeoxyglucose (FDG)- and dopamine transporter (DAT)-
positron emission tomography (PET) in the diagnosis and clinical symptoms of dementia with Lewy
bodies (DLB), 55 DLB patients and 49 controls underwent neuropsychological evaluation and FDG-,
DAT-, and 18F-Florbetaben (FBB) PET. DAT- and FDG-uptake and FDG/DAT ratio were measured in the
anterior and posterior striatum. The first principal component (PC1) of FDG subject residual profiles
was identified for each subject. Receiver operating characteristic curve analyses for the diagnosis of
DLB were performed using FDG- and DAT-PET biomarkers as predictors, and general linear models for
motor severity and cognitive scores were performed adding FBB standardized uptake value ratio as a
predictor. Increased metabolism in the bilateral putamen, vermis, and somato-motor cortices, which
characterized PC1, was observed in the DLB group, compared to the control group. A combination of
posterior putamen FDG/DAT ratio and PC1 showed the highest diagnostic accuracy (91.8% sensitivity
and 96.4% specificity), which was significantly greater than that obtained by DAT uptake alone.
Striatal DAT uptake and PC1 independently contributed to motor severity and language, memory,
frontal/executive, and general cognitive dysfunction in DLB patients, while only PC1 contributed to
attention and visuospatial dysfunction.
Dementia with Lewy bodies (DLB) is the second most common cause of dementia. However, the diagnostic
sensitivity for DLB in clinical practice is suboptimal due to the absence of direct biomarkers for α-synuclein,
and the high co-incidence rate or clinical overlap with other dementia-causing conditions such as Alzheimer’s
disease (AD)1. Although reduced dopamine transporter (DAT) uptake on DAT positron emission tomography
(PET) is a useful imaging biomarker for the differential diagnosis of DLB from AD2, the sensitivity of DAT
imaging is relatively lower than its specificity. Furthermore, its diagnostic performance has not been evaluated
in the distinction between DLB and healthy aging.
Metabolic changes seen on 18F-fluorodeoxyglucose (FDG) PET have been reported in patients with DLB,
ypometabolism3, relative sparing of the posterior cingulate cortex4, and hypermetabolism
including occipital h
involving the basal ganglia, somato-motor cortex, and c erebellum5. Among these, the hypermetabolic pattern
LB6. In the
has been reported to have a negative correlation with striatal dopamine deficiency in patients with D
present study, we evaluated the implications of FDG- and DAT-PET in the diagnosis of DLB and their correla-
tion with the clinical symptoms among patients with probable DLB7. We hypothesized that the combination of
DAT- and FDG-PET imaging has advantages over DAT-PET alone in differentiating patients with DLB from the
controls, and in the explanation for the clinical symptoms of DLB.
1
Department of Neurology, Yonsei University College of Medicine, 50‑1 Yonsei‑ro, Seodaemun‑gu, Seoul 03722,
South Korea. 2Brain Research Institute, Yonsei University College of Medicine, Seoul, Korea. 3Department of
Neurology, Yongin Severance Hospital, Yonsei University Health System, Yongin, Korea. 4Department of Nuclear
Medicine, Yonsei University College of Medicine, Seoul, Korea. 5Department of Neurology, Inje University Sanggye
Paik Hospital, Seoul, Korea. 6McGill Centre for Integrative Neuroscience, Montreal Neurological Institute, McGill
University, Montreal, Canada. 7These authors contributed equally: Sung Woo Kang and Seun Jeon. *email:
romel79@gmail.com
Scientific Reports | (2021) 11:14394 | https://doi.org/10.1038/s41598-021-93442-y 1
Vol.:(0123456789)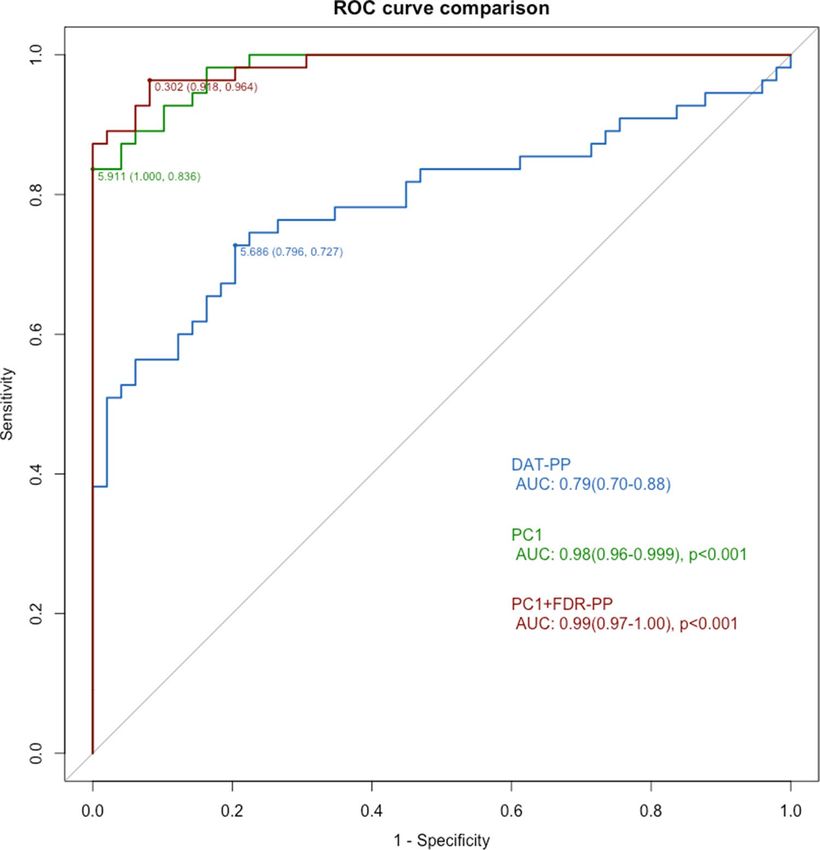
www.nature.com/scientificreports/
Methods
Participants. The study participants comprised 63 patients clinically diagnosed with cognitive impairment
due to DLB, as reported in our previous s tudy8, and 49 cognitively healthy controls. Subjects underwent neu-
rological examination, neuropsychological tests, Mini-Mental State Examination (MMSE), 3 Tesla magnetic
resonance imaging (MRI), FDG-PET, DAT-PET, and 18F-Florbetaben (FBB) PET scans at the dementia and
movement clinics of Yonsei University Severance Hospital, Seoul, Korea from November 2015 to March 2019.
Ten control subjects did not undergo FBB-PET. Clinical features of DLB, including parkinsonism, rapid eye
movement sleep behavior disorder (RBD), visual hallucinations, and cognitive fluctuation, were evaluated based
on structured questionnaires administered by caregivers. The severity of parkinsonism was assessed according
to the Movement Disorder Society’s Unified Parkinson’s Disease Rating Scale (UPDRS) motor score. The clinical
diagnosis of DLB was based on the 2017 revised criteria for probable D LB7 and striatal DAT depletion visually
8
assessed by a nuclear medicine expert . Specifically, all subjects with DLB had at least more than two core fea-
tures of DLB, except for one who had preceding dementia and one core feature of parkinsonism with an indica-
tive biomarker of reduced DAT in the basal ganglia seen in the PET scan. As a result, all subjects with DLB meet
the 2017 criteria for probable DLB. According to the 2005 c riteria9, our DLB subjects consisted of 62 probable
DLB and one possible DLB. Medication status was investigated and categorized into seven groups: antidepres-
sants, benzodiazepines, cholinesterase inhibitors, antipsychotics, anticholinergic agents or dopamine agonists,
and N-methyl-D-aspartate (NMDA) receptor antagonists.
Exclusion criteria were (1) pure vascular cognitive impairment; (2) other degenerative diseases including fron-
totemporal dementia, corticobasal degeneration, and progressive supranuclear palsy; (3) drug-induced cognitive
impairment; and (4) other causes sufficiently explaining cognitive impairment, including epilepsy, psychiatric
disorder, and structural brain lesion (e.g., tumor or hemorrhage).
Ethics approval and consent to participate. All procedures performed in human studies were in
accordance with the ethical standards of the institutional and/or national research committee and with the 1964
Helsinki Declaration and its later amendments or comparable ethical standards. This study was approved by the
Institutional Review Board of Yonsei University College of Medicine. Informed consent was obtained from all
participants.
Neuropsychological tests. All participants underwent the Seoul Neuropsychological Screening Battery10.
Standardized z scores based on age- and education-matched norms were available for attention, language, visu-
ospatial function, memory, and frontal/executive function. MMSE and Clinical Dementia Rating-Sum of Boxes
(CDR-SOB) were measured to assess global cognition.
Acquisition of MR images. All MRI scans were acquired using a Philips 3T scanner (Philips Intera; Philips
Medical System, Best, The Netherlands) using a previously described protocol11.
T1‑weighted image processing. We used the FMRIB Software Library (FSL, http://www.fmrib.ox.ac.uk/
fsl) for image processing. Each subject’s T1-weighted images were corrected for intensity inhomogeneity, skull-
stripped, and registered to the Montreal Neurological Institute (MNI) template. The tissues in the registered
images were classified into white matter, gray matter (GM), or cerebrospinal fluid (CSF) based on the hidden-
Markov random field model and the associated expectation–maximization algorithm12. GM probability map
obtained from this algorithm was non-linearly transformed into the MNI template. The striatal regions were
segmented using the FMRIB’s integrated registration and segmentation tool (FIRST) algorithm, then subdivided
into the anterior and posterior regions using the k-means clustering algorithm based on the voxel coordinates
(Supplementary Figure 1)13. The striatal regions of interest (ROIs) were included in the GM class. Then, we gen-
erated a study-specific GM mask by averaging all the individual GM probability maps and binarizing the average
map (> 30% GM probability), and then assigned each voxel into either background or foreground.
Measurement of regional white matter hyperintensities (WMH). A visual rating scale of WMH
was modified from the Fazekas scale14. Periventricular WMH (PWMH) and deep WMH (DWMH) areas were
classified according to a previously described protocol15.
Acquisition, processing, and interpretation of FDG‑, DAT‑, and FBB‑PET scans. FDG-PET,
DAT-PET, and FBB-PET acquisition were performed using Discovery 600 (General Electric Healthcare, Mil-
waukee, MI, USA). Detailed methods for PET acquisitions have been described in a previous study5,11. All par-
ticipants in this study underwent FDG-PET and DAT-PET. All patients with DLB and 39 out of 49 control
subjects underwent FBB-PET scans.
We linearly registered FDG-PET, DAT-PET, and FBB-PET images to individual T1-weighted MRI using rigid
body transformation. We performed partial volume correction within GM and white matter regions using a pre-
viously described method16. To generate standardized uptake value ratio (SUVR) maps for each PET modality,
we used the pons, occipital cortex, and cerebellar cortex as reference regions for FDG-, DAT-, and FBB-PET in
accordance with previous r eports17–20. Then, we spatially normalized the SUVR maps to the MNI template and
smoothed them using 5-mm full width at a half-maximum Gaussian kernel.
Additionally, we extracted global SUVR values from the FBB-PET as a cortical volume-weighted average of
the following cortical ROIs: frontal, anterior/posterior cingulate, lateral parietal, and lateral temporal cortices.
We excluded the occipital ROI in FBB-PET data analysis, as there is low β-amyloid load in AD-related changes21.
Scientific Reports | (2021) 11:14394 | https://doi.org/10.1038/s41598-021-93442-y 2
Vol:.(1234567890)www.nature.com/scientificreports/
We classified participants as β-amyloid positive or negative by applying 1.478 as global FBB-SUVR cutoff value22.
Twenty-six of the 63 DLB patients had significant β-amyloid deposition, while four out of 39 control subjects
had significant β-amyloid deposition. We identified normal cerebral metabolism in all normal control subjects.
As 10–40% of cognitively normal older adults have significant amyloid deposition23, we did not exclude the four
control subjects in our analyses to increase the generalizability of our results.
FDG/DAT ratio was calculated as representing the voxel-wise proportion of FDG and DAT uptake. Median
SUVR uptakes on bilateral striatal subregions were extracted, including the bilateral anterior caudate (AC), pos-
terior caudate (PC), anterior putamen (AP), and posterior putamen (PP). We eroded one voxel in each striatal
ROIs during the extraction to minimize the partial volume effect.
We applied the scaled sub-profile model (SSM) and principal component analysis (PCA) to all subject’s
three-dimensional FDG data to define a one-dimensional measure of disease progression and severity with
an associated regional covariance pattern, as described in the literature24. Briefly, FDG SUVR maps within the
study-specific GM mask were reshaped into a voxel by subject matrix. We transformed each data into logarithmic
form and centered the data matrix by subtracting each subject mean and group mean voxel profile, resulting in
a residual image, termed as the subject residual profile (SRP)24. We then applied PCA, and the reduced singular
value decomposition was utilized to factorize FDG-SRP. The first principal component (PC1) was calculated for
each subject and computed into the logistic regression analyses. The first component of PCA was displayed on
the MNI template for visualization (Supplementary Figure 2).
To assess the difference between left and right hemispheric metabolism, we calculated the asymmetry index
(AI) based on FDG-PET using the following formula:
Asymmetry index = 200 ∗ (MLH − MRH )/ (MLH + MRH ),
where MLH and MRH represent left and right hemispheric metabolism, respectively. To assess the degree of dif-
ferences in left and right hemispheric metabolism, absolute AI was also calculated:
Absolute AI = 200 ∗ |(MLH − MRH )/ ( MLH + MRH )|.
Quality assurance for image processing. All MRI images and processing results were visually inspected
by three researchers (SW Kang, S Jeon, and BS Ye) who were blinded to subject information for quality assur-
ance. We excluded eight patients due to MRI motion artifacts and image processing errors in brain masking and
tissue classification. Finally, 49 control subjects and 55 patients with DLB were included in the study.
Statistical analysis. Statistical analyses for demographic and clinical data were performed using the IBM
Statistical Package for the Social Sciences version 23.0 (SPSS Inc., Chicago, IL, USA). Independent t-tests and
chi-square tests were performed to compare clinical features across the disease and control groups (Table 1).
For AI and absolute AI, one-sample t-tests were performed to compare them with zero. Six imaging biomarkers
quantitatively obtained from FDG-PET and DAT-PET were used as predictors in receiver operating character-
istic (ROC) curve analyses and general linear models (GLMs), including DAT uptake in the PP (DAT-PP), AP
(DAT-AP), PC (DAT-PC), and AC (DAT-AC); FDG/DAT ratio in the PP (FDR-PP); and PC1. Among bilateral
DAT uptake values, lower values, rather than an average, were selected to avoid missing unilaterally abnor-
mal DAT uptake. To avoid multi-collinearity problems, variables that had a correlation coefficient (rho) greater
than 0.7 or a variance interference factor (VIF) greater than 2.5 were not simultaneously included as predictors
(Table 2). Specifically, DAT-PP was highly correlated with DAT-AP, DAT-PC, DAT-AC, and FDR-PP; DAT-AP
was with DAT-PC, DAT-AC, and FDR-PP; DAT-PC was with DAT-AC; and DAT-AC was with FDR-PP in over-
all subjects. In DLB patients, DAT-PP was highly correlated with DAT-AP, DAT-AC, and FDR-PP; DAT-AP was
with DAT-PC, DAT-AC, and FDR-PP; and DAT-PC was with DAT-AC.
ROC analyses were performed to find the accuracy, sensitivity, and specificity to distinguish DLB and control
groups using an individual predictor or the combination of predictors. The optimal cutoff point on the ROC
curve was determined using the Youden i ndex25. The algorithm suggested by DeLong et al.26 was used to compare
the area under the curves (AUCs) of individual models with the reference model that used the DAT-PP as a
predictor. As FBB-SUVR was not available for 10 control subjects, we did not include FBB-SUVR as a predictor
for the main ROC curve analyses. However, sensitivity analyses further including FBB-SUVR were performed
(Supplementary Table 1) in which we excluded 10 control subjects with missing data from FBB-SUVR.
GLMs were used to find the effects of the predictors on UPDRS motor score, MMSE score, and standard-
ized neuropsychological z score in DLB patients after controlling for age, sex, education, hypertension (HTN),
diabetes mellitus (DM), DWMH, and PWMH. Controls were not included in these analyses, and FBB-SUVR
was further included as a predictor. Predictors with a P value less than 0.05 on univariate analysis were then
included in multivariate regression analysis. The fitness of GLMs were compared using Akaike information
criterion (AIC), and the model emphasized in bold in Tables 4 and 5 had minimizing AIC. GLMs for the PC1
were performed to find the association of DAT uptake values, FDR-PP, and FBB-SUVR with the PC1. Model 1
GLMs were controlled for age, sex, education, HTN, DM, DWMH, and PWMH; Model 2 GLMs were further
controlled for the UPDRS motor score from Model 1; and Model 3 GLMs were further controlled for the MMSE
score from Model 1. GLMs were also performed to investigate the effects of imaging biomarkers on asymmetry
indices using the same covariates.
Given the raised attention to RBD in the diagnosis of DLB, we divided our DLB patients into 23 DLB without
RBD (DLBRBD−) and 32 DLB with RBD (DLBRBD+) to identify correlations of imaging biomarkers or neuropsy-
chological test z scores with RBD. GLMs for standardized neuropsychological z scores and imaging biomarkers
Scientific Reports | (2021) 11:14394 | https://doi.org/10.1038/s41598-021-93442-y 3
Vol.:(0123456789)www.nature.com/scientificreports/
Control (n = 49) DLB (n = 55) P value
Age, year 62.4 (7.9) 74.8 (7.1) < 0.001
Female, n (%) 26 (53.1) 23 (41.8) 0.342
Education, year 14.5 (3.9) 9.9 (5.3) < 0.001
Vascular risk factors, n (%)
HTN 12 (24.5) 27 (49.1) 0.017
DM 4 (8.2) 18 (32.7) 0.005
Dyslipidemia 13 (26.5) 20 (36.4) 0.387
DWMH, n (%) 0.037
Mild 40 (81.6) 34 (61.8)
Moderate 9 (18.4) 19 (34.5)
Severe 0 2 (3.6)
PWMH, n (%) < 0.001
Mild 40 (81.6) 21 (38.2)
Moderate 9 (16.3) 24 (43.6)
Severe 1 (2.0) 10 (18.2)
DLB features, n (%) NA
PARK + FLC + VH + RBD 0 10 (18.2)
PARK + FLC + VH 0 5 (9.1)
PARK + FLC + RBD 0 11 (20)
PARK + VH + RBD 0 2 (3.6)
FLC + VH + RBD 0 3 (5.5)
PARK + FLC 0 15 (27.3)
PARK + VH 0 1 (1.8)
PARK + RBD 0 3 (5.5)
FLC + VH 0 1 (1.8)
FLC + RBD 0 3 (5.5)
PARK 0 1 (1.8)
UPDRS motor score 0.8 (2.9) 24.6 (13.6) < 0.001
CDR-SOB 0.1 (0.2) 5.2 (3.9) < 0.001
K-MMSE 29.2 (1.0) 20.9 (5.5) < 0.001
FBB-SUVR 1.3 (0.2) 1.6 (0.4) < 0.001
FBB-positivity, n (%) 4 (10.3) 26 (47.3) < 0.001
Asymmetry index − 1.2 (1.2) − 1.6 (5.9) 0.656
Absolute asymmetry index 1.4 (1.0) 4.2 (4.3) < 0.001
Antidepressants, n (%) NA 15 (27.3) NA
Benzodiazepines, n (%) NA 13 (23.6) NA
Cholinesterase inhibitors, n (%) NA 24 (43.6) NA
Antipsychotics, n (%) NA 7 (12.7) NA
Anticholinergic agents or dopamine agonists, n (%) NA 10 (18.2) NA
NMDA receptor antagonists, n (%) NA 4 (7.3) NA
Table 1. Demographic and clinical characteristics of study participants. Data are expressed in mean (SD) or
number (%). Group comparisons were performed using independent t tests or Chi-square tests. CDR-SOB
clinical dementia rating sum of boxes, DLB dementia with Lewy bodies, DM diabetes mellitus, DWMH deep
white matter hyperintensities, FBB-SUVR 18F-Florbetaben standardized uptake value ratio, FLC fluctuation,
HTN hypertension, K-MMSE Korean version of the Mini-Mental State Examination, NA not applicable,
NMDA N-methyl-d-aspartate, PARK parkinsonism, PWMH periventricular WMH, RBD rapid eye movement
sleep behavior disorder, UPDRS unified Parkinson’s disease rating scale, VH visual hallucination.
were used to compare the degree of cognitive dysfunctions and availabilities of imaging biomarkers across two
groups after controlling for age, sex, and education.
We used the SurfStat toolbox (http://www.math.mcgill.ca/keith/surfstat/) developed in the MNI to perform
voxel-wise statistical analyses. We compared FDG, FDG-SRP, DAT, and FDR between DLB and control groups
using GLMs. We included age, sex, education, HTN, DM, DWMH, and PWMH as covariates. We evaluated the
associations between voxel-wise FDG-SRP and DAT uptake values in the striatal ROIs (DAT-AP, DAT-PP, DAT-
AC, DAT-PC, and FDR-PP) using GLMs after controlling for the same covariates. We used the false discovery rate
method to correct for multiple comparisons across multiple voxels (corrected p < 0.05). We displayed voxel-wise
statistical outcomes on MNI stereotaxic space in neurological convention.
Scientific Reports | (2021) 11:14394 | https://doi.org/10.1038/s41598-021-93442-y 4
Vol:.(1234567890)www.nature.com/scientificreports/
DAT-AP DAT-PC DAT-AC PC1 FDR-PP FBB-SUVR
Overall subjects
DAT-PP
Rho (p value) 0.93 (< 0.001) 0.76 (< 0.001) 0.83 (< 0.001) − 0.52 (< 0.001) − 0.85 (< 0.001) − 0.14 (0.174)
VIF 7.18 2.40 3.24 1.37 3.51 1.02
DAT-AP
Rho (p value) 0.80 (< 0.001) 0.92 (< 0.001) − 0.54 (< 0.001) − 0.80 (< 0.001) − 0.14 (0.180)
VIF 2.78 6.28 1.41 2.77 1.02
DAT-PC
Rho (p value) 0.94 (< 0.001) − 0.65 (< 0.001) − 0.62 (< 0.001) − 0.18 (0.082)
VIF 8.49 1.75 1.63 1.03
DAT-AC
Rho (p value) − 0.67 (< 0.001) − 0.71 (< 0.001) − 0.21 (0.045)
VIF 1.82 1.99 1.04
PC1
Rho (p value) 0.51 (< 0.001) 0.44 (< 0.001)
VIF 1.35 1.24
FDR-PP
Rho (p value) 0.16 (0.135)
VIF 1.02
DLB patients
DAT-PP
Rho (p value) 0.90 (< 0.001) 0.61 (< 0.001) 0.72 (< 0.001) − 0.28 (0.042) − 0.86 (< 0.001) 0.10 (0.477)
VIF 5.18 1.58 2.10 1.08 3.83 1.01
DAT-AP
Rho (p value) 0.72 (< 0.001) 0.89 (< 0.001) − 0.43 (0.001) − 0.80 (< 0.001) 0.07 (0.601)
VIF 2.08 4.89 1.22 2.82 1.01
DAT-PC
Rho (p value) 0.91 (< 0.001) − 0.40 (0.003) − 0.50 (< 0.001) 0.11 (0.424)
VIF 5.82 1.19 1.33 1.01
DAT-AC
Rho (p value) − 0.51 (< 0.001) − 0.63 (< 0.001) 0.06 (0.656)
VIF 1.34 1.65 1.00
PC1
Rho (p value) 0.20 (0.150) 0.18 (0.199)
VIF 1.04 1.04
FDR-PP
Rho (p value) − 0.09 (0.510)
VIF 1.01
Table 2. Correlation between imaging biomarkers in overall subjects and DLB patients. Rho and p values
are results of Pearson’s correlation analyses. DAT dopamine transporter, DAT-AP DAT uptake in the anterior
putamen, DAT-AC DAT uptake in the anterior caudate, DAT-PC DAT uptake in the posterior caudate, DAT-PP
DAT uptake in the posterior putamen, FBB-SUVR 18F-Florbetaben standardized uptake value ratio, FDG
18
F-fluorodeoxyglucose uptake, FDR-PP FDG to DAT ratio in the posterior putamen, PC1 the first principal
component of FDG subject residual profile, VIF variance inflation factor.
Results
Demographics and clinical characteristics. The demographic and clinical characteristics of study par-
ticipants are presented in Table 1. The DLB group was significantly older and less educated than the control
group, and had a significantly higher prevalence of HTN and DM than the control group. There were no signifi-
cant differences in terms of sex and dyslipidemia between groups. The DLB group had more severe DWMH and
PWMH than the control group. Among fifty-five patients with DLB, 10 had four core features; 21 did three core
features; 23 did two core features; and 1 did only parkinsonism. The DLB group had significantly higher mean
UPDRS motor and CDR-SOB scores, and a lower mean MMSE score than the control group. The DLB group
had a higher mean FBB-SUVR than the control group. At the time of study, there were 15 DLB patients taking
antidepressants; 13 taking benzodiazepines; 24 taking cholinesterase inhibitors; seven taking antipsychotics;
10 taking anticholinergic agents or dopamine agonists; and four taking NMDA receptor antagonists. Control
subjects were not taking any medications.
Scientific Reports | (2021) 11:14394 | https://doi.org/10.1038/s41598-021-93442-y 5
Vol.:(0123456789)www.nature.com/scientificreports/
Predictor AUC (95% CI) Threshold Specificity (%) Sensitivity (%) P value
DAT-AP 0.75 (0.66–0.85) 0.60 87.8 56.4 0.092
DAT-PP 0.79 (0.79–0.88) 0.52 79.6 72.7 Reference
FDR-PP 0.82 (0.74–0.91) 0.59 89.8 69.1 0.225
DAT-AC 0.83 (0.75–0.91) 0.65 91.8 69.1 0.241
DAT-PC 0.85 (0.77–0.92) 0.71 93.9 65.5 0.119
DAT-PC + FDR-PP 0.88 (0.81–0.94) 0.54 85.7 81.8 < 0.001
PC1 0.98 (0.96–0.999) 0.83 100 83.6 < 0.001
DAT-PP + PC1 0.98 (0.96–0.999) 0.81 98.0 85.5 < 0.001
DAT-AP + PC1 0.98 (0.96–0.999) 0.83 100 83.6 < 0.001
DAT-PC + PC1 0.98 (0.96–0.999) 0.22 87.8 96.4 < 0.001
DAT-AC + PC1 0.98 (0.96–0.999) 0.78 95.9 87.3 < 0.001
FDR-PP + PC1 0.99 (0.97–1.00) 0.30 91.8 96.4 < 0.001
Table 3. ROC curve analyses for the diagnosis of DLB. Results correspond to ROC curve analyses for the
diagnosis of DLB. P values are the results of analyses based on DeLong’s method comparing each model’s
accuracy with that of the model using DAT-PP as a predictor. AUCarea under the curve, DAT dopamine
transporter, DAT-AC DAT uptake in the anterior caudate, DAT-AP DAT uptake in the anterior putamen,
DAT-PC DAT uptake in the posterior caudate, DAT-PP DAT uptake in the posterior putamen, DLB dementia
with Lewy bodies, FDG 18F-fluorodeoxyglucose uptake, FDR-PP FDG to DAT ratio in the posterior putamen,
PC1 the first principal component of FDG subject residual profile, ROC receiver operating characteristic.
ROC curve analyses. Table 3 shows the diagnostic accuracy of individual ROC curves ordered from low-
est to highest. The ROC curve using PC1 and FDR-PP as predictors had the highest AUC (0.99, CI 0.97–1.00)
(Fig. 1). The ROC curve using PC1 as a predictor and the ROC curves using the combination of PC1 with DAT-
AC, DAT-PC, DAT-AP, DAT-PP, or FDR-PP as predictors had significantly higher AUCs than the reference
model using DAT-PP as a sole predictor. The ROC curve using the combination of FDR-PP with DAT-PC as pre-
dictors also had significantly higher AUC than the reference model. However, models using DAT-AP, FDR-PP,
DAT-AC, or DAT-PC as a predictor had AUCs comparable to the reference model. Sensitivity analyses further
including FBB-SUVR as a predictor showed results that were very similar to the original results after excluding
10 control subjects who did not undergo FBB-PET (Supplementary Table 1).
Association for imaging biomarkers with UPDRS motor scores and MMSE scores in DLB
patients. Table 4 shows the associations for imaging biomarkers with UPDRS motor score and MMSE score
in DLB patients. All predictors except for FBB-SUVR were significantly associated with UPDRS motor score,
while DAT-PC, DAT-AC, and PC1 were significantly associated with MMSE scores in univariate models. In
univariate models, DAT-AP and PC1 showed the lowest AIC values for UPDRS motor scores and MMSE scores,
respectively (emphasized in bold). Multivariate regression models showed that DAT-PP, DAT-AP, DAT-PC,
DAT-AC, and FDR-PP were significantly associated with UPDRS motor scores after controlling for PC1. Mean-
while, PC1 was not associated with UPDRS motor scores after controlling for DAT-AP, DAT-AC, or DAT-PC.
After controlling for DAT-PP or FDR-PP, PC1 was associated with UPDRS motor scores. Multivariate regression
models for MMSE score showed that PC1 and DAT-PC were independently associated with MMSE score, while
DAT-AC was not, after controlling for PC1. Among multivariate models for UPDRS motor and MMSE scores,
the model using DAT-AP and PC1 as predictors had the lowest AIC value for UPDRS motor score, while the
model using DAT-PC and PC1 as predictors had the lowest AIC value for MMSE score.
Association for imaging biomarkers with PC1 in DLB patients. DAT-AP, DAT-AC, and DAT-PC
were significantly associated with PC1 in DLB patients (Supplementary Table 2). After controlling for UPDRS
motor score or MMSE score, DAT-AP and DAT-PC were no longer associated with PC1, whereas the association
for PC1 with DAT-AC did not change.
Associations for imaging biomarkers with neuropsychological test scores in DLB
patients. Table 5 shows the associations for imaging biomarkers with standardized neuropsychological
test z scores in DLB patients. Univariate models showed that DAT-PP, DAT-AP, DAT-PC, DAT-AC, and PC1
were associated with language, memory, and frontal/executive function scores, while FDR-PP and FBB-SUVR
were not significantly associated with any cognitive scores. DAT-PC, DAT-AC, and PC1 were associated with
attention function score, while only PC1 was associated with visuospatial function score in univariate models.
Among univariate models, the models using PC1 as a predictor had the lowest AIC values (emphasized in bold)
for attention, visuospatial, memory, and frontal/executive function scores, while the model using DAT-AC did
so for language function score. Multivariate models showed that PC1 and all DAT biomarkers (including DAT-
PP, DAT-AP, DAT-PC, and DAT-AC) were independently associated with language, memory, and frontal/execu-
tive function scores, except the effect of DAT-AP was not significant after controlling for PC1 in memory and
frontal/executive function scores. PC1 was significantly associated with attention function score after controlling
for DAT-PC; however, the effect of DAT-PC was not significant after controlling for PC1. The effects of DAT-AC
Scientific Reports | (2021) 11:14394 | https://doi.org/10.1038/s41598-021-93442-y 6
Vol:.(1234567890)www.nature.com/scientificreports/
Figure 1. Comparison of ROC curves. DAT-PP (blue line), PC1 (green line), and PC1 + FDR-PP (red line). The
numbers under each line show threshold, specificity, and sensitivity. P values are the result of the comparison
of each model’s AUC with that of the model using DAT-PP as a predictor based on DeLong’s method. AUC
area under the ROC curve, DAT dopamine transporter, DAT-PP DAT uptake in the posterior putamen,
FDG 18F-Fluorodeoxyglucose, FDR-PP FDG to DAT ratio in the posterior putamen, PC1 the first principal
component of FDG subject residual profile, ROC receiver operating characteristic.
and PC1 on attention function score were not significant when they were simultaneously included as predictors.
Among multivariate models for attention, memory, and frontal/executive function scores, the models using PC1
and DAT-PC as predictors had the lowest AIC values. Among multivariate models for language function score,
the model using DAT-AC and PC1 as predictors had the lowest AIC value.
Comparisons of imaging biomarkers and neuropsychological test scores between the patients
with RBD (DLBRBD+) and those without RBD (DLBRBD−). There were no significant differences in
the availabilities of imaging biomarkers between DLBRBD+ and DLBRBD− groups after controlling for age, sex,
and education (Supplementary Table 3). However, the DLBRBD+ group exhibited better performance than the
DLBRBD− group in language, memory, and frontal/executive function scores. There were no significant differ-
ences in attention and visuospatial function scores.
AI and absolute AI. Both DLB and control groups had AI values significantly lower than zero (P for the
DLB group = 0.044 and P for the control group < 0.001) and absolute AI values higher than zero (P for the DLB
group < 0.001 and P for the control group < 0.001) on one sample t tests. The DLB and control groups had compa-
rable AI values, while the DLB group had significantly higher absolute AI value than the control group (Table 1).
GLMs for AI performed in the DLB group showed that no imaging biomarkers were associated with AI after
controlling for covariates, while DAT-AC and PC1 were significantly associated with absolute AI (Supplementary
Table 4). When the two predictors were simultaneously included, only PC1 had a significant effect (beta = 0.04,
standard error = 0.01, p = 0.006), whereas DAT-AC did not (beta = − 0.36, standard error = 0.49, p = 0.472).
Scientific Reports | (2021) 11:14394 | https://doi.org/10.1038/s41598-021-93442-y 7
Vol.:(0123456789)www.nature.com/scientificreports/
UPDRS MMSE
Predictors Beta (SE) P value Beta (SE) P value
DAT-PP − 3.60 (1.29) 0.008 0.72 (0.55) 0.203
DAT-AP − 3.96 (1.13) 0.001 0.98 (0.50) 0.053
DAT-PC − 6.31 (2.20) 0.006 2.70 (0.88) 0.004
Univariate DAT-AC − 4.82 (1.40) 0.001 1.86 (0.57) 0.002
FDR-PP 36.94 (14.09) 0.012 − 6.92 (6.02) 0.256
PC1 0.11 (0.04) 0.014 − 0.06 (0.02) 0.001
FBB-SUVR − 5.85 (4.85) 0.234 − 1.21 (1.98) 0.544
DAT-PP − 2.27 (1.48) 0.132
DAT-PC − 4.19 (2.55) 0.107
DAT-PC − 4.60 (2.44) 0.066
FDR-PP 23.54 (15.43) 0.134
DAT-PP − 3.06 (1.27) 0.020
PC1 0.09 (0.04) 0.035
DAT-AP − 3.30 (1.18) 0.008
PC1 0.07 (0.04) 0.107
DAT-PC − 5.00 (2.26) 0.032 1.90 (0.85) 0.031
Multivariate
PC1 0.08 (0.05) 0.075 − 0.05 (0.02) 0.006
DAT-AC − 3.92 (1.54) 0.014 1.20 (0.60) 0.050
PC1 0.06 (0.05) 0.182 − 0.05 (0.02) 0.014
FDR-PP 23.54 (15.43) 0.134
DAT-PC − 4.60 (2.44) 0.066
FDR-PP 13.85 (16.62) 0.409
DAT-AC − 3.94 (1.74) 0.029
FDR-PP 33.35 (13.46) 0.017
PC1 0.10 (0.04) 0.020
Table 4. Predictors for UPDRS motor and MMSE scores in DLB patients. Results are based on general linear
models for UPDRS motor and MMSE scores after controlling for age, sex, education, HTN, DM, DWMH,
and PWMH. The model emphasized in bold reflects minimizing AICs. AIC akaike information criterion, DAT
dopamine transporter, DAT-AC DAT uptake in the anterior caudate, DAT-AP DAT uptake in the anterior
putamen, DAT-PC DAT uptake in the posterior caudate, DAT-PP DAT uptake in the posterior putamen,
DLB dementia with Lewy bodies, DM diabetes mellitus, DWMH deep white matter hyperintensities, FBB-
SUVR 18F-Florbetaben standardized uptake value ratio, FDG 18F-fluorodeoxyglucose uptake, FDR-PP FDG
to DAT ratio in the posterior putamen, HTN hypertension, MMSE mini-mental state examination, PC1 the
first principal component of FDG subject residual profile, PWMH periventricular WMH, UPDRS unified
Parkinson’s disease rating scale.
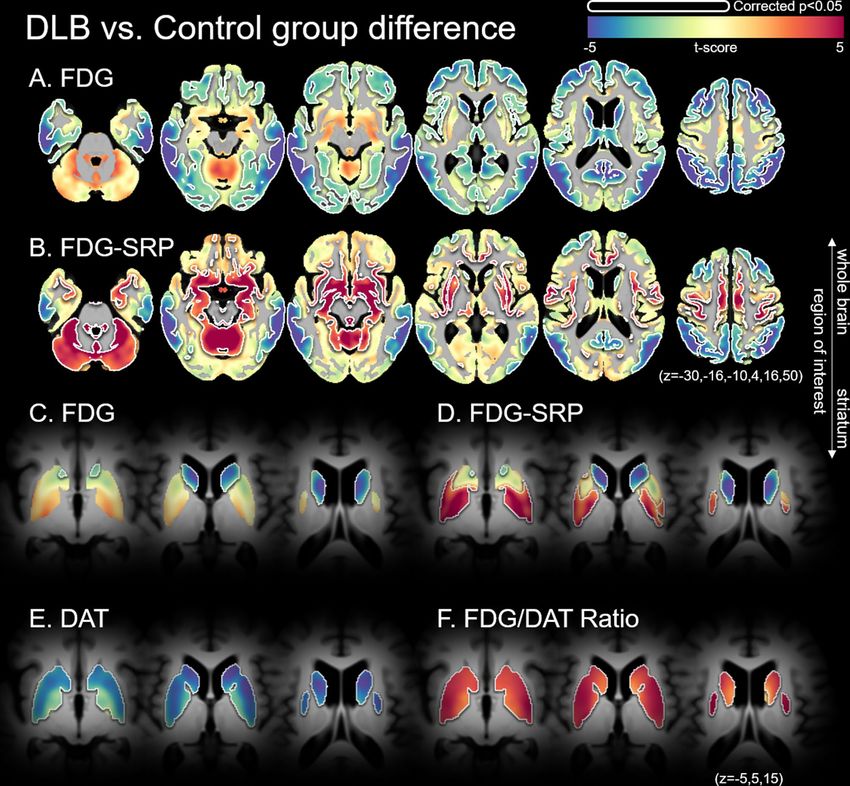
Group comparison of voxel‑wise FDG SUVR, DAT SUVR, and FDG‑SRP. Compared to the control
group, the DLB group had lower FDG SUVR in the bilateral caudate nuclei and widespread cortical regions,
including the bilateral frontal, parietal, temporal, and occipital cortices. Although statistical significance was not
achieved, the DLB group had higher FDG SUVRs in the central cerebellum, posterior putamen, and somato-
motor cortex (Fig. 2). Compared to the control group, the DLB group had significantly higher FDG-SRPs in the
cerebellum and limbic structures, including the hippocampus, putamen, and somato-motor cortex. The DLB
group had lower FDG-SRPs in the bilateral caudate nuclei, and the bilateral lateral temporal, parietal, and frontal
cortices. Compared to the control group, the DLB group had lower DAT uptake and higher FDG to DAT uptake
ratio in the bilateral striatum.
Correlation of voxel‑wise FDG‑SRP with imaging biomarkers. FDG-SRP in the cerebellum, limbic
structure including the hippocampus, bilateral posterior putamen, and somato-motor cortex negatively cor-
related with DAT-AP, DAT-PP, DAT-AC, and DAT-PC, and positively correlated with FDR-PP (Supplementary
Figure 3). These brain regions overlap with the increased FDG-SRP regions in the comparison between the DLB
group and the control group (Fig. 2), and PC1 (Supplementary Figure 2).
Discussion
We evaluated the performance of imaging biomarkers from FDG-PET and DAT-PET in the differentiation of
patients with DLB from controls. We also evaluated the implication of these imaging biomarkers for motor fea-
tures and cognitive function in DLB. Our major findings are as follows First, the spatial covariance pattern on
FDG-PET (PC1), which is characterized by an increased metabolism in the bilateral posterior putamen, vermis,
and somato-motor cortex, was observed in the DLB group and not in the control group. It also had better diag-
nostic performance than DAT-PP, which is a classic imaging biomarker for DLB. Second, the combination of PC1
with the imaging biomarker reflecting the discrepancy of FDG uptake and DAT uptake in the posterior putamen
(FDR-PP) had the best diagnostic performance for DLB (AUC = 0.99, specificity = 91.8%, and sensitivity = 96.4%).
Scientific Reports | (2021) 11:14394 | https://doi.org/10.1038/s41598-021-93442-y 8
Vol:.(1234567890)www.nature.com/scientificreports/
Attention Language Visuospatial Memory Frontal/executive
Predictor Beta (SE) P value Beta (SE) P value Beta (SE) P value Beta (SE) P value Beta (SE) P value
DAT-PP 0.17 (0.11) 0.139 0.37 (0.15) 0.019 0.35 (0.34) 0.306 0.23 (0.08) 0.009 0.25 (0.10) 0.014
DAT-AP 0.16 (0.10) 0.120 0.40 (0.14) 0.006 0.31 (0.32) 0.347 0.21 (0.08) 0.009 0.21 (0.09) 0.030
DAT-PC 0.43 (0.20) 0.042 0.85 (0.27) 0.003 0.77 (0.64) 0.235 0.48 (0.15) 0.002 0.54 (0.16) 0.002
DAT-AC 0.29 (0.13) 0.037 0.62 (0.17) 0.001 0.55 (0.42) 0.198 0.33 (0.10) 0.001 0.37 (0.11) 0.002
Univariate
FDR-PP − 1.33 (1.26) 0.298 − 3.44 (1.72) 0.053 − 3.21 (3.80) 0.402 − 1.75 (0.95) 0.073 − 1.88 (1.08) 0.091
− 0.01 − 0.02 − 0.01 − 0.01
PC1 0.014 0.004 − 0.03 (0.01) 0.005 0.001 < 0.001
(0.004) (0.005) (0.003) (0.003)
FBB-SUVR 0.31 (0.43) 0.480 − 0.07 (0.61) 0.914 1.91 (1.27) 0.140 − 0.10 (0.34) 0.775 0.15 (0.37) 0.679
DAT-PP 0.13 (0.19) 0.487 0.11 (0.10) 0.302 0.10 (0.12) 0.375
DAT-PC 0.69 (0.36) 0.062 0.36 (0.19) 0.069 0.43 (0.21) 0.047
0.30 (0.14) 0.18 (0.08) 0.18 (0.08)
DAT-PP 0.042 0.022 0.035
− 0.01 − 0.01 − 0.01
PC1 0.010 0.002 < 0.001
(0.005) (0.003) (0.003)
0.31 (0.14) 0.15 (0.07) 0.10 (0.08)
DAT-AP 0.029 0.051 0.239
− 0.01 − 0.01 − 0.01
Multivariate PC1 0.021 0.005 < 0.001
(0.005) (0.003) (0.003)
0.33 (0.20) 0.69 (0.26) 0.38 (0.14) 0.39 (0.14)
DAT-PC 0.109 0.011 0.008 0.009
− 0.01 − 0.01 − 0.01 − 0.01
PC1 0.036 0.015 0.003 < 0.001
(0.004) (0.005) (0.003) (0.003)
0.20 (0.14) 0.49 (0.18) 0.24 (0.10) 0.23 (0.10)
DAT-AC 0.158 0.008 0.015 0.036
− 0.01 − 0.01 − 0.01 − 0.01
PC1 0.057 0.039 0.009 0.001
(0.004) (0.005) (0.003) (0.003)
Table 5. Predictors for neuropsychological test scores in DLB patients. Results are based on general linear
models for neuropsychological z scores after controlling for age, sex, education, HTN, DM, DWMH, and
PWMH. The model emphasized in bold reflects minimizing AICs. AIC akaike information criterion, DAT
dopamine transporter, DAT-AC DAT uptake in the anterior caudate, DAT-AP DAT uptake in the anterior
putamen, DAT-PC DAT uptake in the posterior caudate, DAT-PP DAT uptake in the posterior putamen, DLB
dementia with Lewy bodies, DM diabetes mellitus, DWMH deep white matter hyperintensities, FBB-SUVR
18
F-Florbetaben standardized uptake value ratio, FDG 18F-fluorodeoxyglucose uptake, FDR-PP FDG to DAT
ratio in the posterior putamen, HTN hypertension, PC1 the first principal component of FDG subject residual
profile, PWMH periventricular WMH.
Third, when DAT biomarkers and PC1 were simultaneously used as predictors in DLB patients, DAT biomarkers
in the motor striatum (DAT-PP and FDR-PP) and PC1 had independent effects on UPDRS motor scores. Mean-
while, only DAT uptakes in the associative striatum (DAT-AC, DAT-PC, and DAT-AP) had significant effects
on UPDRS motor scores; PC1 did not. Lastly, PC1 and striatal DAT uptake had independent effects on MMSE,
language, memory, and frontal/executive function scores in DLB patients, while only PC1 was independently
associated with attention and visuospatial function scores. Taken together, our results suggest that simultaneously
evaluating DAT- and FDG-PET holds clinical value in the diagnosis of DLB.
Our first major finding is that PC1 had better diagnostic performance than DAT-PP. The identification of
PC1 was based on data-driven multivariate methods increasingly used to examine disease-specific metabolic
covariance patterns in Parkinson’s disease (PDRP)27, multiple system atrophy (MSARP)28, progressive supranu-
clear palsy (PSPRP)28, and corticobasal syndrome (CSBRP)29. The hypermetabolic pattern of PC1 involving the
bilateral posterior putamen, vermis, and somato-motor cortex is identical to the previously known PDRP, and
to the best of our knowledge, there has been no study directly comparing the diagnostic performance of PDRP
and the classic biomarker of DAT-PET in the differentiation of patients with DLB from control subjects. As
PC1 was identical to the previously reported PDRP27, our results provide evidence in support of DLB and PD as
phenotypes of the LBD spectrum. Since PC1 is the most prominent metabolic pattern in our study participants,
which included patients with DLB and controls, and we did not intentionally extract PC1 by comparing FDG
uptake between the DLB and control groups, the utilization of PC1 in the discerning of DLB from healthy sub-
jects is not susceptible to the circular reasoning p roblem30. Although we could not perform additional analyses
for external validation due to the small sample size, our results could shed light on the breakthrough for the low
diagnostic accuracy for DLB by increasing the sensitivity.
Both DLB and control groups had AI values suggesting rightward asymmetry, while the DLB group had
higher absolute AI values than the control group (Table 1). These results are consistent with Chen’s previous
study showing that DLB patients have significantly higher absolute AI values than controls, along with significant
rightward asymmetry in terms of local and global network e fficiency31. However, the controls in the previous
study had no asymmetry in terms of global and local network efficiency, while our control group had significant
rightward metabolic asymmetry. Different methodology of network analysis in the previous study could be a
reason for the different laterality in our control subjects. Although the previous study showed that PD dementia
(leftward asymmetry) and DLB (rightward asymmetry) patients had different asymmetric patterns in local
efficiency31, more frequent mixed AD pathology in the DLB group than in the PD dementia group could have
contributed to the different laterality32. Also, an increased absolute AI was shown to be characteristic of PD
Scientific Reports | (2021) 11:14394 | https://doi.org/10.1038/s41598-021-93442-y 9
Vol.:(0123456789)www.nature.com/scientificreports/
Figure 2. Comparison of FDG, DAT, and the FDG/DAT ratio between DLB and control groups. (A, C, E, F)
are based on a general linear model for the voxel-wise standardized uptake value ratio using cerebellar crus-II
as a reference region, and (B, D) are based on the general linear model for voxel-wise FDG subject residual
profile. FDG/DAT ratio represents the voxel-wise proportion of FDG and DAT uptake. Age, sex, education,
HTN, DM, DWMH, and PWMH are controlled for in the statistical model. The color scale indicates t values
in the statistical analysis; red color indicates a higher metabolism in the DLB group compared to the control
group, and blue color shows the inverse. Areas bounded by a white line indicate brain regions where the group
difference is significant after correcting for multiple comparisons (corrected p < 0.05, false discovery ratio).
Axial planes are displayed on Montreal Neurological Institute stereotaxic space in neurological convention
(A, B: z = − 30, − 16, − 10, 4, 16, 50; C, F: z = − 5, 5, 15). DAT dopamine transporter, DLB dementia with Lewy-
bodies, DM diabetes mellitus, DWMH deep white matter hyperintensities, FDG 18F-Fluorodeoxyglucose, HTN
hypertension, PWMH periventricular WMH.
dementia, as well as DLB, in the previous study31, and PC1 well explained the increased absolute AI in our DLB
patients (Supplementary Table 4). These results also suggest that DLB and PD share common pathophysiology.
Our second major finding is that the combination of FDR-PP and PC1 best differentiated patients with DLB
from controls. FDR-PP reflects the discrepancy between DAT uptake and FDG uptake in the PP. DAT uptake in
the striatum is decreased in PD patients33, but FDG uptake is preserved34 or relatively increased35. Meanwhile,
both DAT uptake36 and FDG uptake37 could be decreased in patients with striatal lacunar infarction. Considering
eople38, FDR-PP could have advantages over classic
the prevalence of asymptomatic lacunar infarction in elderly p
DAT uptake values by excluding DAT depletion due to vascular lesions. However, adding FDR-PP or DAT uptake
values in any of the four striatal regions to the model using PC1 alone did not significantly increase diagnostic
Scientific Reports | (2021) 11:14394 | https://doi.org/10.1038/s41598-021-93442-y 10
Vol:.(1234567890)www.nature.com/scientificreports/
accuracy. Although FDR-PP was significantly associated with UPDRS motor score after controlling for PC1 in
DLB patients (Table 4), PC1 provided sufficient accuracy for the diagnosis of DLB as a single biomarker (Table 3).
Our third major finding is that when DAT biomarkers and PC1 were simultaneously used as predictors, DAT
biomarkers in the motor striatum (DAT-PP and FDR-PP) and DAT uptake in the associative striatum (DAT-
AC, DAT-PC, and DAT-AP) consistently had significant effects on UPDRS motor scores, whereas PC1 did not,
when controlling for DAT uptake in the associative striatum. As DAT uptake values were closely inter-related
(Table 2), we could not compare the relative contribution of DAT uptake in the striatal subregions to clinical
symptoms. However, considering that PC1 was negatively correlated with DAT uptake in the associative striatum,
but not with DAT uptake in the motor striatum (Supplementary Table 2), our results seem to suggest that DAT
biomarkers have more dominant effects on motor severity than PC1 in DLB patients and that DAT uptake in the
associative striatum confounds the association between PC1 and motor severity score.
Lastly, PC1 and DAT biomarkers were independently associated with MMSE and language, memory, and
frontal/executive function scores in DLB patients, while only PC1 was independently associated with attention
and visuospatial function scores. Our results suggest that DAT biomarkers and PC1 have independent effects on
cognitive dysfunction. However, considering that attention and visuospatial dysfunction, which are neuropsy-
chological hallmarks of D LB39, was affected by PC1 only and that univariate models for cognitive scores using
PC1 as a predictor had the lowest AIC values, PC1 could have more dominant effects on cognitive dysfunction
than DAT biomarkers in DLB patients. Previous studies have shown that cognitive dysfunction in PD patients is
closely related with dopaminergic depletion in the associative s triatum40–43. Although we do not know whether
metabolic changes on PC1 and dopaminergic depletion in the associative striatum have a causal relationship
or there is another common underlying mechanism explaining both phenomena, dopaminergic depletion and
resulting disinhibition of the basal ganglia pacemaker in the external globus pallidus-subthalamic nucleus net-
work could be a possible explanation44,45.
This study has several limitations. First, the diagnosis of DLB was not made based on histopathological con-
firmation. However, all subjects in the DLB group were diagnosed as probable DLB and had abnormalities on
DAT-PET as assessed by an expert in nuclear medicine. Second, since the control group was younger and had
a longer duration of education and milder WMHs than the DLB group, caution is advised when interpreting
our results. However, considering that a ging46 and W MHs47 could decrease cerebral metabolism, the degree of
metabolic increase in the DLB group could be underestimated by these differences. Even with these limitations,
our results suggest that the relatively increased metabolism in the posterior putamen, vermis, and somato-motor
cortex could be a useful imaging biomarker that could enhance the diagnostic accuracy for DLB. Furthermore,
although DAT depletion and metabolic changes have more dominant effects on motor severity and cognitive
dysfunction, respectively, they independently contribute to clinical symptoms of DLB patients.
Data availability statement
The data that support the findings of this study are available from the corresponding author upon reasonable
request.
Received: 21 February 2021; Accepted: 24 June 2021
References
1. Kang, S. W. et al. Effects of Lewy body disease and Alzheimer disease on brain atrophy and cognitive dysfunction. Neurology 92,
e2015–e2026. https://doi.org/10.1212/WNL.0000000000007373 (2019).
2. McKeith, I. et al. Sensitivity and specificity of dopamine transporter imaging with 123I-FP-CIT SPECT in dementia with Lewy
bodies: A phase III, multicentre study. Lancet Neurol 6, 305–313. https://doi.org/10.1016/s1474-4422(07)70057-1 (2007).
3. Minoshima, S. et al. Alzheimer’s disease versus dementia with Lewy bodies: Cerebral metabolic distinction with autopsy confirma-
tion. Ann Neurol 50, 358–365. https://doi.org/10.1002/ana.1133 (2001).
4. Graff-Radford, J. et al. Dementia with Lewy bodies: Basis of cingulate island sign. Neurology 83, 801–809. https://doi.org/10.1212/
wnl.0000000000000734 (2014).
5. Ye, B. S. et al. Distinguishing between dementia with Lewy bodies and Alzheimer’s disease using metabolic patterns. Neurobiol
Aging 87, 11–17. https://doi.org/10.1016/j.neurobiolaging.2019.10.020 (2020).
6. Huber, M. et al. Metabolic correlates of dopaminergic loss in dementia with Lewy bodies. Mov Disord https://doi.org/10.1002/
mds.27945 (2019).
7. McKeith, I. G. et al. Diagnosis and management of dementia with Lewy bodies: Fourth consensus report of the DLB consortium.
Neurology 89, 88–100. https://doi.org/10.1212/wnl.0000000000004058 (2017).
8. Ye, B. S. et al. Distinguishing between dementia with Lewy bodies and Alzheimer’s disease using metabolic patterns. Neurobiol.
Aging 87, 11–17. https://doi.org/10.1016/j.neurobiolaging.2019.10.020 (2020).
9. McKeith, I. G. et al. Diagnosis and management of dementia with Lewy bodies: Third report of the DLB Consortium. Neurology
65, 1863–1872. https://doi.org/10.1212/01.wnl.0000187889.17253.b1 (2005).
10. Ahn, H. J. et al. Seoul Neuropsychological Screening Battery-dementia version (SNSB-D): A useful tool for assessing and monitor-
ing cognitive impairments in dementia patients. J. Korean Med. Sci. 25, 1071–1076. https://doi.org/10.3346/jkms.2010.25.7.1071
(2010).
11. Lee, Y. G. et al. Amyloid-β-related and unrelated cortical thinning in dementia with Lewy bodies. Neurobiol. Aging 72, 32–39.
https://doi.org/10.1016/j.neurobiolaging.2018.08.007 (2018).
12. Zhang, Y., Brady, M. & Smith, S. Segmentation of brain MR images through a hidden Markov random field model and the
expectation-maximization algorithm. IEEE Trans. Med. Imaging 20, 45–57. https://doi.org/10.1109/42.906424 (2001).
13. Patenaude, B., Smith, S. M., Kennedy, D. N. & Jenkinson, M. A Bayesian model of shape and appearance for subcortical brain
segmentation. Neuroimage 56, 907–922. https://doi.org/10.1016/j.neuroimage.2011.02.046 (2011).
14. Fazekas, F., Chawluk, J. B., Alavi, A., Hurtig, H. I. & Zimmerman, R. A. MR signal abnormalities at 1.5 T in Alzheimer’s dementia
and normal aging. AJR Am. J. Roentgenol. 149, 351–356. https://doi.org/10.2214/ajr.149.2.351 (1987).
Scientific Reports | (2021) 11:14394 | https://doi.org/10.1038/s41598-021-93442-y 11
Vol.:(0123456789)www.nature.com/scientificreports/
15. Kim, S. et al. Periventricular white matter hyperintensities and the risk of dementia: A CREDOS study. Int. Psychogeriatr. 27,
2069–2077. https://doi.org/10.1017/s1041610215001076 (2015).
16. Funck, T., Paquette, C., Evans, A. & Thiel, A. Surface-based partial-volume correction for high-resolution PET. Neuroimage 102(Pt
2), 674–687. https://doi.org/10.1016/j.neuroimage.2014.08.037 (2014).
17. Nugent, S. et al. Brain glucose and acetoacetate metabolism: A comparison of young and older adults. Neurobiol. Aging 35,
1386–1395. https://doi.org/10.1016/j.neurobiolaging.2013.11.027 (2014).
18. Nugent, S. et al. Selection of the optimal intensity normalization region for FDG-PET studies of normal aging and Alzheimer’s
disease. Sci. Rep. 10, 9261. https://doi.org/10.1038/s41598-020-65957-3 (2020).
19. Joutsa, J., Johansson, J. & Kaasinen, V. Is occipital cortex a valid reference region in 123I-FP-CIT SPECT imaging?. Clin. Nucl.
Med. 40, 615–616 (2015).
20. Bullich, S. et al. Optimal reference region to measure longitudinal amyloid-β change with 18F-Florbetaben PET. J. Nucl. Med. 58,
1300–1306. https://doi.org/10.2967/jnumed.116.187351 (2017).
21. Braak, H. & Braak, E. Neuropathological stageing of Alzheimer-related changes. Acta Neuropathol. 82, 239–259. https://doi.org/
10.1007/bf00308809 (1991).
22. Sabri, O. et al. Florbetaben PET imaging to detect amyloid beta plaques in Alzheimer’s disease: Phase 3 study. Alzheimers Dement.
11, 964–974. https://doi.org/10.1016/j.jalz.2015.02.004 (2015).
23. Jansen, W. J. et al. Prevalence of cerebral amyloid pathology in persons without dementia: A meta-analysis. JAMA 313, 1924–1938.
https://doi.org/10.1001/jama.2015.4668 (2015).
24. Moeller, J. R. & Strother, S. C. A regional covariance approach to the analysis of functional patterns in positron emission tomo-
graphic data. J. Cereb. Blood Flow Metab. 11, A121-135. https://doi.org/10.1038/jcbfm.1991.47 (1991).
25. Youden, W. J. Index for rating diagnostic tests. Cancer 3, 32–35. https://doi.org/10.1002/1097-0142(1950)3:1%3c32::aid-cncr2
820030106%3e3.0.co;2-3 (1950).
26. DeLong, E. R., DeLong, D. M. & Clarke-Pearson, D. L. Comparing the areas under two or more correlated receiver operating
characteristic curves: A nonparametric approach. Biometrics 44, 837–845 (1988).
27. Eckert, T., Tang, C. & Eidelberg, D. Assessment of the progression of Parkinson’s disease: A metabolic network approach. Lancet
Neurol. 6, 926–932. https://doi.org/10.1016/s1474-4422(07)70245-4 (2007).
28. Eckert, T. et al. Abnormal metabolic networks in atypical parkinsonism. Mov. Disord. 23, 727–733. https://doi.org/10.1002/mds.
21933 (2008).
29. Niethammer, M. et al. A disease-specific metabolic brain network associated with corticobasal degeneration. Brain 137, 3036–3046.
https://doi.org/10.1093/brain/awu256 (2014).
30. Rips, L. J. Circular reasoning. Cogn. Sci. 26, 767–795. https://doi.org/10.1207/s15516709cog2606_3 (2002).
31. Chen, D. et al. Brain network and abnormal hemispheric asymmetry analyses to explore the marginal differences in glucose meta-
bolic distributions among Alzheimer’s disease, Parkinson’s disease dementia, and Lewy body dementia. Front. Neurol. https://doi.
org/10.3389/fneur.2019.00369 (2019).
32. Donaghy, P., Thomas, A. J. & O’Brien, J. T. Amyloid PET imaging in Lewy body disorders. Am. J. Geriatr. Psychiatry 23, 23–37.
https://doi.org/10.1016/j.jagp.2013.03.001 (2015).
33. Marek, K. L. et al. [123I] beta-CIT/SPECT imaging demonstrates bilateral loss of dopamine transporters in hemi-Parkinson’s
disease. Neurology 46, 231–237. https://doi.org/10.1212/wnl.46.1.231 (1996).
34. Wolfson, L. I., Leenders, K. L., Brown, L. L. & Jones, T. Alterations of regional cerebral blood flow and oxygen metabolism in
Parkinson’s disease. Neurology 35, 1399–1405. https://doi.org/10.1212/wnl.35.10.1399 (1985).
35. Meles, S. K. et al. Abnormal pattern of brain glucose metabolism in Parkinson’s disease: Replication in three European cohorts.
Eur. J. Nucl. Med. Mol. Imaging 47, 437–450. https://doi.org/10.1007/s00259-019-04570-7 (2020).
36. Lorberboym, M., Djaldetti, R., Melamed, E., Sadeh, M. & Lampl, Y. 123I-FP-CIT SPECT imaging of dopamine transporters in
patients with cerebrovascular disease and clinical diagnosis of vascular parkinsonism. J. Nucl. Med. 45, 1688–1693 (2004).
37. Takahashi, W., Takagi, S., Ide, M., Shohtsu, A. & Shinohara, Y. Global reduction of cerebral glucose metabolism in persons with
symptomatic as well as asymptomatic lacunar infarction. Keio J. Med. 49(Suppl 1), A98-100 (2000).
38. Chen, X., Wen, W., Anstey, K. J. & Sachdev, P. S. Prevalence, incidence, and risk factors of lacunar infarcts in a community sample.
Neurology 73, 266–272. https://doi.org/10.1212/WNL.0b013e3181aa52ea (2009).
39. Oda, H., Yamamoto, Y. & Maeda, K. Neuropsychological profile of dementia with Lewy bodies. Psychogeriatrics 9, 85–90. https://
doi.org/10.1111/j.1479-8301.2009.00283.x (2009).
40. Bohnen, N. I. et al. Frequency of cholinergic and caudate nucleus dopaminergic deficits across the predemented cognitive spectrum
of Parkinson disease and evidence of interaction effects. JAMA Neurol. 72, 194–200. https://doi.org/10.1001/jamaneurol.2014.
2757 (2015).
41. Muller, U., Wachter, T., Barthel, H., Reuter, M. & von Cramon, D. Y. Striatal [123I]beta-CIT SPECT and prefrontal cognitive func-
tions in Parkinson’s disease. J. Neural Transm. (Vienna) 107, 303–319. https://doi.org/10.1007/s007020050025 (2000).
42. Jokinen, P. et al. Impaired cognitive performance in Parkinson’s disease is related to caudate dopaminergic hypofunction and
hippocampal atrophy. Parkinsonism Relat. Disord. 15, 88–93. https://doi.org/10.1016/j.parkreldis.2008.03.005 (2009).
43. Christopher, L. et al. Combined insular and striatal dopamine dysfunction are associated with executive deficits in Parkinson’s
disease with mild cognitive impairment. Brain 137, 565–575. https://doi.org/10.1093/brain/awt337 (2014).
44. Plenz, D. & Kital, S. T. A basal ganglia pacemaker formed by the subthalamic nucleus and external globus pallidus. Nature 400,
677–682. https://doi.org/10.1038/23281 (1999).
45. Burkhardt, J. M., Jin, X. & Costa, R. M. Dissociable effects of dopamine on neuronal firing rate and synchrony in the dorsal striatum.
Front. Integr. Neurosci. 3, 28. https://doi.org/10.3389/neuro.07.028.2009 (2009).
46. Jiang, J. et al. Study of the influence of age in (18)F-FDG PET images using a data-driven approach and its evaluation in Alzheimer’s
disease. Contrast Media Mol. Imaging 2018, 3786083. https://doi.org/10.1155/2018/3786083 (2018).
47. Heiss, W. D., Rosenberg, G. A., Thiel, A., Berlot, R. & de Reuck, J. Neuroimaging in vascular cognitive impairment: A state-of-the-
art review. BMC Med. 14, 174. https://doi.org/10.1186/s12916-016-0725-0 (2016).
Acknowledgements
This research was supported by a National Research Foundation of Korea Grant funded by the Korean Govern-
ment (NRF-2019R1I1A1A01059454).
Author contributions
S.W.K., S.J., and B.S.Y. were responsible for the study design. S.W.K., S.J., and B.S.Y. were responsible for the
literature search. Y.G.L., M.P., K.B., J.H.J., H.S.Y., S.J.C., and S.H.J. were responsible for interpreting data. S.W.K.,
P.H.L., Y.H.S., and B.S.Y. were responsible for the clinical data collection and analyses. S.J., M.Y., and A.C.E. were
responsible for the imaging data processing and analyses. S.W.K., S.J., and B.S.Y. were responsible for drafting
the manuscript. S.W.K., S.J., and B.S.Y. conducted the statistical analyses.
Scientific Reports | (2021) 11:14394 | https://doi.org/10.1038/s41598-021-93442-y 12
Vol:.(1234567890)You can also read