Acute effects of 2.856 GHz and 1.5 GHz microwaves on spatial memory abilities and CREB related pathways
←
→
Page content transcription
If your browser does not render page correctly, please read the page content below
www.nature.com/scientificreports
OPEN Acute effects of 2.856 GHz
and 1.5 GHz microwaves on spatial
memory abilities and CREB‑related
pathways
Shengzhi Tan1, Hui Wang2*, Xinping Xu2, Li Zhao2, Jing Zhang2, Ji Dong2, Binwei Yao2,
Haoyu Wang2, Yanhui Hao2, Hongmei Zhou2, Yabing Gao2 & Ruiyun Peng2*
This study aimed to evaluate the acute effects of 2.856 GHz and 1.5 GHz microwaves on spatial
memory and cAMP response element binding (CREB)-related pathways. A total of 120 male Wistar
rats were divided into four groups: a control group (C); 2.856 GHz microwave exposure group (S
group); 1.5 GHz microwave exposure group (L group); and 2.856 and 1.5 GHz cumulative exposure
group (SL group). Decreases in spatial memory abilities, changes in EEG, structural injuries, and
the downregulation of phosphorylated-Ak strain transforming (p-AKT), phosphorylated-calcium/
calmodulin-dependent protein kinase II (p-CaMKII), phosphorylated extracellular signal regulated
kinase (p-ERK) and p-CREB was observed 6 h after microwave exposure. Significant differences in
the expression of p-CaMKII were found between the S and L groups. The power amplitudes of the
EEG waves (θ, δ), levels of structural injuries and the expression of p-AKT, p-CaMK II, p-CREB, and
p-ERK1/2 were significantly different in the S and L groups compared to the SL group. Interaction
effects between the 2.856 and 1.5 GHz microwaves were found in the EEG and p-CREB changes.
Our findings indicated that 2.856 GHz and 1.5 GHz microwave exposure induced a decline in spatial
memory, which might be related to p-AKT, p-CaMK II, p-CREB and p-ERK1/2.
The brain is one of the most sensitive organs to electromagnetic radiation1–3. The effects of microwave radiation
on spatial learning and memory ability have been reported in many studies4,5, but the mechanisms are not clear.
Most studies focused on the biological effects of microwaves at a single frequency. Microwaves with frequencies
of 2.856 GHz and 1.5 GHz belong to the S and C bands, respectively, and are widely used in telecommunication,
especially radar communication. Microwaves with different frequencies have different electromagnetic proper-
ties, which might induce different biological effects. People who operated radars or lived near a radar station
are generally exposed to a complex electromagnetic environment of different frequencies. Therefore, in this
study, we used two different frequencies (2.856 GHz and 1.5 GHz) of microwaves with the same power density
(10 mW/cm2) to determine the properties and accumulative biological effects of the two different microwaves.
The Morris water maze (MWM), as a classic test for spatial learning and memory in rodents, has been widely
used to assess microwave radiation-induced impairment of spatial m emory6–9. Electroencephalographic (EEG)
data are frequently used to assess the effects of microwave exposure on brain bioelectrical activity because of
the sensitivity of these scans to immediate changes in neural processes10–12. However, previous studies paid lit-
tle attention to the acute effects of microwave radiation. Therefore, the present study evaluated the acute and
accumulative effects of two different microwave frequencies on learning and memory abilities and bioelectrical
activity.
Microstructural observations should not be neglected in investigations of the possible mechanisms. Neurons
are the basis for signal transmission and learning and memory development. Microwave radiation induces neural
cell apoptosis via the classic mitochondrion-dependent caspase-3 p athway13. The hippocampus and cortex are
important brain areas for learning and memory abilities. Therefore, it is necessary to observe changes in the
neurons in the hippocampus and cortex, especially the occurrence of neuronal apoptosis.
Many studies have shown that cAMP-response element binding protein (CREB) plays an important role
in learning and memory p rocesses14–16. CREB is a key transcription factor that regulates the expression and
1
PLA Strategic Support Force Characteristic Medical Center, Beijing, People’s Republic of China. 2Department
of Experimental Pathology, Beijing Institute of Radiation Medicine, Beijing, People’s Republic of China. *email:
wanghui597bj@163.com; ruiyunpeng18@126.com
Scientific Reports | (2021) 11:12348 | https://doi.org/10.1038/s41598-021-91622-4 1
Vol.:(0123456789)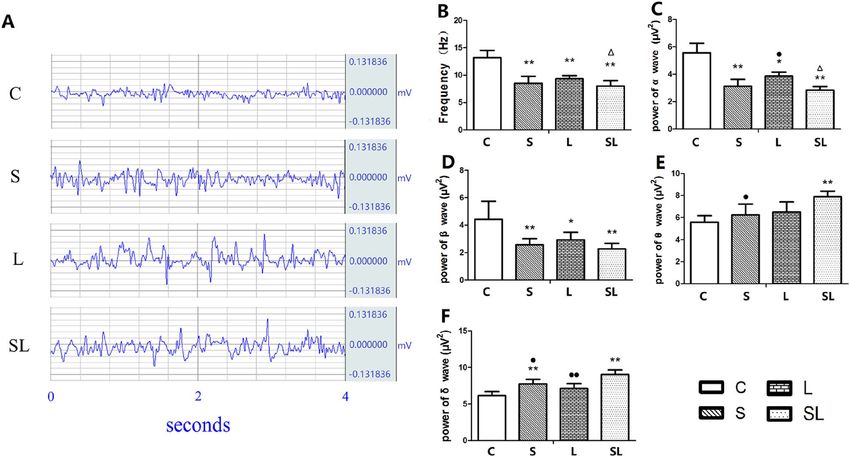
www.nature.com/scientificreports/
activity of genes to alter the function of neurons17–19. CREB is also a connection between several neural func-
tion-related pathways. The phosphoinositide 3-kinase (PI3K)/Ak strain transforming (AKT) pathway, calcium/
calmodulin-dependent protein kinase II (Ca2+/CaMKII) pathway and mitogen-activated protein kinase (MEK)/
extracellular signal regulated kinase (ERK) pathway are three key upstream pathways of C REB20–22 and regu-
late the expression of multiple downstream functional proteins in the nervous system. Activation of the PI3K/
AKT pathway was observed in neuron-like cells after microwave exposure, and the changes were considered
protective responses23–25. The influx of calcium increases after microwave radiation in neuron-like c ells26, which
suggests that the Ca2+/CaMKII pathway participates in microwave bioeffects. Increased ERK phosphorylation
is detected in response to extremely low-frequency electromagnetic fi elds27. However, the relationship between
these microwave-sensitive pathways is not clear.
The present study detected the expression levels of AKT, p-AKT, CaMK II, p-CaMK II, CREB, p-CREB,
ERK1/2 and p-ERK1/2. We compared the molecular mechanisms between the different frequency microwaves
and explored the possible interaction effects between the two frequencies. These findings could contribute to our
understanding of the mechanisms of microwave-induced spatial memory impairment. Two different microwave
frequencies were considered two different factors. Therefore, a 2 × 2 factorial design was used to evaluate whether
an interaction occurred between the frequencies.
Materials and methods
Animals and groups. The Ethics Committee of the Academy of Military Medical Science approved all
experimental protocols for animal care, handling and experimentation (IACUC-DWZX-2020–0780), and all
experiments were performed in accordance with relevant guidelines and regulations. All the methods were car-
ried out in accordance with the Guide for the Care and Use of Laboratory Animals published by the US National
Institutes of Health (NIH Publication No. 85–23, revised 1996). The study was carried out in compliance with
the ARRIVE guidelines (http://www.nc3rs.org.uk/page.asp?id=1357).
A total of 120 male Wistar rats (weights 200 ± 20 g) (n = 30 per group) were obtained from the Laboratory
Animal Center of the Beijing Institute of Radiation Medicine and housed in a specific pathogen-free (SPF)-grade
animal facility. All experiments were performed between 8:00 and 15:00.
The 2.856 GHz and 1.5 GHz microwaves lie within the S band and L band, respectively. Therefore, we used
the letter “S” to represent the 2.856 GHz exposure group and the letter “L” to represent the 1.5 GHz exposure
group. “SL” represented the 2.856 and 1.5 GHz cumulative microwave exposure group. All rats were randomly
divided into four groups: (1) the control group (C); (2) the 2.856 GHz microwave exposure group (S); (3) the
1.5 GHz microwave exposure group (L); and (4) the 2.856 and 1.5 GHz cumulative microwave exposure (SL).
Microwave exposure and dosimetry. Two microwave sources with a frequency of 2.856 GHz or 1.5 GHz
were placed next to each other in an electromagnetic shield chamber. The exposure procedures were the same
as those used by Tan28. Briefly, rats in the S and L groups were exposed to 2.856 GHz or 1.5 GHz microwaves,
respectively, with an average power density of 10 mW/cm2 for 6 min. Rats in the SL group were first exposed
to the 2.856 GHz antenna (the S band) for 6 min then moved parallel to the 1.5 GHz antenna (the L band) for
6 min via a conveyor belt. The interval time between the two exposure procedures was very short and may be
negligible.
The specific absorption rate (SAR) values were calculated as described in our previous paper2. The SAR values
were calculated as described in our previous paper28. The SAR values of the whole body for C, S and L were 0,
3.3 and 3.7 W/kg, respectively. For the SL group, the SAR values of the whole body were 3.3 W/kg for the first
6 min and 3.7 W/kg for the last 6 min.
Morris water maze. The procedures for the Morris water maze strictly followed those of previous reports6,29.
Briefly, a circular pool with a diameter of 150 cm was filled with water at 23 ± 0.5 °C in a room with constant
brightness and divided into four equal quadrants. A platform with a diameter of 12 cm and a height of 15 cm was
submerged 1.5 cm under the water surface. A Morris water maze video analysis system (Beijing Sunny Instru-
ment Co., Ltd., Beijing, China) based on moving object detection and tracking was used.
Sixty male Wistar rats (n = 15 per group) in a fixed order were trained to find the submerged platform in
4 trials before microwave exposure. The training experiment lasted 2 days. The rats were trained to find the
submerged escape platform for three consecutive days before the initiation of radiation. Each trial consisted of
four trials, which started from four different starting positions. These positions were equally located around the
perimeter of the pool and used in a fixed order. Each trial had a maximum duration of 60 s. Rats that did not
find the platform within 60 s in the training tests were placed on the platform for 15 s. The rats were exposed to
microwave radiation on day 3. Navigation tests were performed 6 h after microwave exposure to detect acute
changes in spatial memory. Four trials were conducted, and each trial had a maximum duration of 60 s. The
duration of each rat to find the platform was recorded separately, and the average escape latency (AEL) of each
rat in the water maze was obtained by calculating the average of 4 trials for each experimental animal for each
training day. The behavior of the rats was digitally recorded by using a SLY-MW system (Beijing Sunny Instru-
ment Co., China), and the AEL was analyzed.
EEG recordings. Twenty male Wistar rats (n = 5 per group) were anesthetized with 1% sodium pentobar-
bital (0.5 ml/100 g). An Mp-150 multichannel physiological recording and analysis system (Biopac Company,
USA) was used. The electrodes were connected to the amplifier, and the rats were recorded for 3 min in a quiet
state 6 h after microwave exposure. Afterward, power spectral analyses were performed.
Scientific Reports | (2021) 11:12348 | https://doi.org/10.1038/s41598-021-91622-4 2
Vol:.(1234567890)
www.nature.com/scientificreports/
Hematoxylin and eosin (H&E) and TUNEL staining of the hippocampus. Twenty male Wistar
rats (n = 5 per group) were anesthetized with sodium pentobarbital (50 mg/kg, IP) 6 h after microwave exposure.
The skin was removed from the head of the anesthetized rats. The bregma point of the brain tissue was marked
and drilled, and the brain tissue was separated. The right brain tissue was cut 3.3–3.8 mm behind the bregma
point. The brain tissues were fixed in formalin. The right brains were separated and fixed in a 10% buffered for-
malin solution for at least 1 week. Coronal brain sections, including the hippocampus, were made. The sections
were selected at 3.6 mm behind the bregma point. The sections were dried, dewaxed, dipped in hematoxylin
for 15 min and washed for 20 min with tap water. Eosin was used to stain the sections for 15 s. Sections were
dehydrated in an alcohol gradient and cleared in xylene. Cover slips were placed on the slides, and the stained
sections were observed under a Leica DM6000 light microscope (Leica, Germany). The DG area of the hip-
pocampus was observed with a light microscope.
Paraffin sections of the hippocampus were prepared 6 h after microwave exposure. The sections were dried,
dewaxed, and treated with proteinase K (20 μg/ml, Roche, Switzerland) for 10 min to make the cell membrane
permeable. The sections were then treated with the reaction solution mixture (enzyme solution and label solu-
tion, Roche, Switzerland) for the TdT-mediated dUTP nick-end labeling (TUNEL) reaction. After treatment with
biotin-labeled horseradish peroxidase (HRP, ZSGB, Beijing, China), 3,3′-diaminobenzidine (DAB) chromogen
(ZSGB, Beijing, China) was used to develop the color. A Leica DM6000 light microscope was used to observe the
stained sections. The DG areas were selected at 3.6 mm posterior to bregma, 2–2.5 mm lateral to the mid-line
and at a depth of approximately 3.5 mm.
Pathological analyses used five rats from each group. Ten sections of each rats were made. Approximately
60 cells in the DG area were selected from each section. The mean optical density (MOD) in H&E sections
referred to the ratio of the area of the dark blue nucleus to the total area of the nucleus in the observed cells. The
integrated optical density (IOD) referred to the whole optical density of all positive nuclei from observed cells
in the TUNEL-stained sections. As for calculating IOD, the background from each section was subtracted and
each rat was used for one datapoint.
Western blotting. Twenty male Wistar rats (n = 5 per group) were anesthetized, and the entire left hip-
pocampus was separated. The tissue was homogenized for Western blotting (WB). The expression levels
of p-AKT, p-CaMKII, p-CREB, p-ERK1/2, AKT, CaMKII, CREB and ERK1/2 in the hippocampi of the rats
were detected by WB 6 h after microwave exposure. Protein extraction and quantification and WB procedures
were performed according to Xiong’s r esearch26. Primary antibodies against p-AKT (Abcam, UK), p-CaMKII
(Abcam, UK), p-CREB (Abcam, UK), p-ERK1/2 (Abcam, UK), AKT (Abcam, UK), CaMKII (Abcam, UK),
CREB (Abcam, UK) and ERK1/2 (Abcam, UK) were used at 1:1000 dilutions. The dark room film development
method was used to obtain images of the protein bands, which were quantified using ImageJ 1.80 software. An
HP LaserJet pro MFP m126a scanner was used for film scanning, and the scanned images were analyzed via
Microsoft Word software for simple color saturation and overall brightness adjustment of the image. The protein
abundance was normalized to that of GAPDH.
Statistical analysis. The data are shown as the means and standard deviation ( X ±S). The interaction effects
were analyzed by a 2 × 2 factorial design. The 2.856 GHz microwave exposure and 1.5 GHz microwave expo-
sure were regarded as two factors in the factorial design. Two-way ANOVA and multiple comparisons were
performed with SPSS 19.0 software, and Δp < 0.05 or ΔΔp < 0.01 were considered significant interaction effects. If
interaction effects were observed, then a regression analysis was used to determine which factor played a more
important role. Factors with larger absolute values of the standardized regression coefficient (β value) were
considered to be of greater importance. If there were significant main effects in the anova, the posthoc multiple
comparisions were conducted by the bonferroni analysis, with *p < 0.05 or **p < 0.01 (vs. C), •p < 0.05 or ••p < 0.05
(vs. SL), #p < 0.05 or ##p < 0.01 (L vs. S).
Results
Acute impairment of spatial memory abilities after 2.856 GHz and 1.5 GHz microwave expo‑
sure. The average escape latency (AEL) indicates the time needed for the rats to find the platform in the
MWM. A prolonged AEL indicates a decline in spatial memory abilities.
After two days of training before microwave exposure, there were no differences in AEL between the C, S, L
and SL groups, which indicated the same basic learning and memory abilities of the four groups before microwave
exposure. Compared to that in the C group, the AEL of the rats in the S (p = 0.012), L (p = 0.049) and SL groups
(p = 0.001) significantly increased 6 h after microwave exposure (Fig. 1).
No significant differences were found between the S and L groups.
No significant differences were found between the single-exposure groups (S, L) and the cumulative group
(SL).
Factorial analysis of the four groups (C, S, L and SL) revealed no significant interaction effects between
the 2.856 GHz and 1.5 GHz microwave radiation (p = 0.273). According to the standardized regression coef-
ficient (β value) of the regression analysis, 2.856 GHz microwave radiation played major roles in the changes in
AEL(βS = 0.511, βL = 0.335,|βS| >|βL|).
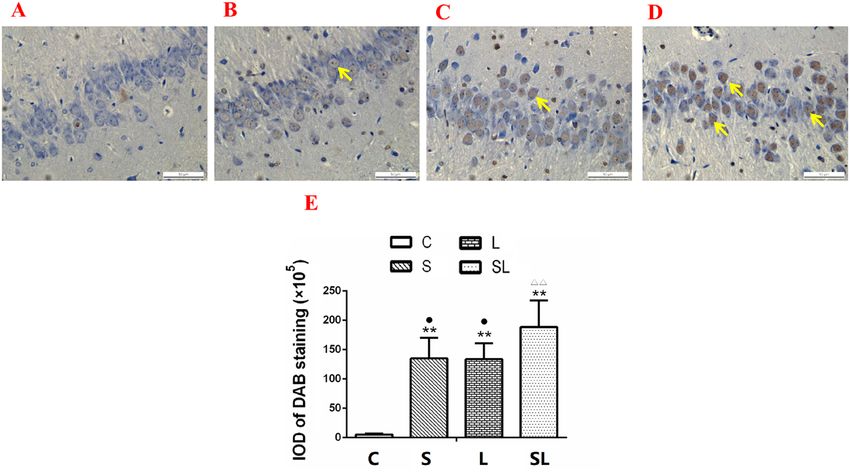
Acute inhibition of EEG after 2.856 GHz and 1.5 GHz microwave exposure. EEG examinations
were performed 6 h after microwave exposure, and the EEG waveform is shown in Fig. 2A. The frequency of
the EEG decreased significantly in the S (p = 0.000), L (p = 0.001) and SL (p = 0.000) groups (p < 0.01) compared
with the C group (Fig. 2B). The power amplitudes of the α waves significantly decreased in the S (p = 0.000),
Scientific Reports | (2021) 11:12348 | https://doi.org/10.1038/s41598-021-91622-4 3
Vol.:(0123456789)www.nature.com/scientificreports/
Figure 1. The AELs of the rats during the MWM test. The data are presented as the means ± SDs. *p < 0.05 and
**p < 0.01. compared to the C group. “C” stands for the control group, “S” stands for the 2.856 GHz microwave
exposure group, “L” stands for the 1.5 GHz microwave exposure group, and “SL” stands for the 2.856 and
1.5 GHz cumulative exposure group.
Figure 2. Changes in the frequency and power of α, β, θ and δ waves in the EEGs. The data are presented as the
means ± SDs. (A) shows the waveforms of the EEGs in the four groups. (B) shows the statistical results of the
EEG frequency. (C)-(F) show the statistical results of the powers of α, β, θ and δ waves, respectively. *p < 0.05
and **p < 0.01 compared to the C group. 1. •p < 0.05 and ••p < 0.01 compared to the cumulative group. Δp < 0.05
indicates the existence of interaction effects between the 2.856 GHz and 1.5 GHz microwaves. “C” stands for the
control group, “S” stands for the 2.856 GHz microwave exposure group, “L” stands for the 1.5 GHz microwave
exposure group, and “SL” stands for the 2.856 and 1.5 GHz cumulative exposure group.
L (p = 0.002) and SL (p = 0.000) groups compared with the C group, and the power amplitudes of the β waves
significantly decreased in the S (p = 0.019), L (p = 0.046) and SL (p = 0.009) groups compared with the C group
(Fig. 2C,D). The power amplitudes of the θ waves in the SL (p = 0.007) group and δ waves in the S (p = 0.008) and
SL (p = 0.000) groups significantly increased compared with those in the C group (Fig. 2E,F).
No significant changes were found between the S and L groups.
The power amplitude of the α wave significantly increased in the L group (p = 0.045) compared with the SL
group (Fig. 2B). The power amplitude of the θ wave in the S group was lower than that in the SL group (p = 0.032)
(Fig. 2E). The power amplitudes of the δ waves significantly decreased in the S (p = 0.023) and L (p = 0.004) groups
compared with the SL group (Fig. 2F).
Factorial analysis of the four groups (C, S, L and SL) revealed significant interaction effects between the
2.856 GHz and 1.5 GHz microwaves for the frequency changes in the EEG (p = 0.018) and the power amplitude
Scientific Reports | (2021) 11:12348 | https://doi.org/10.1038/s41598-021-91622-4 4
Vol:.(1234567890)www.nature.com/scientificreports/
Figure 3. Pathological injuries in the hippocampus of rats 6 h after 2.856 GHz and 1.5 GHz microwave
exposure. The microstructures were detected by LM 6 h after exposure to support the behavioral results. (A–D)
Hippocampi of the C group, S group, L group and SL group. (E) Statistical analysis results of the MOD of dark
blue staining in hippocampi. Compared to the C group, **p < 0.01. Compared to the cumulative group, ••p < 0.01.
There was no neuron degeneration detected by A and E., and injuries that included karyopyknosis, an irregular
arrangement of cells, cell edema, and a broadening pericellular space were found in (B–D). Most injuries
occurred in (D). (H&E, scale bar = 50 μm). “C” stands for the control group, “S” stands for the 2.856 GHz
microwave exposure group, “L” stands for the 1.5 GHz microwave exposure group, and “SL” stands for the 2.856
and 1.5 GHz cumulative exposure group. The data are presented as the means ± SDs.
changes in the α wave (p = 0.031). According to the standardized regression coefficient (β value) of the regres-
sion analysis, 2.856 GHz microwave radiation played major roles in the changes in EEG frequency (βS = − 0.69,
βL = − 0.458, |βS| >|βL|) and the power of the α wave (βS = − 0.747, βL = − 0.435, |βS| >|βL|). These results indicated
that 2.856 GHz microwave radiation played major roles in the changes in the EEG for the cumulative exposure
group.
Exposure to 2.856 GHz and 1.5 GHz microwaves caused significant structural injuries in the
hippocampus. To assess morphological changes in neurons, histological examinations of the hippocampus
were carried out. Obvious injuries in the DG areas of the hippocampus were found in the microwave exposure
groups (S, L and SL) compared with the C group (Fig. 3A–D). The injuries included karyopyknosis and cell
edema, as shown by the dark blue-stained nuclei. Therefore, we analyzed the dark blue areas using statistical
methods. The MOD of the dark blue area of the nuclei increased significantly in the hippocampus in the S
(p = 0.000), L (p = 0.000) and SL (p = 0.000) groups compared with the C group (Fig. 3E). The MOD of the dark-
blue areas of the hippocampus decreased significantly in the S (p = 0.004) and L (p = 0.003) groups compared
with the SL group, which indicated that the most significant injuries occurred in the cumulative group (Fig. 3E).
There were no significant interactions after the factorial analysis. According to the standardized regression coef-
ficient (β value) of the regression analysis, 2.856 GHz microwave radiation played major roles in the changes in
MOD of dark blue-stained nuclei of hippocampus (βS = 0.729, βL = 0.621, |βS| >|βL|).
Exposure to 2.856 GHz and 1.5 GHz microwaves induced cell apoptosis in the hippocam‑
pus. To evaluate changes in neuronal cells, apoptosis was analyzed by TUNEL staining 6 h after microwave
exposure. Deep-dyed nuclei were observed in the DG area of the hippocampi in the S, L and SL groups, which
indicates the occurrence of apoptosis in neurons (Fig. 4A–D). The integrated optical density (IOD) of DAB
staining in the hippocampus increased significantly in the S (p = 0.000), L (p = 0.000) and SL (p = 0.000) groups
compared with the C group (Fig. 4E). The IOD of DAB staining in the hippocampus decreased significantly
in the S (p = 0.022) and L (p = 0.013) groups compared with the SL group (Fig. 4E). Factorial analysis revealed
significant interaction effects in the hippocampus and cortex between the 2.856 GHz microwave radiation and
1.5 GHz microwave radiation (p = 0.002) groups (Fig. 4E). According to the standardized regression coefficients
(β value) of the regression analysis, 1.5 GHz microwave radiation played major roles in IOD value changes in the
hippocampus ((βS = − 0.61, βL = − 0.666, |βS|www.nature.com/scientificreports/
Figure 4. Cell apoptosis in the hippocampus of rats 6 h after 2.856 GHz and 1.5 GHz microwave exposures,
as detected by TUNEL staining. (A–D) Hippocampi of the C group, S group, L group and SL group (TUNEL,
scale bar = 50 μm). (E) IOD changes in the hippocampus. Compared to the C group, **p < 0.01. Compared to the
cumulative group, •p < 0.05. ΔΔp < 0.01 indicates the existence of interaction effects between the 2.856 GHz and
1.5 GHz microwaves. “C” stands for the control group, “S” stands for the 2.856 GHz microwave exposure group,
“L” stands for the 1.5 GHz microwave exposure group, and “SL” stands for the 2.856 and 1.5 GHz cumulative
exposure group. The data are presented as the means ± SDs.
Changes in CREB‑related signaling proteins after 2.856 GHz and 1.5 GHz microwave expo‑
sure. Six hours after microwave exposure, p-AKT/AKT (p = 0.015), p-CREB/CREB (p = 0.001) (Fig. 5A,B,D)
and p-ERK/ERK (p = 0.011) (Fig. 6A,B) decreased significantly in the SL group, and the expression of p-CaM-
KII/CaMKII decreased significantly decreased in the S (p = 0.009) and SL (p = 0.000) groups (Fig. 5A,C) com-
pared with the C group.
Significant differences were also found between the S and L groups. The expression of p-CaMKII/CaMKII
increased significantly in the L group (p = 0.021) compared with the S group.
The expression of p-AKT/AKT increased significantly in the L group compared with the SL group (p = 0.024).
The expression levels of p-CaMKII/CaMKII increased significantly in the S (p = 0.006) and L (p = 0.000) groups
compared with the SL group (Fig. 5A–C). The expression levels of p-CREB/CREB increased significantly in the S
(p = 0.013) and L (p = 0.001) groups compared with the SL group (Fig. 5A,D). The expression of p-ERK increased
significantly in the S group (p = 0.007) compared with the SL group (Fig. 6A,B).
Factorial analysis of the four groups (C, S, L and SL) revealed significant interaction effects between the
2.856 GHz and 1.5 GHz microwaves only for p-CREB/CREB (p = 0.046) expression. According to the standard-
ized regression coefficient (β value) of the regression analysis, the 2.856 GHz microwaves played major roles in
the decreased expression of p-AKT/AKT (βS = -− 8.33, βL = − 0.417, |βS| >|βL|), p-CaMKII/CaMKII (βS = − 8.845,
βL = − 0.396, |βS| >|βL|) and p-CREB/CREB (βS = − 0.757, βL = − 0.326, |βS| >|βL|) (Fig. 5). According to the stand-
ardized regression coefficient (β value) of the regression analysis, the 1.5 GHz microwaves played major roles in
the decreased expression of p-ERK/ERK (βS = − 0.199, βL = − 0.751, |βS|www.nature.com/scientificreports/
Figure 5. Comparisons of the levels of p-AKT (B), p-CaMKII (C), and p-CREB (D) in the hippocampi of
the C, S, L and SL groups. (A) Expression of four proteins in the C, S, L and SL groups. (B) Statistical analysis
results of p-AKT in the four groups. (C) Statistical analysis results of p-CaMKII in the four groups. (D)
Statistical analysis results of p-CREB in the four groups. The data are presented as the means ± SDs. *p < 0.05
and **p < 0.01 compared to the C group. #p < 0.05 compared to the S10 group. •p < 0.05 and ••p < 0.01 compared
to the cumulative group. Δp < 0.05 indicates the existence of interaction effects between the 2.856 GHz and
1.5 GHz microwaves. “C” stands for the control group, “S” stands for the 2.856 GHz microwave exposure group,
“L” stands for the 1.5 GHz microwave exposure group, and “SL” stands for the 2.856 and 1.5 GHz cumulative
exposure group.
between the 2.856 GHz and 1.5 GHz microwaves and found no differences in the AELs, which demonstrated
that 2.856 GHz and 1.5 GHz could lead to decreased spatial memory abilities in Wistar rats. No differences were
found between the cumulative exposure group and single-frequency-exposure groups, and no interaction effects
were found by the factorial analysis of the AELs.
EEG scans directly reflect the physiological activities of the brain and are commonly used to evaluate brain
function34,35. Changes in EEG activity results in many degenerative brain diseases36. EEG also plays important
roles in the neuromodulatory balance of memory and mental i llness37. Thuroczy reported that local brain expo-
sure to 4 GHz continuous waves (CW) increased the power of δ w aves38. Four kinds of waves, α (12–30 Hz), β
(8–12 Hz), θ (4–8 Hz) and δ (1–4 Hz), lie within the EEG spectrum. The α and β waves appear in a relaxed or
nervous status of the brain, and the θ and δ waves appear in a tired or sleepy state of the brain39. Our results
indicated that microwave exposure caused rats to enter a more tired or depressed state.
Many studies found that microwave radiation induced structural damage in brain t issue11,40. The present
study found tissue injuries in the 2.856 GHz and 1.5 GHz microwave exposure groups. The injuries were similar
between the two single-frequency-exposure groups. The most serious injuries were observed in the cumulative
exposure groups. To clarify the type of injuries, TUNEL staining was conducted. Cell apoptosis was observed in
the hippocampus and cortex of the exposure groups. Previous studies found that neuroapoptosis in developing
brains might cause long-term learning and memory a bnormalities41. Apoptosis might explain the microwave-
induced learning and memory impairments.
Analyses of the MWM, EEG, H&E staining and TUNEL staining revealed no significant differences between
the 2.856 GHz microwave exposure and 1.5 GHz microwave exposure, which suggested that microwaves with
frequencies in similar ranges induced similar effects. Accumulative microwave exposure induced serious changes.
Therefore, dose accumulation played a more important role than single frequency microwave exposure. Notably,
interaction effects were found for the changes in the EEG frequency, power amplitudes of α waves and IOD
values of the TUNEL staining in the hippocampus. The standardized regression coefficients showed that the
Scientific Reports | (2021) 11:12348 | https://doi.org/10.1038/s41598-021-91622-4 7
Vol.:(0123456789)www.nature.com/scientificreports/
Figure 6. Comparison of the levels of p-ERK and ERK in the hippocampi of the C, S, L and SL groups. (A)
Expression of four p-ERK and ERK proteins in the C, S, L and SL groups. (B) Statistical analysis results of
p-ERK/ERK. The data are presented as the means ± SDs.*p < 0.05. ••p < 0.01 compared to the cumulative group.
“C” stands for the control group, “S” stands for the 2.856 GHz microwave exposure group, “L” stands for the
1.5 GHz microwave exposure group, and “SL” stands for the 2.856 and 1.5 GHz cumulative exposure group.
major factors involved in the functional and structural changes were different. For the MWM, EEG changes
and p-AKT, p-CaMKII and p-CREB, The 2.856 GHz microwaves played major roles for the EEG changes, and
1.5 GHz microwave exposure played a major role in the TUNEL changes and p-ERK. The results indicated that
the mechanisms of accumulative microwave exposure were complicated. The 2.856 GHz and 1.5 GHz microwaves
may play different roles in the functional and structural changes of the accumulative exposure. The reasons for
this result might be related to the energy and penetration depth of the microwaves.
CREB is an important transcription factor that plays an important role in the processes of learning and
memory42–44. The phosphorylation of CREB affects the expression or activation of genes and the overall behav-
eurons45. Long-term facilitation alters CREB phosphorylation by increasing cAMP, which leads to the
ior of n
expression of related genes and ultimately results in changes in functional protein e xpression46. Multiple signal-
ing pathways, such as the PI3K/AKT pathway21, Ca2+/CaMKII pathway47 and MEK/ERK pathway20 regulate the
phosphorylation of CREB. In this study, the key signaling molecules in these signaling pathways were detected.
We found that the phosphorylation levels of key signaling molecules, such as p-AKT/AKT, p-CaMK II/CaMKII,
p-CREB/CREB and p-ERK/ERK, were downregulated after microwave radiation.
The levels of p-AKT, p-CaMK II and p-ERK are closely related to synaptic functions. Lee et al. reported that
activation of the PI3K/Akt/mTOR pathway promoted dendritic spine formation and excitatory synapse develop-
ment in hippocampal neurons48,49. Zhao et al.50 found that decreased AKT phosphorylation contributed to hip-
pocampal neuronal apoptosis in rats. The decreased p-AKT level after microwave exposure in the present study
might be related to microwave-induced neuronal apoptosis. Mohajerani et al. found that the activated MAPK/
ERK pathway led to transcriptional regulation and new protein synthesis in postsynaptic n eurons51. Curtis et al.
found that genes regulated by CREB or other transcription factor targets of the CaMK and ERK pathways medi-
ated important adaptive responses to changes in synaptic activity, such as changes in synaptic strength and the
regulation of neuronal survival and death52. Therefore, we concluded that the decreased p-AKT/AKT, p-CaMKII/
CaMKII and p-ERK/ERK levels resulted in a decrease in synaptic function and learning and memory functions.
The decreased p-CREB/CREB levels might be the result of the inhibition of these three pathways.
In terms of the molecular level, differences in the expression of p-CaMKII/CaMKII between 2.856 GHz and
1.5 GHz were found, which suggests the different sensitivities of the signal pathways to microwaves with differ-
ent frequencies. Interaction effects of the two microwave frequencies were found for the changes in p-CREB/
CREB. The accumulative exposure of the 2.856 GHz and 1.5 GHz microwaves aggravated the downregulation
of p-CREB/CREB. Previous studies used combined exposure to communication microwaves (849 MHz and
1.95 GHz), but none of these studies analyzed the interaction effects53–56.
The present study provides new insights into the biological effects of microwave radiation. Microwaves affect
multiple metabolic pathways, and the frequency played an important role in the biological effects. The results
related to frequency-dependent effects suggested that microwave safety standards should be based on the fre-
quency. Past safety standards were primarily based on radiation power, and radiation frequency was defined only
in a rough r ange57. The interaction effects suggested that the biological effects caused by electromagnetic waves
were much more complicated than previously thought. More attention should be given to this field.
Received: 21 December 2020; Accepted: 26 May 2021
Scientific Reports | (2021) 11:12348 | https://doi.org/10.1038/s41598-021-91622-4 8
Vol:.(1234567890)www.nature.com/scientificreports/
References
1. Kesari, K. K., Siddiqui, M. H., Meena, R., Verma, H. N. & Kumar, S. Cell phone radiation exposure on brain and associated biologi-
cal systems. Indian J. Exp. Biol. 51, 187–200 (2013).
2. Wang, H. et al. Impairment of long-term potentiation induction is essential for the disruption of spatial memory after microwave
exposure. Int. J. Radiat. Biol. 89, 1100–1107. https://doi.org/10.3109/09553002.2013.817701 (2013).
3. Pall, M. L. Microwave frequency electromagnetic fields (EMFs) produce widespread neuropsychiatric effects including depression.
J. Chem. Neuroanat. 75, 43–51. https://doi.org/10.1016/j.jchemneu.2015.08.001 (2016).
4. Qiao, S. et al. Reduction of phosphorylated synapsin I (ser-553) leads to spatial memory impairment by attenuating GABA release
after microwave exposure in Wistar rats. PLoS ONE 9, e95503. https://doi.org/10.1371/journal.pone.0095503 (2014).
5. Wang, H. et al. Long term impairment of cognitive functions and alterations of NMDAR subunits after continuous microwave
exposure. Physiol. Behav. 181, 1–9. https://doi.org/10.1016/j.physbeh.2017.08.022 (2017).
6. Vorhees, C. V. & Williams, M. T. Morris water maze: procedures for assessing spatial and related forms of learning and memory.
Nat. Protoc. 1, 848–858 (2006).
7. Kumlin, T. et al. Mobile phone radiation and the developing brain: Behavioral and morphological effects in juvenile rats. Radiat.
Res. 168, 471–479 (2007).
8. Wang, B. & Lai, H. Acute exposure to pulsed 2450-MHz microwaves affects water-maze performance of rats. Bioelectromagnetics
21, 52–56 (2000).
9. Sharma, A., Sisodia, R., Bhatnagar, D. & Saxena, V. K. Spatial memory and learning performance and its relationship to protein
synthesis of Swiss albino mice exposed to 10 GHz microwaves. Int. J. Radiat. Biol. 90, 29 (2014).
10. Hinrikus, H., Parts, M., Lass, J. & Tuulik, V. Changes in human EEG caused by low level modulated microwave stimulation. Bio-
electromagnetics 25, 431–440. https://doi.org/10.1002/bem.20010 (2004).
11. Li, H. J. et al. Alterations of cognitive function and 5-HT system in rats after long term microwave exposure. Physiol. Behav. 140,
236–246. https://doi.org/10.1016/j.physbeh.2014.12.039 (2015).
12. Suhhova, A., Bachmann, M., Karai, D., Lass, J. & Hinrikus, H. Effect of microwave radiation on human EEG at two different levels
of exposure. Bioelectromagnetics 34, 264–274. https://doi.org/10.1002/bem.21772 (2013).
13. Zuo, H. et al. Neural cell apoptosis induced by microwave exposure through mitochondria-dependent caspase-3 pathway. Int. J.
Med. Sci. 11, 426–435. https://doi.org/10.7150/ijms.6540 (2014).
14. Cho, W. H. & Han, J. S. Differences in the flexibility of switching learning strategies and CREB phosphorylation levels in prefrontal
cortex, Dorsal Striatum and Hippocampus in two inbred strains of mice. Front. Behav. Neurosci. 10, 176. https://doi.org/10.3389/
fnbeh.2016.00176 (2016).
15. Pulimood, N. S., Rodrigues, W. D. S. J., Atkinson, D. A., Mooney, S. M. & Medina, A. E. The role of CREB, SRF, and MEF2 in
activity-dependent neuronal plasticity in the visual cortex. J. Neurosci. 37, 6628–6637. https://doi.org/10.1523/JNEUROSCI.0766-
17.2017 (2017).
16. Wang, L. et al. Regulation of CREB functions by phosphorylation and sumoylation in nervous and visual systems. Curr. Mol. Med.
16, 885–892. https://doi.org/10.2174/1566524016666161223110106 (2017).
17. Gascon, S., Ortega, F. & Gotz, M. Transient CREB-mediated transcription is key in direct neuronal reprogramming. Neurogenesis
4, e1285383. https://doi.org/10.1080/23262133.2017.1285383 (2017).
18. Landeira, B. S. et al. Activity-independent effects of CREB on neuronal survival and differentiation during mouse cerebral cortex
development. Cereb. Cortex https://doi.org/10.1093/cercor/bhw387 (2016).
19. Bao, Y. et al. The Neuroprotective effect of liraglutide is mediated by glucagon-like peptide 1 receptor-mediated activation of cAMP/
PKA/CREB pathway. Cell. Physiol. Biochem. 36, 2366–2378. https://doi.org/10.1159/000430199 (2015).
20. Jeong, S. G. & Cho, G. W. The tubulin deacetylase sirtuin-2 regulates neuronal differentiation through the ERK/CREB signaling
pathway. Biochem. Biophys. Res. Commun. 482, 182–187. https://doi.org/10.1016/j.bbrc.2016.11.031 (2017).
21. Liu, X., Wang, X. & Lu, J. Tenuifoliside A promotes neurite outgrowth in PC12 cells via the PI3K/AKT and MEK/ERK/CREB
signaling pathways. Mol. Med. Rep. 12, 7637–7642. https://doi.org/10.3892/mmr.2015.4397 (2015).
22. Xi, Y. D. et al. Genistein inhibits Abeta25-35-induced synaptic toxicity and regulates CaMKII/CREB pathway in SH-SY5Y cells.
Cell. Mol. Neurobiol. 36, 1151–1159. https://doi.org/10.1007/s10571-015-0311-6 (2016).
23. Zhao, L. et al. Upregulation of HIF-1alpha via activation of ERK and PI3K pathway mediated protective response to microwave-
induced mitochondrial injury in neuron-like cells. Mol. Neurobiol. 50, 1024–1034. https://doi.org/10.1007/s12035-014-8667-z
(2014).
24. Caraglia, M. et al. Electromagnetic fields at mobile phone frequency induce apoptosis and inactivation of the multi-chaperone
complex in human epidermoid cancer cells. J. Cell. Physiol. 204, 539–548. https://doi.org/10.1002/jcp.20327 (2005).
25. Li, P. et al. N-Cadherin-mediated activation of PI3K/Akt-GSK-3beta signaling attenuates nucleus pulposus cell apoptosis under
high-magnitude compression. Cell. Physiol. Biochem. 44, 229–239. https://doi.org/10.1159/000484649 (2017).
26. Xiong, L. et al. Microwave exposure impairs synaptic plasticity in the rat Hippocampus and PC12 cells through over-activation of
the NMDA receptor signaling pathway. Biomed. Environ. Sci. 28, 13–24. https://doi.org/10.3967/bes2015.002 (2015).
27. Kapri-Pardes, E. et al. Activation of signaling cascades by weak extremely low frequency electromagnetic fields. Cell. Physiol.
Biochem. 43, 1. https://doi.org/10.1159/000481977 (2017).
28. Tan, S. et al. Study on dose-dependent, frequency-dependent, and accumulative effects of 1.5 GHz and 2.856 GHz microwave on
cognitive functions in Wistar rats. Sci. Rep. 7, 10781. https://doi.org/10.1038/s41598-017-11420-9 (2017).
29. D’Hooge, R. & De Deyn, P. P. Applications of the Morris water maze in the study of learning and memory. Brain Res. Rev. 36, 60–90
(2001).
30. Inoue, S. et al. Microwave irradiation induces neurite outgrowth in PC12m3 cells via the p38 mitogen-activated protein kinase
pathway. Neurosci. Lett. 432, 35–39. https://doi.org/10.1016/j.neulet.2007.12.002 (2008).
31. Shahin, S., Banerjee, S., Swarup, V., Singh, S. P. & Chaturvedi, C. M. 2.45 GHz Microwave radiation impairs hippocampal learn-
ing and spatial memory: Involvement of local stress mechanism induced suppression of iGluR/ERK/CREB signaling. Toxicol. Sci.
https://doi.org/10.1093/toxsci/kfx221 (2017).
32. Ning, H. et al. Effects of haloperidol, olanzapine, ziprasidone, and PHA-543613 on spatial learning and memory in the Morris
water maze test in naive and MK-801-treated mice. Brain Behav. 7, e00764. https://doi.org/10.1002/brb3.764 (2017).
33. Ahmadi, M., Rajaei, Z., Hadjzadeh, M. A., Nemati, H. & Hosseini, M. Crocin improves spatial learning and memory deficits in the
Morris water maze via attenuating cortical oxidative damage in diabetic rats. Neurosci. Lett. 642, 1–6. https://doi.org/10.1016/j.
neulet.2017.01.049 (2017).
34. Geist, P. A., Dulka, B. N., Barnes, A., Totty, M. & Datta, S. BNDF heterozygosity is associated with memory deficits and alterations
in cortical and hippocampal EEG power. Behav. Brain Res. 332, 154–163. https://doi.org/10.1016/j.bbr.2017.05.039 (2017).
35. Wiegand, I. et al. EEG correlates of visual short-term memory as neuro-cognitive endophenotypes of ADHD. Neuropsychologia
85, 91–99. https://doi.org/10.1016/j.neuropsychologia.2016.03.011 (2016).
36. Han, Y., Wang, K., Jia, J. & Wu, W. Changes of EEG Spectra and Functional Connectivity during an Object-Location Memory Task
in Alzheimer’s Disease. Front. Behav. Neurosci. 11, 107. https://doi.org/10.3389/fnbeh.2017.00107 (2017).
37. Vakalopoulos, C. The EEG as an index of neuromodulator balance in memory and mental illness. Front Neurosci 8, 63. https://doi.
org/10.3389/fnins.2014.00063 (2014).
Scientific Reports | (2021) 11:12348 | https://doi.org/10.1038/s41598-021-91622-4 9
Vol.:(0123456789)www.nature.com/scientificreports/
38. Thuroczy, G., Kubinyi, G., Bodo, M., Bakos, J. & Szabo, L. D. Simultaneous response of brain electrical activity (EEG) and cerebral
circulation (REG) to microwave exposure in rats. Rev. Environ. Health 10, 135–148 (1994).
39. Karamacoska, D., Barry, R. J. & Steiner, G. Z. Resting state intrinsic EEG impacts on go stimulus-response processes. Psychophysiol-
ogy 54, 894–903. https://doi.org/10.1111/psyp.12851 (2017).
40. Wang, L. F. et al. Microwave-induced structural and functional injury of hippocampal and PC12 cells is accompanied by abnormal
changes in the NMDAR-PSD95-CaMKII pathway. Pathobiology 82, 181–194. https://doi.org/10.1159/000398803 (2015).
41. Zhong, Y. et al. PKA-CREB-BDNF signaling pathway mediates propofol-induced long-term learning and memory impairment in
hippocampus of rats. Brain Res. https://doi.org/10.1016/j.brainres.2018.04.022 (2018).
42. Zheng, C. X. et al. Electroacupuncture Ameliorates Learning and Memory and Improves Synaptic Plasticity via Activation of the
PKA/CREB Signaling Pathway in Cerebral Hypoperfusion. Evid.-Based Complement. Altern. Med. eCAM 2016, 7893710. https://
doi.org/10.1155/2016/7893710 (2016).
43. Rajan, K. E., Thangaleela, S. & Balasundaram, C. Spatial learning associated with stimulus response in goldfish Carassius auratus:
relationship to activation of CREB signalling. Fish Physiol. Biochem. 41, 685–694. https://doi.org/10.1007/s10695-015-0038-9
(2015).
44. Middei, S. et al. CREB is necessary for synaptic maintenance and learning-induced changes of the AMPA receptor GluA1 subunit.
Hippocampus 23, 488–499. https://doi.org/10.1002/hipo.22108 (2013).
45. Deisseroth, K., Bito, H. & Tsien, R. W. Signaling from synapse to nucleus: postsynaptic CREB phosphorylation during multiple
forms of hippocampal synaptic plasticity. Neuron 16, 89–101 (1996).
46. Yin, J. C. & Tully, T. CREB and the formation of long-term memory. Curr. Opin. Neurobiol. 6, 264–268 (1996).
47. Guo, Y., Lv, Q., Zou, X. Q., Yan, Z. X. & Yan, Y. X. Mechanical strain regulates osteoblast proliferation through Ca2+-CaMK-CREB
signal pathway. Chin. Med. Sci. J. Chung-kuo i hsueh k’o hsueh tsa chih 31, 100–106 (2016).
48. Xuan, F. & Jian, J. Epigallocatechin gallate exerts protective effects against myocardial ischemia/reperfusion injury through the
PI3K/Akt pathway-mediated inhibition of apoptosis and the restoration of the autophagic flux. Int. J. Mol. Med. 38, 328–336.
https://doi.org/10.3892/ijmm.2016.2615 (2016).
49. Lee, C. C., Huang, C. C. & Hsu, K. S. Insulin promotes dendritic spine and synapse formation by the PI3K/Akt/mTOR and Rac1
signaling pathways. Neuropharmacology 61, 867–879. https://doi.org/10.1016/j.neuropharm.2011.06.003 (2011).
50. Zhao, Y. et al. Reduced AKT phosphorylation contributes to endoplasmic reticulum stress-mediated hippocampal neuronal
apoptosis in rat recurrent febrile seizure. Life Sci. 153, 153–162. https://doi.org/10.1016/j.lfs.2016.04.008 (2016).
51. Mohajerani, M. H., Sivakumaran, S., Zacchi, P., Aguilera, P. & Cherubini, E. Correlated network activity enhances synaptic effi-
cacy via BDNF and the ERK pathway at immature CA3 CA1 connections in the hippocampus. Proc. Natl. Acad. Sci. USA 104,
13176–13181. https://doi.org/10.1073/pnas.0704533104 (2007).
52. Curtis, J. & Finkbeiner, S. Sending signals from the synapse to the nucleus: possible roles for CaMK, Ras/ERK, and SAPK pathways
in the regulation of synaptic plasticity and neuronal growth. J. Neurosci. Res. 58, 88–95 (1999).
53. Lee, H. J. et al. Lymphoma development of simultaneously combined exposure to two radiofrequency signals in AKR/J mice.
Bioelectromagnetics 32, 485–492. https://doi.org/10.1002/bem.20655 (2011).
54. Lee, H. J. et al. The effects of simultaneous combined exposure to CDMA and WCDMA electromagnetic fields on rat testicular
function. Bioelectromagnetics 33, 356–364. https://doi.org/10.1002/bem.20715 (2012).
55. Kim, H. N. et al. Analysis of the cellular stress response in MCF10A cells exposed to combined radio frequency radiation. J. Radiat.
Res. 53, 176–183 (2012).
56. Jin, Y. B. et al. Effects of simultaneous combined exposure to CDMA and WCDMA electromagnetic fields on serum hormone
levels in rats. J. Radiat. Res. 54, 430–437. https://doi.org/10.1093/jrr/rrs120 (2013).
57. Patrick Reilly, J. Human exposure standards in the frequency range 1 Hz To 100 kHz: the case for adoption of the IEEE standard.
Health Phys. 107, 343–350. https://doi.org/10.1097/HP.0000000000000112 (2014).
Acknowledgements
This study was financed by the National Natural Science Foundation of China (Grant 61401497) and the National
Natural Science Foundation of China (Grant 31570847).
Author contributions
S.T., H.W. and R.P. conceived the experiments and designed the study. H.Z. conducted the microwave irradia-
tion. X.X. conducted the EEG and image analysis. L.Z., J.Z., B.Y., H.W., Y.H., J.D. and Y.G. analyzed the MWM,
EEG, and WB data. S.T. wrote the manuscript.
Competing interests
The authors declare no competing interests.
Additional information
Correspondence and requests for materials should be addressed to H.W. or R.P.
Reprints and permissions information is available at www.nature.com/reprints.
Publisher’s note Springer Nature remains neutral with regard to jurisdictional claims in published maps and
institutional affiliations.
Open Access This article is licensed under a Creative Commons Attribution 4.0 International
License, which permits use, sharing, adaptation, distribution and reproduction in any medium or
format, as long as you give appropriate credit to the original author(s) and the source, provide a link to the
Creative Commons licence, and indicate if changes were made. The images or other third party material in this
article are included in the article’s Creative Commons licence, unless indicated otherwise in a credit line to the
material. If material is not included in the article’s Creative Commons licence and your intended use is not
permitted by statutory regulation or exceeds the permitted use, you will need to obtain permission directly from
the copyright holder. To view a copy of this licence, visit http://creativecommons.org/licenses/by/4.0/.
© The Author(s) 2021
Scientific Reports | (2021) 11:12348 | https://doi.org/10.1038/s41598-021-91622-4 10
Vol:.(1234567890)You can also read