Reduced nest development of reared Bombus terrestris within apiary dense human modified landscapes - Nature
←
→
Page content transcription
If your browser does not render page correctly, please read the page content below
www.nature.com/scientificreports
OPEN Reduced nest development
of reared Bombus terrestris
within apiary dense
human‑modified landscapes
Ivan Meeus 1,3*, Laurian Parmentier 1,3*
, Matti Pisman 1
, Dirk C. de Graaf 2
&
Guy Smagghe 1
Wild bees are in decline on a local to global scale. The presence of managed honey bees can lead
to competition for resources with wild bee species, which has not been investigated so far for
human-modified landscapes. In this study we assess if managed honey bee hive density influence
nest development (biomass) of bumble bees, an important trait affecting fitness. We hypothesize
that domesticated honey bees can negatively affect Bombus terrestris nest development in human-
modified landscapes. In Flanders, Belgium, where such landscapes are dominantly present, we
selected 11 locations with landscape metrics ranging from urban to agricultural. The bee hive locations
were mapped and each location contained one apiary dense (AD) and one apiary sparse (AS) study
site (mean density of 7.6 ± 5.7 managed honey bee hives per km2 in AD sites). We assessed the effect
of apiary density on the reproduction of reared B. terrestris nests. Reared B. terrestris nests had more
biomass increase over 8 weeks in apiary sparse (AS) sites compared to nests located in apiary dense
(AD) sites. This effect was mainly visible in urban locations, where nest in AS sites have 99.25 ± 60.99 g
more biomass increase compared to nest in urban AD sites. Additionally, we found that managed
bumble bee nests had higher biomass increase in urban locations. We conclude that the density of bee
hives is a factor to consider in regard to interspecific competition between domesticated honey bees
and bumble bees.
Pollination is a key ecosystem function, as 87.5% of all wild plant species1 and 75% of the leading global food
crops rely on animal pollination, accounting for 35% of the total global production v olumes2. Despite their
importance, wild insect pollinators are declining on a local to global s cale3–6. The potential reduced pollination
service in crops after losses of wild bees can be counteracted through integrated crop pollination (ICP), which
supplements wild bee pollination services using managed pollinators. The managed honey bee (Apis mellifera)
is an essential component h erein7. However, at the same time managed honey bees can compete with wild bees
due to niche o verlap8,9, potentially collecting or even depleting floral resources that would otherwise be avail-
able for wild b ees10,11.
In order to conserve wild pollinator biodiversity and its associated pollination s ervices12 it is important to
determine if competition between managed honey bees and wild bees is present. Thomson13,14 described a cor-
relation between an increase of feral A. mellifera and a decline of wild bumble bees in natural habitats; yet only
after incorporation of the abiotic factor drought, as it severely influenced temporal flower composition. While
in lowland pasture/arable land of Scotland the worker mean thorax widths of four bumble bee species (thorax
widths is here an indicator of resource availability during the larval stage) was lower in sample sites where honey
bees were present compared to sites were they were absent15.
Recent studies on the interaction of wild bees and honey bees focused on natural environments with honey
ees16 and on environments with insect pollinated crops where managed honey bees were used as
bees as feral b
17,18
pollinators . In the latter, managed honey bee hives are introduced in the crop field, such as rapeseed, and
the managed honey bees interact with wild pollinators both within the fi eld19 and sometimes in semi-natural
1
Department of Plants and Crops, Faculty of Bioscience Engineering, Ghent University, Coupure Links 653,
9000 Ghent, Belgium. 2Laboratory of Molecular Entomology and Bee Pathology, Faculty of Sciences, Ghent
University, Krijgslaan 281, S2, 9000 Ghent, Belgium. 3These authors contributed equally: Ivan Meeus and Laurian
Parmentier. *email: ivan.meeus@UGent.be; laurian.parmentier@ugent.be
Scientific Reports | (2021) 11:3755 | https://doi.org/10.1038/s41598-021-82540-6 1
Vol.:(0123456789)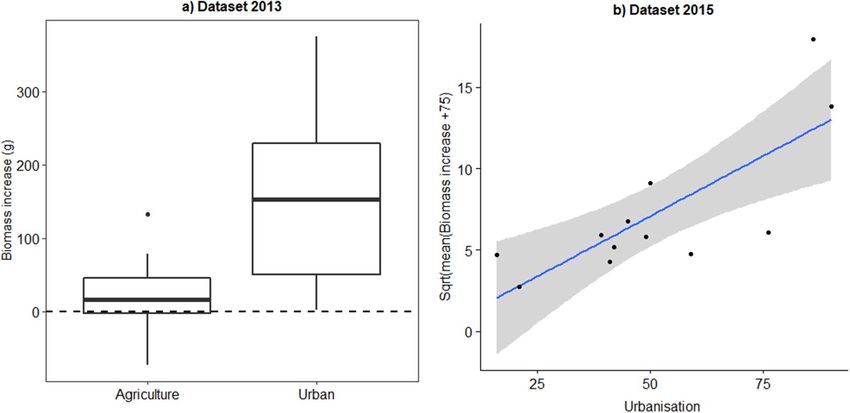
www.nature.com/scientificreports/
No.
managed
honey bee
hives Honey bee count
Year Location AD AS AD AS
G1 4 0 nd nd
G2 21 0 31 0
Roe 19 0 52 0
2013
Zing 3 0 11 1
Waar 7 0 15 1
Hore 8 0 28 8
G2 12 0 61 52 8 18
HB 4 0 7 71 3 31
PM 40 3 132 130 20 22
2015
MG 7 0 11 59 2 27
SB 8 0 18 21 6 6
W 16 0 16 103 6 23
Table 1. Overview of all the locations and the number of managed honey bee hives and honey bees specimens
counted in apiary dense (AD) and apiary sparse (AS) study sites. nd = not determined (pan trapping failed at
this location); honey bee counts are performed by pan trapping (sum of three pan trap sets over eight weeks
per study site); underlined number are counts by transect walks (sum of three 50 m transects per study site).
elements around the crop field where they can influence natural plant-wild pollinator interactions20,21. However,
the latter situations only describe specific cases where high densities (> 2 beehives/acre) of managed honey bees
are used in order to perform crop pollination services. Yet, for the most common beekeeping practices, i.e. honey
production, beekeepers will try to have a quality location where the hive can develop well, and thus avoid placing
large densities of hives in one location.
Intra- and interspecific competition between bees depends on the limiting resource and the competition
coefficient, where competition becomes apparent as the population sizes of the competing species approaches
the carrying capacity of the habitat22. It can be expected that under common beekeeping practices, managed
honey bee hive density is diluted over a larger area, resulting in reduced competitive interactions. However, no
studies so far have addressed the potential competition between managed honey bees and wild bees under these
densities in human-modified landscapes where honeybees are native bee species. Yet, determining the impact
of managed honey bee competition in human-modified environments is important as these are increasing with
the expansion of the human population worldwide23.
In this study, we want to assess whether moderate managed honey bee hive density has a negative impact
on bumble bee colonies in human-modified landscapes such as Flanders, Belgium. We opted for a coupled
study design of paired study sites within a same landscape, but with different densities of managed honey bee
hives. We hypothesize that in the areas with fewer managed honey bees a better colony build-up of wild bees
will be seen. Hereto, we followed nest development of artificially placed reared Bombus terrestris colonies in the
paired apiary dense (AD) and apiary sparse (AS) study sites. The carrying capacity of the landscape to support
managed honey bees and sympatric wild bees is a factor to consider. This is determined by spatial variation of
landscapes and flower availability on a local and broader s cale24,25. This aspect is included by selecting a range
of urban to rural landscapes. We included both landscape types as their impact for bees can differ due to the
relative importance of floral and nesting resources a vailable26, with urban landscapes being supportive for B.
terrestris nest development27.
Material and methods
Coupled design of locations with apiary dense (AD) and apiary sparse (AS) sites. Study loca-
tions are located in Flanders (Belgium) and each location contains one apiary dense (AD) and one apiary sparse
(AS) site, with a distance of 1.5 ± 0.1 km between the centres of the AS and AD study sites. This distance had
two rationale. Honey bee foraging distance, depending on landscape complexity and flower patch rewards, can
exceed 1.5 kms28. Yet the probability of flower visitation decreases non-linearly with distance from the hive, with
a large majority of the foraging trips within a radius of 750 m, based on waggle dance decoding of honey bees
in such landscapes (average distances 633–740 m)29–31. Thus, we aimed to achieve a large distance between sites
to reduce the probability of spillover from the apiary dense sites to the apiary sparse sites. In contrast, we aimed
to keep the distance small enough to assure equal landscape metrics between paired sites. We acknowledge that
some of the managed honey bees from the AD sites will forage at the AS sites, but that their total abundance will
be lower (as shown in Table 1).
Counting of managed honey bee hives and honey bee specimens. Hive counts were based on
registrations of apiaries at the Federal Agency for the Safety of the Food Chain. This list was used to generate a
map of study sites presumed to contain many apiaries. In an area with a radius of three kilometres we contacted
Scientific Reports | (2021) 11:3755 | https://doi.org/10.1038/s41598-021-82540-6 2
Vol:.(1234567890)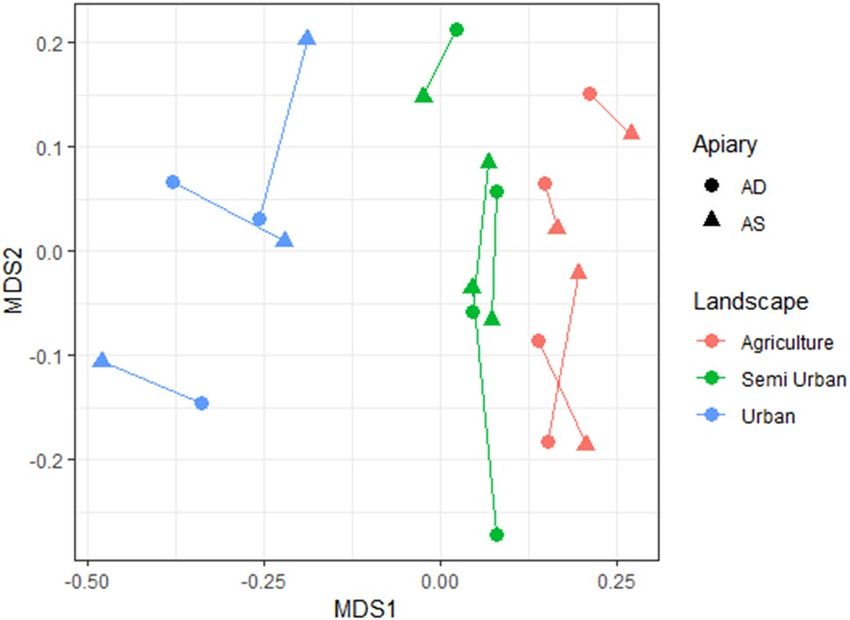
www.nature.com/scientificreports/
all registered beekeepers to obtain information on the amount of managed honey bee hives around central hives
chosen in all study sites, and walked around screening for any potential unregistered apiaries in their neighbour-
hood. Based on this map, we selected six locations in 2013 and six locations in 2015 which met our criteria. The
number of managed honey bee hives within a 750 m radius of the selected AD study sites ranged from 3 to 40
(or 1.7 to 22.6 hives/km2), and was always higher in the AD sites compared to the paired AS site (see Table 1).
These managed honey bee hive densities are comparable in terms of European hive density a verages32. Over all
experiments, the AD sites have a mean density of 7.6 ± 5.7 bee hives per km2, while in Belgium the mean number
of managed honey bee hives per km2 is 3.632.
Honey bee specimen counts are based on pan trapping (2013 and 2015) and transect walks (2015). Within
each study site we placed three sets of pan traps (colored funnels) at a distance of 100 ± 50 m from the centre of
the study site. Each set contained three pan traps, with the following three colours: white, yellow and b lue33. The
distance between the pan traps within one set ranged from 3 to 5 m based on earlier experience and l iterature34.
Each set was placed at a certain height, ranging from 0 to 0.8 m, depending on the dominant vegetation height
present.
The pan traps (of 20 cm diameter) were filled with 400 ml of water, a drop of detergent with 10% formaldehyde
solution to avoid putrefaction. The total survey time was 8 weeks (half of May 2015 until half July 2015) and pan
traps were checked and emptied at intervals of 5 ± 2 days. The pan traps were refilled if needed. The collected
specimens were temporarily frozen in − 20 °C fridge and honey bees were identified35. We recorded the sum of
all counted honey bees per site.
In 2015 honey bee abundance was estimated by transect walks. Bees were monitored in three 50 m transects
per study site. A random location was chosen within a radius of 100 ± 50 m from the centre of the study site,
during dry, warm (> 15 °C) and sunny conditions between 9:30 and 18.00 h. Each transect was visited for one
hour, separated over three time periods in May, June and July. Thus, we monitored 9 h over 3 transects per study
site (total 108 h for all locations). Transects encompassed gardens and road verges chosen to represent similar
spatial heterogeneity and comparable landscape elements within one location. Vegetation was recorded to assure
that local vegetation community was similar between coupled sites (as shown in supporting information S1,
giving details on the flowers presence at each transect). Paired sites were sampled on the same day. We used the
total count over the 3 × 50 m walks as a measure for honey bee abundance.
Landscape metrics of the sites within the different locations. A landscape analysis was performed
within a radius of 750 m of all bumble bee hives. Land cover data was retrieved from the Biological Valuation
Map (BVM) of F landers36 and analysed in Q GIS37. BVM categories were grouped in six land cover categories,
based on the resources they provide for bees. The following land cover categories were identified: (1) “Semi-
natural positive”, encompassing all semi-natural habitats (grasslands, woodlands, linear elements…) which can
provide food or nesting substrate for wild bees, (2) “Semi-natural neutral”, all semi-natural elements that do
not provide food or nesting (e.g. ponds, temporary species-poor grasslands…), (3) “Urban”, defined as the per-
centage of build-up, industrial areas and roads, (4) “Acres”, encompassing all agricultural areas which produce
crops that do not rely on pollinators (grain, potatoes, maize, beets,…), (5) Low stem orchards, describing all
plantations of low stem fruit trees (e.g. apples, pear, sweet cherry,…), characterized by an intensive management
and (6) high stem orchards, describing all fields containing high stem fruit trees, characterized by an extensive
management.
We selected locations with a variation of different land covers, while the variation within a location (the sites)
is kept minimal. This to assure that the ability of sites, to support wild bumble bees, within a location is equal.
To verify this we transformed the land cover data into a similarity matrix based upon Euclidean-distance and a
Permutational multivariate analysis of variance (PERMANOVA) was performed with the adonis function within
the R package vegan38. We tested if the land cover matrix was different in relation to the factor apiary (two levels,
AS and AD) and the factor landscape type (three levels, agriculture, semi urban and urban).
Reduced levels of urbanisation were mainly coupled with an increase of agricultural land cover (Supporting
information S2). In 2013 we selected six locations: three urban locations (urbanisation range: 86–99%) and three
agricultural locations dominated by agricultural practises (urbanisation range: 13–26%). In 2015 we selected
six locations with a gradient of urbanisation present (urbanisation range: 16–90%), one location was the same
as selected in 2013.
Bombus terrestris nest development. Standardized bumble bee nests (B. terrestris) (n = 72) were
obtained from a commercial rearing programme (Biobest, Westerlo, Belgium). Each nest contained one queen
and an average of 45 workers (± 19.9 SD). As presence of parasites and viruses could potentially influence nest
development, we screened a subset of 24 nests (in 2013) before they were placed in the field. We screened for
Crithidia spp. and Apicistis bombi39, Nosema spp.40; and viruses (deformed wing virus (DWV), sacbrood virus
(SBV), black queen cell virus (BQCV) and viruses of the acute-Kashmir-Israeli-complex (AKI) by M LPA41.
DNA and RNA extract were performed on pools of 10 bumble bees per nest. No pathogens were detected; this
does not ensure complete freedom from disease, but excludes that pathogens are a major contributing factor.
Nests were put into a polystyrene box for protection against cold and wet weather conditions and placed
with their entrance to the e ast42. In 2013 we placed three bumble bee nests in the centre of each study site (in
total 36 nests). In 2015 we placed three bumble bee nests per study site at a radius of 100 ± 50 m from the centre.
In standard conditions these nests contain sugar containers, these were removed before the nests were placed
outside, also access pollen (added for transport to the lab) was removed.
The development of the nests was followed over a period of six weeks (before new offspring emerge, i.e. drones
and daughter queens)43. Biomass increase (mass difference after six week of the plastic cage, containing the
Scientific Reports | (2021) 11:3755 | https://doi.org/10.1038/s41598-021-82540-6 3
Vol.:(0123456789)www.nature.com/scientificreports/
Figure 1. Multidimensional scaling was used to visualize the land cover dissimilarity matrix (calculation
based on Euclidean distance). Circles represent AD (apiary dense) site and overlap with AS (apiary sparse) sites
(rectangles) and paired sites are connected (showing that paired sites have similar land covers). The landscape
types are: urban = blue, agricultural = red, and semi-urban = green.
brood, workers, foundress queen and nest debris. The sugar container is not included) was chosen as a measure
of bumble bee nest development42. As well-developed nest are able to produce more new queens (gynes) at the
end of the season44, nest size can be seen as a proxy for reproductive output and thus fitness.
Statistical analysis of nest development. The response variable, ‘biomass increase’ was treated as a
normal error distribution after a square root (x + 75) transformation. The + 75 was used to ensure that all neg-
ative values became positive. We used a linear mixed-effects model (R package lme4 version 1.1-1045) with
three fixed factors, being apiary density (levels = 2, AS and AD), landscape type (levels = 3, urban (urbanisation
86–99%), semi-urban (39–76%) and agricultural (13–26%), see supporting information S2 for landscape catego-
risation) and year (levels = 2, 2013 and 2015)). We also used a second linear mixed model, where we substituted
the categorical value “landscape type” with the percentage of urbanisation as covariate, to validate whether our
defined sub-categories of landscape type had effect on the model outcome. In both models the random factor
site (levels = 22) was included, nested within location (Levels = 11; six in 2013 and six in 2015, of which one
location is the same). The effect of urbanisation and landscape type was integrated into the model to evaluate
possible landscape interaction effects, yet was not an initial study objective on itself. We included the interactions
apiary*year and apiary*type (categorical or continues). Dropping the interactions systematically gave slightly
improved Akaike Information Criterion (AIC) and were omitted from the final model.
We used a one Sample t-test to determine if the difference in mean biomass increase per location (i.e. sum of
biomass increase in AS sites minus sum of biomass increase in AD sites) is different from zero.
We calculates the effect size Cohen’s d to visualize mean increase of biomass is AS sites compared to AD s ites46.
Here the difference between two means is divided by a pooled standard deviation (Sp ) or (meanAS − meanAD)/Sp.
Sp = (nAS − 1)sAS 2 + (n 2
AD − 1)sAD /(nAS + nAD − 2)
The Confidence interval (CI) is formulated as:
CI(d) = (nAS + nAD )/(nAS nAD ) + d 2 /2(nAS + nAD )
Results
Apiary density and land cover analysis. Sites in apiary-dense areas had more honey bees than sites in
apiary-scarce areas (Table 1). The differences in managed honey bee hive density indeed resulted in more honey
bees in AD sites compared to AS sites.
In Fig. 1 we show that our locations have a different landscape composition, based on a matrix of six land cov-
ers. The urbanisation % was used to create three groups, called landscape types (these are agricultural, semi urban
and urban locations). The landscape composition was different in the three landscape types (PERMANOVA;
F landscape type = 57.8; total df = 21; P = 0.01), while no difference was recorded within locations (factor AS versus
AD) (PERMANOVA; F apiary = 0.074; total df = 21; P = 0.87). We can conclude that the landscape composition is
randomized within locations, and is not correlated with the factor apiary (AS versus AD).
Bumble bee nest development: the factor apiary in different landscapes. Within each location
we calculated the Cohen’s d effect size for the parameter biomass increase. This standardized difference in mean
biomass increase between AS and AD site is visualized in Fig. 2). The confidence interval (CI) for five locations is
Scientific Reports | (2021) 11:3755 | https://doi.org/10.1038/s41598-021-82540-6 4
Vol:.(1234567890)www.nature.com/scientificreports/
Figure 2. Cohen’s d effect size are positive when the bumble bee nest biomass increase in apiary sparse (AS)
sites is greater than in apiary dense (AD) sites (a proxy for higher nest fitness). Circles represent the dataset
of 2013, while squares represent the dataset of 2015. The filled circles represent locations dominated with
agricultural landscape elements. In each location (n = 12; 6 in 2013 and 6 in 2015) we had 2 × 3 B. terrestris nests
(n = 72). Linear mixed-effects models are performed on individual data points (this is 3 nests per site, 2 sites (AD
and AS) per location, 6 locations per year and 2 years or 3*2*6*2 = 72 data points) and not on Cohen’s d effect
sizes, which are for visualization purpose only. To calculate the effect size between AS and AD sites we used the
Cohen’s d formula46.
Location Year Type Mean delta biomass (g)* (increase in AS sites)
G1 2013 Urban 36
G2 2013 Urban 164
Waar 2013 Agricultural − 59
Hore 2013 Agricultural −1
Zing 2013 Agricultural 33
Roe 2013 Urban 60
PM 2015 Semi urban −7
HB 2015 Semi urban 7
SB 2015 Semi urban 12
W 2015 Agricultural 14
MG 2015 Semi urban 84
G2 2015 Urban 137
Table 2. Mean biomass increase in AS sites. *Sum of biomass increase in AS sites minus sum of biomass
increase in AD sites; divided by the numbers of nests per site (3). AS = apiary sparse; AD = apiary dense.
above zero with effect sizes between 1.0 and 1.9. The CI in 6 locations overlaps with zero, of which 4 are positive.
In one location we have an effect size of − 1.1, which is not overlapping with zero. The actual delta mean biomass
increase in AS compared to AD sites is given in Table 2, which is significantly different from zero (One Sample
t-test = t = 2.21, df = 11, P = 0.05). This higher biomass increase is mainly observed in locations where bumble bee
nests developed well, like urban areas (Fig. 3).
In 2013 we had three urban locations and three agricultural locations, while in 2015 we had a gradient of
urbanisation. The two fixed factors improved the model significantly (landscape type: χ2 = 19.31, P < 1 × 10⁻⁴;
apiary χ2 = 4.42, P = 0.04). Similar results were obtained when urbanisation was included as a covariate instead
of a categorical factor (urbanisation: χ2 = 11.0, P < 1 × 10⁻³; apiary χ2 = 4.6, P = 0.03). Our results support the
hypothesis that bumble bee nest biomass is lower in AD sites.
Bumble bee nest development: the factor landscape. In 2013 we sampled two contrasting landscape
types: urban locations (urbanisation between 86 and 99%) and agricultural locations (urbanisation between 13
and 26%). We found that within agricultural landscapes only a minority of nests showed a biomass increase,
while in urban locations most nests had a good development (Fig. 4A). The factor landscape type (agricultural
vs. urban) significantly improved the mixed model (landscape type: χ2 = 11.8, P = 0.0006). In order to have more
nests with a biomass increase we selected a gradient of urbanisation in the 2015 experiment ranging from 16
to 90%. One location, with the highest urbanisation degree, was the same location as in 2013. The explanatory
variable urbanisation degree was again a significant factor in the model (urbanisation χ2 = 8.2, P = 0.004). As
visualized in Fig. 4B this relation is mainly driven by the four most extreme data points originating from two
Scientific Reports | (2021) 11:3755 | https://doi.org/10.1038/s41598-021-82540-6 5
Vol.:(0123456789)www.nature.com/scientificreports/
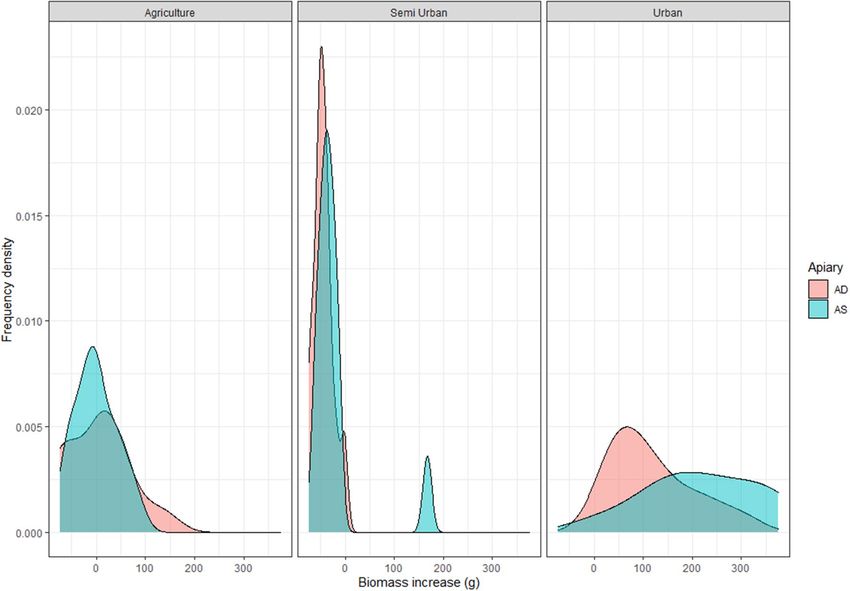
Figure 3. The frequency densities of the biomass increase of a bumble bee nests (in grams) in three different
landscape types (Agriculture; Semi Urban, and Urban). The blue–green graphs represent apiary sparse (AS)
sites, the red are apiary dense (AD) sites.
Figure 4. Biomass increase of bumble bee nests in relation to the land cover parameter urbanisation. (A) In
the dataset of 2013 we had 3 urban locations while 3 locations had an agricultural character (each locations had
6 nests, with a total of 36 nests). (B) In 2015 the % urbanisation in the 6 locations showed a gradual increase
(each locations had 6 nests, with a total of 36 nests). In both years urbanisation had a positive influence on the
development of Bombus terrestris nests.
Scientific Reports | (2021) 11:3755 | https://doi.org/10.1038/s41598-021-82540-6 6
Vol:.(1234567890)www.nature.com/scientificreports/
locations (one agricultural (< 25% urbanisation) and one urban location (> 75% urbanisation)), while the semi-
urban locations (N = 4) (35% < semi-urban < 65%) have an intermediate nest development.
Discussion
High densities of managed honey bees can potentially compete for floral resources with wild bee populations. In
this study, we measured nest development of reared B. terrestris as a proxy for fitness in order to assess whether
or not interspecific competition is present. We found that bumble bee nests placed in apiary dense sites had a
reduced nest development compared to those in apiary sparse landscapes. This observation shows that colony
performance suffers in areas with high densities of A. mellifera and suggest interspecific competition for floral
resources.
Previous studies have observed fewer wild bees in areas with high densities of honey bees, yet lower wild
bee counts can be a result of spatial displacement of wild bees19, and this must not necessarily lead to significant
reductions of wild bee populations. Spatial displacement turns into competitive displacement if both species
have identical niches47. Yet, bees have the ability to adjust their foraging preference in accordance to interspecific
competition on nectar r ewards48. We argue that these alternatives food source choices can also have a fitness
cost, and indeed we observed a lower nest development of reared B. terrestris in apiary dense (AD) sites. At least
for this specific bumble bee species niche differentiation is not prominent enough to attenuate interspecific
competitive interactions with honey bees. Indeed the focal species has an overlap in flower c hoice8,13, and food
resource depletion by honey bees can be expected for this species, especially in simplified landscapes49. But also
in the urban context bumble bee flower visitation rates are negatively correlated to honey bee hive densities50.
Bombus terrestris nests develop well within cities. In many locations (harbouring the two paired AS
and AD study sites) bumble bee nests showed no net biomass increase. Also Ellis, et al.51 reported that, mainly
in flower-poor environments, reared B. terrestris nests failed to develop. Within our setup, urban environments
are linked with good B. terrestris nest development, while in agricultural sites poor or even a drop in nest bio-
mass was observed (Fig. 2). Higher reproductive success in urban opposed to agricultural environments was
previously also observed using caught wild queens to initiate nest development27. The impact of urbanisation on
bumble bees is not a settled case; it is clear that destruction of natural habitat has a negative impact, yet a different
response of functional groups toward urbanisation has been r eported52,53. Furthermore the term urbanisation
is too broad to be directly used in relation to bee development, as it can cover many different aspects of urban
development54. A generalist pollinator, like B. terrestris can forage on typical garden flowers, which could lead
towards a food surplus in regions with few nests and therefore good development of the reared B. terrestris nests.
In general urbanisation is an important driver of local habitat loss, on the other hand it also provides refuges for
certain bee species and functional traits55.
The use of managed bumble bees compared to wild captured queens. The use of managed bum-
ble bee queens instead of capturing wild queens to evaluate bumble bee development in relation to the landscape
context has its pro and cons. The advantage is that the origin of the queens is fixed (and more standardized);
thereby increasing the power of the experiment (lower variation). Plus it is more easy to initiate high numbers
of nests. In contrast, it can be argued that the use of natural occurring bumble bee queens reflects more the true
nature of the insect27. Yet in this case the capturing location of the spring queen is an additional factor which
needs to be incorporated in the study design. This reduces the degrees of freedom, yet introduces a potentially
interesting factor to study.
The reduced bumble bee development in apiary dense sites is mainly apparent in urban landscapes. Here the
nests develop well, and work as a good measuring tool, as enough food resources were present to allow colony
growth and to observe differences in growth. It can be speculated that in regions with low or no biomass increase
the nests do not function as proper measuring tools to assess the effect of the landscape on its development.
Meaning below a certain threshold of food availability the colony is not able to increase its workforce anymore,
resulting in a negative spiral instead of a positive one. It is clear that negative growth will not result in the pro-
duction of gynes (the fitness parameter for which biomass increase is the proxy).
Future directions. A primary focus, to reduce interspecific competition between domesticated bees and
bumble bees, should be on determining the carrying capacity of human-modified environments within the
proximity of apiaries. Here the habitat composition in relation to managed honey bees and sympatric bumble
bees needs to be considered. Although we do not present data on the mechanism behind the competitive interac-
tions, it can be speculated that food resource competition is contributing, as pollen quality and quantity influx is
a good predictor of bumble bee nest d evelopment56. For habitat improvements the relationship between available
floral resources and bees is one of the key a spects24, aside from flower abundance also flower diversity will influ-
ence competitive interactions. In agricultural landscapes where the presence of bumble bees and solitary bees
are limited for pollination purposes, the density of managed honey bees is factor to consider when one wants to
supplement natural pollination services. In order to optimize the landscape in relation to different bee species a
good surveillance of apiary placement will be important. In addition, a landscape-dependent apiary placement,
which is based on floral (and nesting) resource availability, should also be beneficial to the beekeeping commu-
nity, as it should lead to stronger bee hives and thus less winter losses.
Data availability
Data files are public available, supporting information 3 contains raw data of nest development.
Scientific Reports | (2021) 11:3755 | https://doi.org/10.1038/s41598-021-82540-6 7
Vol.:(0123456789)www.nature.com/scientificreports/
Received: 20 February 2020; Accepted: 5 January 2021
References
1. Ollerton, J., Winfree, R. & Tarrant, S. How many flowering plants are pollinated by animals?. Oikos 120, 321–326. https://doi.org
/10.1111/j.1600-0706.2010.18644.x (2011).
2. Klein, A. M. et al. Importance of pollinators in changing landscapes for world crops. Proc. R. Soc. B Biol. Sci. 274, 303–313. https
://doi.org/10.1098/rspb.2006.3721 (2007).
3. Kremen, C., Williams, N. M. & Thorp, R. W. Crop pollination from native bees at risk from agricultural intensification. Proc. Natl.
Acad. Sci. U.S.A. 99, 16812–16816. https://doi.org/10.1073/pnas.262413599 (2002).
4. Potts, S. G. et al. Global pollinator declines: Trends, impacts and drivers. Trends Ecol. Evol. 25, 345–353. https://doi.org/10.1016/j.
tree.2010.01.007 (2010).
5. Tscharntke, T. et al. Landscape moderation of biodiversity patterns and processes—Eight hypotheses. Biol. Rev. 87, 661–685. https
://doi.org/10.1111/j.1469-185X.2011.00216.x (2012).
6. Winfree, R., Aguilar, R., Vazquez, D. P., LeBuhn, G. & Aizen, M. A. A meta-analysis of bees’ responses to anthropogenic disturbance.
Ecology 90, 2068–2076. https://doi.org/10.1890/08-1245.1 (2009).
7. Isaacs, R. et al. Integrated crop pollination: Combining strategies to ensure stable and sustainable yields of pollination-dependent
crops. Basic Appl. Ecol. 22, 44–60. https://doi.org/10.1016/j.baae.2017.07.003 (2017).
8. Steffan-Dewenter, I. & Tscharntke, T. Resource overlap and possible competition between honey bees and wild bees in central
Europe. Oecologia 122, 288–296. https://doi.org/10.1007/s004420050034 (2000).
9. Paini, D. R. & Roberts, J. D. Commercial honey bees (Apis mellifera) reduce the fecundity of an Australian native bee (Hylaeus
alcyoneus). Biol. Cons. 123, 103–112. https://doi.org/10.1016/j.biocon.2004.11.001 (2005).
10. Schaffer, W. M. et al. Competition for nectar between introduced honey bees and native North American bees and ants. Ecology
64, 564–577. https://doi.org/10.2307/1939976 (1983).
11. Dupont, Y. L., Hansen, D. M., Valido, A. & Olesen, J. M. Impact of introduced honey bees on native pollination interactions of the
endemic Echium wildpretii (Boraginaceae) on Tenerife, Canary Islands. Biol. Cons. 118, 301–311. https://doi.org/10.1016/j.bioco
n.2003.09.010 (2004).
12. Garibaldi, L. A. et al. Wild pollinators enhance fruit set of crops regardless of honey bee abundance. Science 339, 1608–1611. https
://doi.org/10.1126/science.1230200 (2013).
13. Thomson, D. M. Local bumble bee decline linked to recovery of honey bees, drought effects on floral resources. Ecol. Lett. 19,
1247–1255. https://doi.org/10.1111/ele.12659 (2016).
14. Thomson, D. Competitive interactions between the invasive European honey bee and native bumble bees. Ecology 85, 458–470.
https://doi.org/10.1890/02-0626 (2004).
15. Goulson, D. & Sparrow, K. Evidence for competition between honeybees and bumblebees; effects on bumblebee worker size. J.
Insect. Conserv. 13, 177–181. https://doi.org/10.1007/s10841-008-9140-y (2009).
16. Paini, D. R. Impact of the introduced honey bee (Apis mellifera) (Hymenoptera : Apidae) on native bees: A review. Austral. Ecol.
29, 399–407. https://doi.org/10.1111/j.1442-9993.2004.01376.x (2004).
17. Gross, C. L. The effect of introduced honeybees on native bee visitation and fruit-set in Dillwynia juniperina (Fabaceae) in a
fragmented ecosystem. Biol. Cons. 102, 89–95. https://doi.org/10.1016/s0006-3207(01)00088-x (2001).
18. Nielsen, A., Reitan, T., Rinvoll, A. W. & Brysting, A. K. Effects of competition and climate on a crop pollinator community. Agric.
Ecosyst. Environ. 246, 253–260. https://doi.org/10.1016/j.agee.2017.06.006 (2017).
19. Lindström, S. A. M., Herbertssön, L., Rundlof, M., Bommarco, R. & Smith, H. G. Experimental evidence that honeybees depress
wild insect densities in a flowering crop. Proc. R. Soc. B Biol. Sci. 283, 8. https://doi.org/10.1098/rspb.2016.1641 (2016).
20. Magrach, A., González-Varo, J. P., Boiffier, M., Vilà, M. & Bartomeus, I. Honeybee spillover reshuffles pollinator diets and affects
plant reproductive success. Nat. Ecol. Evol. https://doi.org/10.1038/s41559-017-0249-9 (2017).
21. González-Varo, J. P. & Vilà, M. Spillover of managed honeybees from mass-flowering crops into natural habitats. Biol. Conserv.
212, 376–382. https://doi.org/10.1016/j.biocon.2017.06.018 (2017).
22. Begon, M., Harper, J. L. & Townsend, C. R. Ecology: Individuals, Populations, and Communities 3rd edn. (Blackwell Science Ltd,
Hoboken, 1996).
23. United Nations. (United Nations, Department of Economic and Social Affairs, Population Division, New York, 2012).
24. Goulson, D., Nicholls, E., Botias, C. & Rotheray, E. L. Bee declines driven by combined stress from parasites, pesticides, and lack
of flowers. Science 347, 1435. https://doi.org/10.1126/science.1255957 (2015).
25. Scheper, J. et al. Local and landscape-level floral resources explain effects of wildflower strips on wild bees across four European
countries. J. Appl. Ecol. 52, 1165–1175. https://doi.org/10.1111/1365-2664.12479 (2015).
26. McCune, F., Normandin, E., Mazerolle, M. J. & Fournier, V. Response of wild bee communities to beekeeping, urbanization, and
flower availability. Urban Ecosyst. https://doi.org/10.1007/s11252-019-00909-y (2019).
27. Samuelson, A. E., Gill, R. J., Brown, M. J. F. & Leadbeater, E. Lower bumblebee colony reproductive success in agricultural compared
with urban environments. Proc. R. Soc. B Biol. Sci. 285, 9. https://doi.org/10.1098/rspb.2018.0807 (2018).
28. Steffan-Dewenter, I. & Kuhn, A. Honeybee foraging in differentially structured landscapes. Proc. R. Soc. B Biol. Sci. 270, 569–575.
https://doi.org/10.1098/rspb.2002.2292 (2003).
29. Couvillon, M. J., Schurch, R. & Ratnieks, F. L. W. Dancing bees communicate a foraging preference for rural lands in high-level
agri-environment schemes. Curr. Biol. 24, 1212–1215. https://doi.org/10.1016/j.cub.2014.03.072 (2014).
30. Bänsch, S., Tscharntke, T., Ratnieks, F. L. W., Härtel, S. & Westphal, C. Foraging of honey bees in agricultural landscapes with
changing patterns of flower resources. Agric. Ecosyst. Environ. 291, 106792. https://doi.org/10.1016/j.agee.2019.106792 (2020).
31. Walther-Hellwig, K. & Frankl, R. Foraging distances of Bombus muscorum, Bombus lapidarius, and Bombus terrestris (Hymenoptera,
Apidae). J. Insect Behav. 13, 239–246. https://doi.org/10.1023/A:1007740315207 (2000).
32. Chauzat, M. P. et al. Demographics of the European apicultural industry. PLoS ONE 8, e79018. https://doi.org/10.1371/journ
al.pone.0079018 (2013).
33. Stanley, D. A., Gunning, D. & Stout, J. C. Pollinators and pollination of oilseed rape crops (Brassica napus L.) in Ireland: ecological
and economic incentives for pollinator conservation. J. Insect Conserv. 17, 1181–1189. https://doi.org/10.1007/s10841-013-9599-z
(2013).
34. Westphal, C. et al. Measuring bee diversity in different European habitats and biogeographical regions. Ecol. Monogr. 78, 653–671.
https://doi.org/10.1890/07-1292.1 (2008).
35. Lebuhn, G., Droege, S., Connor, E., Gemmill-Herren, B. & Azzu, N. in Guidance for practioners 64 pp. (FAO, Rome, 2016).
36. De Saeger, S. et al. (ed Rapporten van het Instituut voor Natuur- en Bosonderzoek 2016) (Instituut voor Natuur- en Bosonderzoek,
Brussel, 2016).
37. 3QGIS_Development_Team. QGIS Geographic Information System, 2018).
38. Oksanen, J. et al. Community Ecology Package ’Vegan’. (2016). https://github.com/vegandevs/vegan.
Scientific Reports | (2021) 11:3755 | https://doi.org/10.1038/s41598-021-82540-6 8
Vol:.(1234567890)www.nature.com/scientificreports/
39. Meeus, I., de Graaf, D. C., Jans, K. & Smagghe, G. Multiplex PCR detection of slowly-evolving trypanosomatids and neogregarines
in bumblebees using broad-range primers. J. Appl. Microbiol. 109, 107–115. https://doi.org/10.1111/j.1365-2672.2009.04635.x
(2010).
40. Ravoet, J. et al. Widespread occurrence of honey bee pathogens in solitary bees. J. Invertebr. Pathol. 122, 55–58. https://doi.
org/10.1016/j.jip.2014.08.007 (2014).
41. De Smet, L. et al. BeeDoctor, a versatile MLPA-based diagnostic tool for screening bee viruses. PLoS ONE 7, e47953. https://doi.
org/10.1371/journal.pone.0047953 (2012).
42. Parmentier, L. et al. Commercial bumblebee hives to assess an anthropogenic environment for pollinator support: A case study
in the region of Ghent (Belgium). Environ. Monit. Assess. 186, 2357–2367. https://doi.org/10.1007/s10661-013-3543-2 (2014).
43. Rundlöf, M. et al. Seed coating with a neonicotinoid insecticide negatively affects wild bees. Nature 521, 77–80. https://doi.
org/10.1038/nature14420 (2015).
44. Goulson, D. Bumblebees: Their Behaviour and Ecology (Oxford University Press, Oxford, 2003).
45. Bates, D., Machler, M., Bolker, B. M. & Walker, S. C. Fitting linear mixed-effects models using lme4. J. Stat. Softw. 67, 1–48 (2015).
46. Hedges, L. & Olkin, I. Statistical Methods for Meta-Analysis (Academic Press, Cambridge, 1985).
47. DeBach, P. The competitive displacement and coexistence principles. Annu. Rev. Entomol. 11, 183–212. https://doi.org/10.1146/
annurev.en.11.010166.001151 (1966).
48. Balfour, N. J., Gandy, S. & Ratnieks, F. L. W. Exploitative competition alters bee foraging and flower choice. Behav. Ecol. Sociobiol.
69, 1731–1738. https://doi.org/10.1007/s00265-015-1985-y (2015).
49. Herbertssön, L., Lindström, S. A. M., Rundlof, M., Bornmarco, R. & Smith, H. G. Competition between managed honeybees and
wild bumblebees depends on landscape context. Basic Appl. Ecol. 17, 609–616. https://doi.org/10.1016/j.baae.2016.05.001 (2016).
50. Ropars, L., Dajoz, I., Fontaine, C., Muratet, A. & Geslin, B. Wild pollinator activity negatively related to honey bee colony densities
in urban context. PLoS ONE 14, 16. https://doi.org/10.1371/journal.pone.0222316 (2019).
51. Ellis, C., Park, K. J., Whitehorn, P., David, A. & Goulson, D. The neonicotinoid insecticide Thiacloprid impacts upon bumblebee
colony development under field conditions. Environ. Sci. Technol. 51, 1727–1732. https://doi.org/10.1021/acs.est.6b04791 (2017).
52. Geslin, B., Gauzens, B., Thebault, E. & Dajoz, I. Plant pollinator networks along a gradient of urbanisation. PLoS ONE 8, e63421
(2013).
53. Neame, L. A., Griswold, T. & Elle, E. Pollinator nesting guilds respond differently to urban habitat fragmentation in an oak-
savannah ecosystem. Insect Conserv. Divers. 6, 57–66 (2013).
54. Glaum, P., Simao, M.-C., Vaidya, C., Fitch, G. & Iulinao, B. Big city Bombus: Using natural history and land-use history to find
significant environmental drivers in bumble-bee declines in urban development. R. Soc. Open Sci. 4, 170156 (2017).
55. Normandin, E., Vereecken, N. J., Buddle, C. M. & Fournier, V. Taxonomic and functional trait diversity of wild bees in two urban
settings. PeerJ 5, e3051 (2017).
56. Moerman, R., Vanderplanck, M., Fournier, D., Jacquemart, A. L. & Michez, D. Pollen nutrients better explain bumblebee colony
development than pollen diversity. Insect Conserv. Divers. 10, 171–179. https://doi.org/10.1111/icad.12213 (2017).
Acknowledgements
The authors would like to thank the beekeepers that participated in this study. A thanks to Prof. Dries Bonte for
commenting on earlier versions of the manuscript.
Author contributions
Conceived and designed the experiments: I.M. & L.P. Performed the experiments and sampling: L.P. Analysed
the data: L.P., I.M. & M.P. Contributed reagents/materials/analysis tools: D.G. & G.S. Wrote the paper: I.M. &
L.P. All authors corrected the paper and gave final approval for publication.
Funding
This study was supported by the Fund for Research Foundation—Flanders (FWO) and the Belgian Science
Policy Office (Belspo).
Competing interests
The authors declare no competing interests.
Additional information
Supplementary Information The online version contains supplementary material available at https://doi.
org/10.1038/s41598-021-82540-6.
Correspondence and requests for materials should be addressed to I.M. or L.P.
Reprints and permissions information is available at www.nature.com/reprints.
Publisher’s note Springer Nature remains neutral with regard to jurisdictional claims in published maps and
institutional affiliations.
Open Access This article is licensed under a Creative Commons Attribution 4.0 International
License, which permits use, sharing, adaptation, distribution and reproduction in any medium or
format, as long as you give appropriate credit to the original author(s) and the source, provide a link to the
Creative Commons licence, and indicate if changes were made. The images or other third party material in this
article are included in the article’s Creative Commons licence, unless indicated otherwise in a credit line to the
material. If material is not included in the article’s Creative Commons licence and your intended use is not
permitted by statutory regulation or exceeds the permitted use, you will need to obtain permission directly from
the copyright holder. To view a copy of this licence, visit http://creativecommons.org/licenses/by/4.0/.
© The Author(s) 2021
Scientific Reports | (2021) 11:3755 | https://doi.org/10.1038/s41598-021-82540-6 9
Vol.:(0123456789)You can also read