Natural Magnesium-Enriched Deep-Sea Water Improves Insulin Resistance and the Lipid Profile of Prediabetic Adults: A Randomized, Double-Blinded ...
←
→
Page content transcription
If your browser does not render page correctly, please read the page content below
nutrients
Article
Natural Magnesium-Enriched Deep-Sea Water
Improves Insulin Resistance and the Lipid Profile of
Prediabetic Adults: A Randomized, Double-Blinded
Crossover Trial
Ji Yeon Ham 1 and Yun Hee Shon 2, *
 1   Department of Laboratory Medicine, Kyungpook National University Hospital, 130 Dongdukro Jung-gu,
     Daegu 41944, Korea; twinkle-hj@hotmail.com
 2   Bio-Medical Research Institute, Kyungpook National University Hospital, 135 Dongdukro Jung-gu,
     Daegu 41940, Korea
 *   Correspondence: yhshon@hmail.knu.ac.kr; Tel.: +82-53-200-6952

 Received: 23 January 2020; Accepted: 14 February 2020; Published: 18 February 2020

 Abstract: Previous in vitro and in vivo studies have shown that the antidiabetic effect of balanced
 deep-sea water (BDSW) works through the suppression of hyperglycemia and improvement of
 glucose tolerance. Based on these promising results, we conducted an eight week randomized,
 double-blinded crossover trial of the effects of BDSW in prediabetic adults. The subjects consumed
 440 mL of BDSW (hardness 4000) per day, and maintained an otherwise normal lifestyle and
 diet throughout. Efficacy assessments were made by measuring fasting glucose, postprandial
 glucose, fasting insulin, homeostasis model assessment for insulin resistance (HOMA-IR), C-peptide,
 glycosylated hemoglobin, lipid metabolism indicators, and physical metrics, along with safety
 assessments. Fasting insulin and HOMA-IR values of the BDSW group were significantly lower than
 those of the placebo group after eight weeks of BDSW ingestion. Total cholesterol and low-density
 lipoprotein–cholesterol were also significantly decreased in the BDSW group after eight weeks
 of BDSW ingestion compared with the placebo group. There were no statistically and clinically
 meaningful changes in adverse events, physical examination, laboratory medicine examination, or
 vital signs of the BDSW intake group. These results suggested that the intake of BDSW in prediabetic
 adults can improve glucose metabolism and lipid profiles and is safe for human consumption.

 Keywords: balanced deep-sea water; clinical trial; diabetes mellitus; glucose metabolism; lipid profile;
 magnesium; prediabetes

1. Introduction
     Diabetes mellitus is the most common endocrine disorder in modern people. According to data
released by the International Diabetes Federation in 2017, about 500 million people worldwide suffer
from diabetes. Thus, diabetes is not just a health crisis, but a global disaster [1]. Diabetes itself
is dangerous and unless adequate treatment is provided, diverse and serious complications such
as diabetic retinopathy [2], stroke [3], chronic renal failure [4], angina pectoris [5], and myocardial
infarction [6] can cause a decrease in quality of life and lead to patient death.
     Deep-sea water is low-temperature water that exists at a depth of more than 200 m. It is not
exposed to sunlight, so the water contains almost no biodegradable organic components. Deep-sea
water contains a large number of natural minerals such as Mg2+ , Ca2+ , Na+ , Zn2+ , and K+ ; thus it
represents a rich marine resource that is clean and contains natural minerals [7].

Nutrients 2020, 12, 515; doi:10.3390/nu12020515                               www.mdpi.com/journal/nutrients
Nutrients 2020, 12, 515 2 of 15
Magnesium (Mg) is the fourth abundant mineral in the human body and is an important metabolic
electrolyte. It is known as a cofactor in more than 300 enzyme systems that regulate a variety of
body biochemical reactions, including energy generation [8], enzyme activation [9], cardiovascular
system [10], membrane function [11], and nutritional metabolism [12]. As magnesium has many
functions in the human body, it also plays an important role in the prevention and treatment of
various diseases. Studies have shown that hypomagnesemia results in patients having a high risk of
multiple metabolic and cardiovascular diseases [13–15]. The effectiveness of magnesium supplements
to improve glycemic and insulin-sensitivity parameters in pre-diabetic and diabetic participants has
already been proposed in previous clinical trials [12,16,17]. Therefore, ingestion of deep-sea water
containing large amounts of natural magnesium may be helpful to improve symptoms in diabetic
patients. Previous reports have shown that the physiological activities of deep-sea water included
improvements to arteriosclerosis [18], improperly raised blood pressure [19], and atopic dermatitis [20]
in animal studies. However, there has not yet been any systematic study on the effects of deep-sea
water on diabetic symptoms or its mechanism of action in the human body.
Previously, our studies on the antidiabetic effects of balanced deep-sea water (BDSW) have
shown that hyperglycemia and glucose tolerance were improved by accelerating glucose uptake, along
with the suppression of glucose production-related genes, and a recovery of pancreatic function in
experimental animal models of obesity and non-obesity type diabetes mellitus [21,22]. Based on the
efficacy of BDSW in cell and animal experiments, the clinical trial presented here was conducted to
evaluate the efficacy of BDSW on glycemic and insulin-sensitivity parameters, as well as its safety.
2. Materials and Methods
2.1. Ethics
The clinical trial was carried out in accordance with the Declaration of Helsinki at the Clinical
Trial Center for Functional Foods, Chonbuk National University Hospital in South Korea. It was
reviewed by the Institutional Review Board (IRB) of Chonbuk National University Hospital and its
implementation was approved (IRB No. CTCF2_2016_DSW, date. 2016.04.28). The trial was performed
in compliance with Good Clinical Practice. The progress of the trial was monitored at the hospital and
was carried out by Bio Food Story (Contract Research Organization; Ogol 4–gil 16, Dukjin-gu, Jeonju,
Jeollabuk-do).
After being fully informed of the purpose of the study, as well as any possible adverse reactions,
all participants gave their informed consent in signed document format before they participated in
the study.
2.2. Subject
All subjects who participated in the clinical trial met the following criteria: adults between 19 and
70 years of age, with no history of diabetes mellitus within the last 3 months, 75 g oral glucose tolerance
test (OGTT) and fasting blood glucose levels of 100–125 mg/dL, and 2 h postprandial blood glucose
levels of 140–199 mg/dL. All study participants heard and understood the full details of this study,
voluntarily decided to participate, and agreed in writing to comply with the precautions. The criterion
for exclusion of study subjects is available as Supplementary Materials (Supplementary File 1).
2.3. Preparation of Product (BDSW)
Deep-sea water was collected at a depth of 0.5 km and a distance of 6.7 km off Oho-Ri, Goseong
(Gangwon-Do, Korea). It was then filtered through a microfiltration membrane (Synopex, Pohang,
Korea), and deep-sea water mineral extracts and desalinated water were obtained using a reverse
osmosis system (Vontron Technology Co., Ltd., Beijing, China). BDSW was used in this trial by mixing
desalinated water with magnesium and calcium at a constant ratio (magnesium: calcium = 3:1),
producing a hardness of 4000 as shown in (Table 1) [23]. The mineral content of deep-sea water isNutrients 2020, 12, 515 3 of 15
defined as hardness and calculated internationally according to the following formula: hardness = Mg
(mg/L) × 4.1 + Ca (mg/L) × 2.5.
Table 1. Content of product and placebo (top) and mineral content of the balanced deep-sea water
(BDSW) at a hardness of 4000 (bottom).
BDSW Placebo
Component
Mixing Ratio (%) Usage (g) Mixing Ratio (%) Usage (g)
BDSW (hardness 4000) 97.9 430.8 - -
Main component
Purified water - - 96.8 425.9
Dextrin - - 1.1 4.8
Cranberry (concentrated
Minor component 2.0 8.8 2.0 8.8
solution)
Cranberry scent 0.1 0.4 0.1 0.4
Total 100 440 100 440
BDSW, balanced deep-sea water.
Mineral BDSW (mg/L)
Magnesium (Mg) 813
Calcium (Ca) 275
Potassium (K) 20
Sodium (Na) 41
Overall hardness 1) 4000
BDSW, balanced deep-sea water. 1) 813 (mg/L) × 4.1 + 275 (mg/L) × 2.5.
In this study, the functional ingredient of the product was set as magnesium (Mg). According to
the Korean daily nutritional intake standard, the recommended daily intake of magnesium for adults
is 350 mg. The magnesium content of commercially available mineral products is 400–500 mg/day;
thus, the amount proposed in this study (350 mg) is within that range. Therefore, the intake suggested
for this study was judged as likely to present no safety problems. When the amount of magnesium
was set at 350 mg, based on a water hardness of 4000 in BDSW, the volume of the product consumed
by each subject per day was 440 mL (Table 1). The placebo was made with purified water as the main
ingredient and was approximately equal in taste, weight, and calories to BDSW (Table 1).
2.4. Method of Product Intake
The subjects were then randomly assigned to group A or group B on the first day of the first visit.
The first trial product was taken for eight weeks according to the order of intake of the trial product
by the group, and then the second trial product was taken for eight weeks after a four-week break
(Table 2).
Table 2. Method of intake.
Assigned Group First Period (0–8 Weeks) Wash-Out Period (8–11 Weeks) Second Period (12–20 Weeks)
A BDSW intake Placebo intake
B Placebo intake BDSW intake
2.5. Study Design
This study was an eight-week, randomized, double-blind, placebo-contrast, crossover study
to assess the efficacy and safety of BDSW in improving glucose metabolism. This clinical trial was
registered at ClinicalTrials.gov with trial registration number NCT03956914. The CONSORT flow
diagram (Figure A1) and checklist (Table A1) are provided in the Appendix A.
Randomization was used in the double-blind phase to avoid bias when assigning subjects and to
increase the effectiveness of statistical comparisons between treatment groups by balancing the knownNutrients 2020, 12, 515 4 of 15
or unknown characteristics of the subjects (demographic and baseline characteristics) for each treatment
group. Double-blind administration was used to reduce potential bias in data collection and evaluation
at the end of the clinical trial. In order to maintain the double-blind procedure during the clinical
trial period, neither the researcher nor the subject should be able to know the subject’s randomization
information. Therefore, the randomization code was only in the possession of Kyungpook National
University Hospital. In addition, no subject was released from double-blinding until the trial was
completed, and data were locked. If double-blinding was lifted, the date, time, and reason for the
release were documented in the case record and in the appropriate documentation. A copy of the
blinding code release confirmation document received from Kyungpook National University Hospital
was kept in the supporting documents, which are available upon request.
A summary of the clinical trial schedule is provided in the Supplementary Materials
(Supplementary File 2). The efficacy evaluation metrics were blood glucose-related index, blood lipid
index, and anthropometric index. After fasting for 12 h, blood glucose levels were measured by taking
blood from the upper arm vein after ingesting the clinical trial product and a 75 g glucose solution. At
the screening visit, blood samples were collected before the ingestion of a 75 g glucose solution (0 min)
and 120 min after the ingestion of a 75 g glucose solution without consumption of the clinical trial
product. At the first, second, third, and fourth visits, blood samples were taken at 0, 30, 60, 90, and
120 min after ingesting trial products and 75 g glucose solutions. The clinical trial product was taken
just before the consumption of 75 g of glucose.
Blood for the measurement of fat indicators was collected from veins such as the superior
vena cava while maintaining 12 h fasting; total cholesterol (TC), triglycerides (TG), low-density
lipoprotein–cholesterol (LDL-C), and high-density lipoprotein–cholesterol (HDL-C) were measured.
The anthropometric indicators included the measurement of height, weight, body fat, body fat
percentage, body mass index, waist circumference, hip circumference, and waist-to-hip ratio.
The safety evaluation items are adverse reactions, physical examination, laboratory medicinal
examination, and vital signs. Adverse events were recorded in detail on the timing, duration, severity,
outcome, and causation of adverse events. Physical examinations included interviews, inspection,
testing using a stethoscope, percussion, and palpation. Laboratory medicinal examinations were
carried out with 12 h fasting. Blood was drawn from the veins such as the upper arm vein, and
the following items were examined. A general blood trial was used to measure white blood cells
(WBC), red blood cells, hemoglobin, hematocrit, and platelets. Blood chemistry trials included alkaline
phosphatase, gamma-glutamyl transferase, aspartate aminotransferase, alanine aminotransferase, total
bilirubin, total protein, albumin, blood urea nitrogen, creatine, and estimated glomerular filtration rate
(eGFR) measurements. A urine trial was used to measure the specific gravity, pH, WBC, nitrite, protein,
glucose, ketone, urobilinogen, bilirubin, and occult blood. Vital signs were measured to calculate blood
pressure and pulse rate.
2.6. Statistical Analysis
Statistical analysis system 9.4 for Windows was used for analysis, and the statistical significance
level for all measures was set at 5% or less. The homogeneity trial of the baseline value of the efficacy
and safety evaluation items between intake groups was carried out using an independent t-test. The
difference between intake groups and within intake groups was analyzed by applying an RM-ANOVA
or linear mixed effect model for repeated measurement of the validity and safety assessment metrics.
Adverse events that occurred during the trial period were tested using a chi-square or Fisher’s exact test.
3. Results
3.1. Subjects
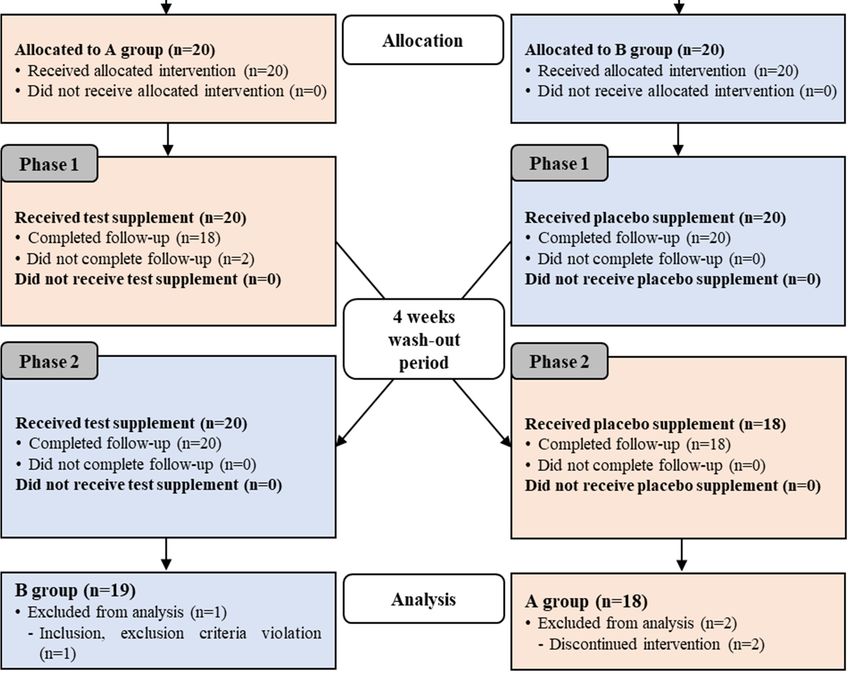
A total of 40 subjects were enrolled, with 20 people per allotted group. Since the study followed a
cross-design, the total number of people to be analyzed was 80. Among the registered subjects, thereNutrients 2020, 12, 515 5 of 15
were two dropouts, one registrant who violated the selection criteria, and 38 subjects who completed
the test (Figure A1). The main analytical group for validation was performed in 37 subjects who
completed the study, followed the clinical protocol, and had at least one measure of the main endpoint
variable (Figure A1).
Demographic data were analyzed for 40 subjects in the study group who consumed the test
product at least once during the trial (Supplementary File 3). As a result of analyzing the baseline of
the efficacy evaluation items, there was no statistically significant difference between the two groups in
all items (Table 3).
Table 3. Baseline of effectiveness criteria.
BDSW Group (n = 37) Placebo Group (n = 37) p-Value 1)
FPG (mg/dL) 99.59 ± 7.96 99.14 ± 10.05 0.828
PPG0.5h (mg/dL) 174.14 ± 18.68 177.65 ± 28.05 0.528
PPG1.0h (mg/dL) 189.62 ± 28.57 192.00 ± 37.05 0.758
PPG1.5h (mg/dL) 167.97 ± 37.67 176.30 ± 41.33 0.368
PPG2h (mg/dL) 149.32 ± 33.18 146.92 ± 38.95 0.776
iAUC0−2h (hr*mg/dL) 129.12 ± 37.88 136.47 ± 49.76 0.477
FPI (µU/mL) 8.66 ± 4.87 7.95 ± 3.88 0.494
HOMA-IR 2.13 ± 1.19 1.96 ± 1.03 0.510
C-peptide (ng/mL) 1.94 ± 0.70 1.91 ± 0.55 0.844
HbA1c (%) 5.82 ± 0.30 5.80 ± 0.32 0.766
TC (mg/dL) 204.30 ± 33.94 194.62 ± 34.08 0.225
TG (mg/dL) 138.81 ± 64.57 161.46 ± 100.70 0.254
HDL-C (mg/dL) 48.05 ± 8.93 47.22 ± 9.23 0.693
LDL-C (mg/dL) 128.41 ± 29.80 116.22 ± 33.00 0.100
Weight (kg) 66.37 ± 13.57 66.31 ± 13.71 0.986
BMI (kg/m2 ) 25.19 ± 4.01 25.16 ± 4.05 0.977
BFM (g) 20.01 ± 8.12 19.69 ± 8.31 0.868
PBF (%) 29.98 ± 7.20 29.58 ± 7.58 0.819
WC (cm) 88.67 ± 9.85 88.08 ± 9.82 0.797
HC (cm) 95.53 ± 9.17 95.36 ± 9.23 0.936
WHR 0.93 ± 0.05 0.92 ± 0.04 0.669
Values are presented as mean ± SD. FPG, fasting plasma glucose; PPG, postprandial plasma glucose; iAUC, glucose
area; FPI, fasting plasma insulin; HOMA-IR, homeostatic model assessment of insulin resistance; HbA1c, glycosylated
hemoglobin, type A1c; TC, total cholesterol; TG, triglycerides; HDL-C, high-density lipoprotein–cholesterol; LDL-C,
low-density lipoprotein–cholesterol; BMI, body mass index; BFM, body fat mass; PBF, percent body fat; WC, waist
measurement; HC, hip measurement; WHR, waist–hip ratio. 1) Analyzed by independent t-test.
3.2. Effects on Glycemic and Insulin-Sensitivity Parameters
Fasting plasma glucose (FPG) and postprandial plasma glucose (PPG) were measured at baseline
and eight weeks after the ingestion of test products in the first (0–8 weeks) and second (12–20 weeks)
periods. During each clinic visit, blood glucose was measured at baseline and after (30, 60, 90, and
120 min) ingestion of a 75 g glucose solution using the OGTT. The blood glucose response area was
shown using a plasma glucose concentration-time curve area, which increased compared to baseline
from the start of intake to the point of collection for a two hour period.
The results of blood glucose analysis were summarized in Table 4. There were no statistically
significant differences in FPG, PPG, and glucose area under the curve (iAUC) between the two groups
(p > 0.05).Nutrients 2020, 12, 515 6 of 15
Table 4. Fasting and postprandial glucose changes before and after eight weeks of ingestion.
BDSW Group (n = 37) Placebo Group (n = 37)
8 Change Change p-Value 2)
Baseline p-Value 1) Baseline 8 Weeks p-Value 1)
Weeks Value Value
99.59 ± 100.32 0.73 ±
FPG (mg/dL) 0.369 99.14 ± 10.05 99.59 ± 7.79 0.46 ± 6.91 0.689 0.837
7.96 ± 8.69 4.88
174.14 171.19 −2.95 ± 177.65 ± 176.54 ± −1.11 ±
30 min 0.427 0.804 0.734
± 18.68 ± 20.69 22.28 28.05 20.99 26.92
189.62 183.65 −5.97 ± 192.00 ± 186.30 ± −5.70 ±
PPG 60 min 0.269 0.278 0.966
± 28.57 ± 34.09 32.36 37.05 35.07 31.51
(mg/dL)
167.97 160.84 −7.14 ± 176.30 ± 165.11 ± −11.19 ±
90 min 0.227 0.085 0.657
± 37.67 ± 37.62 35.34 41.33 34.25 38.46
120 149.32 141.86 −7.46 ± 146.92 ± 136.03 ± −10.89 ±
0.198 0.100 0.679
min ± 33.18 ± 36.27 34.58 38.95 29.18 39.28
iAUC0−2h 129.12 118.32 −10.81 ± 136.47 ± 124.18 ± −12.29 ±
0.070 0.093 0.900
(h·mg/dL) ± 37.88 ± 39.24 35.23 49.76 40.45 43.32
Values are presented as mean ± SD. Change value = value at 8 weeks − baseline value. Analyzed by paired t-test 1)
compared within the group. 2) Analyzed by independent t-test change values of the comparison between groups
(analyzed by a linear mixed effect model for repeated measures data).
Fasting plasma insulin (FPI), the homeostasis model assessment for insulin resistance (HOMA-IR),
C-peptide, and type A1c glycosylated hemoglobin (HbA1c) were all measured at baseline and eight
weeks after ingestion of test products in the first (0–8 weeks) and second (12–20 weeks) periods. The
fasting insulin (p = 0.042) and HOMA-IR (p = 0.049) values of the BDSW group were significantly
lower than those of the placebo group after eight weeks of ingestion. C-peptide and HbA1c showed no
statistically significant differences between the two groups (p > 0.05) (Table 5).
Table 5. Changes in blood glucose-related indicators before and after ingestion.
BDSW Group (n = 37) Placebo Group (n = 37)
Change Change p-Value 2)
Baseline 8 Weeks p-Value 1) Baseline 8 Weeks p-Value 1)
Value Value
FPI
8.66 ± 4.87 7.59 ± 3.87 −1.07 ± 3.97 0.110 7.95 ± 3.88 8.62 ± 4.14 0.67 ± 2.76 0.151 0.042 *
(µU/mL)
HOMA-IR 2.13 ± 1.19 1.87 ± 0.92 −0.27 ± 1.01 0.113 1.96 ± 1.03 2.13 ± 1.03 0.17 ± 0.70 0.157 0.049 *
C-peptide
1.94 ± 0.70 1.87 ± 0.49 −0.07 ± 0.53 0.452 1.91 ± 0.55 1.96 ± 0.57 0.05 ± 0.30 0.311 0.263
(ng/mL)
HbA1c (%) 5.82 ± 0.30 5.83 ± 0.32 0.01 ± 0.17 0.846 5.80 ± 0.32 5.84 ± 0.31 0.04 ± 0.15 0.088 0.249
Values are presented as mean ± SD. * pNutrients 2020, 12, 515 7 of 15
3.4. Dietary Intake Analysis
In order to evaluate the food and nutrient intakes of the subjects during clinical trial participation,
a dietary intake survey was conducted at baseline and after eight weeks of ingestion of the test product.
The dietary data sheets were prepared according to the meal recording method and were analyzed
using CAN Pro 4.0®. As a result, there was no statistically significant difference between the two
groups (p > 0.05) (Table 7).
Table 7. Dietary intake analysis before and after ingestion.
BDSW group (n = 37) Placebo group (n = 37)
Change Change p-Value 2)
Baseline 8 Weeks p-Value 1) Baseline 8 Weeks p-Value 1)
Value Value
Calorie 1676.28 ± 1721.93 ± 19.35 ± 1767.29 ± 1753.15 ± −14.14 ±
0.647 0.863 0.622
(kcal) 410.77 449.86 384.25 563.25 454.26 495.96
Carbohydrate 251.27 ± 263.63 ± 259.77 ± 256.24 ± −3.53 ±
7.82 ± 60.88 0.367 0.768 0.344
(g) 68.93 78.52 82.75 71.15 72.32
42.82 ± 41.13 ± −2.47 ± 44.52 ± 45.12 ±
Fat (g) 0.502 0.60 ± 24.77 0.884 0.624
16.22 16.83 17.75 22.18 17.60
68.72 ± 69.32 ± 71.02 ± 72.40 ±
Protein (g) 0.01 ± 22.70 0.927 1.38 ± 24.71 0.735 0.910
19.28 22.72 23.91 20.32
Dietary
22.83 ± 8.19 24.23 ± 8.48 1.24 ± 7.30 0.290 24.67 ± 9.24 24.39 ± 8.88 −0.28 ± 8.40 0.843 0.265
fiber (g)
Values are presented as mean ± SD. Change value = value at 8 weeks − baseline value. Analyzed by paired t-test 1)
compared within the group. 2) Analyzed by independent t-test change values of the comparison between groups
(analyzed by a linear mixed effect model for repeated measures data).
3.5. Safety Evaluation
A thorough safety evaluation was conducted in the 40 subjects who participated in the clinical
trial and consumed the test product at least once (safety group). Table 8 summarizes the results of the
laboratory medicinal examinations (hematology, blood biochemistry, and urinalysis) measured before
and eight weeks after the ingestion of test products in the first (0–8 weeks) and second (12–20 weeks)
periods. There was no statistically significant difference between the two groups (p > 0.05). There were no
clinically meaningful anomalies or changes according to the ingestion of the products for clinical trials.
Table 8. Laboratory medicinal examination.
BDSW Group (n = 40) Placebo Group (n = 40)
Change Change p-Value 2)
Baseline 8 Weeks p-Value 1) Baseline 8 Weeks p-Value 1)
Value Value
Hematology
WBC (×103 /µL) 5.90 ± 1.74 5.76 ± 1.60 −0.14 ± 1.41 0.547 5.77 ± 1.52 5.70 ± 1.41 −0.07 ± 0.84 0.598 0.807
RBC
4.51 ± 0.34 4.52 ± 0.33 0.01 ± 0.15 0.831 4.51 ± 0.33 4.53 ± 0.35 0.02 ± 0.15 0.392 0.655
(×1003 /µL)
Hemoglobin
13.80 ± 1.11 13.84 ± 1.05 0.04 ± 0.51 0.667 13.85 ± 1.10 13.94 ± 1.14 0.09 ± 0.51 0.296 0.654
(g/dL)
Hematocrit (%) 40.91 ± 2.75 41.08 ± 2.79 0.17 ± 1.38 0.440 40.97 ± 2.99 41.15 ± 3.03 0.18 ± 1.37 0.418 0.982
Platelet 276.85 ± 277.98 ± 272.73 ± 279.40 ±
1.13 ± 24.97 0.777 6.68 ± 25.20 0.102 0.351
(×103 /µL) 72.02 62.85 66.17 60.35
Biochemistry
68.85 ± 68.18 ± 68.13 ± 68.00 ±
ALP (IU/L) −0.68 ± 6.66 0.525 −0.13 ± 7.38 0.915 0.736
18.24 16.96 17.80 19.18
28.93 ± 27.68 ± 28.53 ± 27.33 ±
GGT (IU/L) −1.25 ± 8.21 0.342 −1.20 ± 8.78 0.393 0.979
18.73 18.52 18.92 19.18
AST (IU/L) 24.15 ± 5.78 24.78 ± 6.29 0.63 ± 4.35 0.369 23.78 ± 5.70 23.43 ± 6.08 −0.35 ± 5.88 0.709 0.427
27.10 ±
ALT (IU/L) 25.95 ± 9.06 1.15 ± 7.99 0.368 25.40 ± 8.94 24.53 ± 7.49 −0.88 ± 6.55 0.404 0.262
10.99
Total bilirubin
0.91 ± 0.35 0.86 ± 0.30 −0.05 ± 0.24 0.189 0.86 ± 0.32 0.88 ± 0.27 0.01 ± 0.23 0.707 0.209
(mg/dL)
Total protein
7.32 ± 0.36 7.28 ± 0.31 −0.04 ± 0.27 0.359 7.28 ± 0.36 7.34 ± 0.33 0.07 ± 0.30 0.176 0.101
(g/dL)
Albumin (g/dL) 4.26 ± 0.19 4.25 ± 0.20 −0.01 ± 0.16 0.841 4.22 ± 0.17 4.27 ± 0.18 0.04 ± 0.14 0.068 0.179
BUN (mg/dL) 15.28 ± 3.69 15.20 ± 3.63 −0.08 ± 3.72 0.899 15.60 ± 3.48 14.60 ± 4.15 −1.00 ± 4.20 0.139 0.308
Creatinine
0.62 ± 0.14 0.63 ± 0.13 0.01 ± 0.13 0.698 0.63 ± 0.14 0.64 ± 0.14 0.01 ± 0.07 0.642 0.910
(mg/dL)
eGFR 107.93 ± 106.58 ± −1.35 ± 106.62 ± 106.29 ±
0.462 −0.33 ± 5.05 0.686 0.582
(mL/min/1.7) 8.22 8.30 11.49 8.03 8.18Nutrients 2020, 12, 515 8 of 15
Table 8. Cont.
BDSW Group (n = 40) Placebo Group (n = 40)
Change Change p-Value 2)
Baseline 8 Weeks p-Value 1) Baseline 8 Weeks p-Value 1)
Value Value
Urinary
SG 1.02 ± 0.00 1.02 ± 0.01 0.00 ± 0.01 0.570 1.02 ± 0.00 1.02 ± 0.00 0.00 ± 0.01 0.517 0.985
pH 6.14 ± 0.72 5.89 ± 0.72 −0.25 ± 0.74 0.040 * 6.30 ± 0.86 6.09 ± 0.75 −0.21 ± 0.78 0.094 0.817
Values are presented as mean ± SD. * p < 0.05. Change value = value at 8 weeks − baseline value. WBC, white
blood cell; RBC, red blood cell; ALP, alkaline phosphatase; GGT, gamma-glutamyl transferase; AST, aspartate
aminotransferase; ALT, alanine aminotransferase; BUN, blood urea nitrogen; eGFR, estimated glomerular filtration
rate; SG, specific gravity. 1) Analyzed by paired t-test compared within the group. 2) Analyzed by linear mixed
effect model for repeated measures data.
Vital signs (systolic blood pressure, diastolic blood pressure, and pulse rate) were measured at
baseline and eight weeks after the ingestion of test products in the first (0–8 weeks) and second (12–20
weeks) periods. There were no statistically significant differences between the two groups (p > 0.05)
and no clinically meaningful changes according to the consumption of clinical trial products (Table 9).
Table 9. Vital signs.
BDSW Group (n = 40) Placebo Group (n = 40)
Change Change p-Value 2)
Baseline 8 Weeks p-Value 1) Baseline 8 Weeks p-Value 1)
Value Value
SBP 119.65 ± 120.83 ± 120.03 ± 121.70 ±
1.18 ± 11.40 0.518 1.68 ± 9.59 0.277 0.827
(mmHg) 12.46 10.70 11.89 10.43
DBP
77.90 ± 8.95 78.98 ± 9.27 1.08 ± 6.66 0.314 77.38 ± 9.83 79.95 ± 7.56 2.58 ± 5.70 0.007 ** 0.324
(mmHg)
Pulse 72.20 ±
71.80 ± 9.91 0.40 ± 8.92 0.778 71.70 ± 9.49 73.10 ± 9.42 1.40 ± 5.55 0.118 0.556
(number/min) 10.37
Values are presented as mean ± SD. ** p < 0.01. Change value = value at 8 weeks – baseline value. SBP, systolic
blood pressure; DBP, diastolic blood pressure. 1) Analyzed by paired t-test compared within group. 2) Analyzed by
linear mixed effect model for repeated measures data.
4. Discussion
The purpose of this study was to investigate the effects of the regular daily intake of magnesium-rich
BDSW on improving glucose and insulin-sensitivity parameters, as well as the overall lipid profile
in prediabetes subjects. We found that fasting insulin, HOMA-IR, TC, and LDL-C levels of the
magnesium-rich BDSW group were significantly lower than those of the placebo group after eight
weeks of ingestion. However, there was no statistically significant difference in fasting glucose,
postprandial glucose, iAUC, C-peptide, or HbA1c between the two groups. The subjects of this study
were not restricted in their dietary preferences. Such variation in the test subjects may have resulted in
our inability to detect clear statistically significant differences in fasting glucose, postprandial glucose,
or HbA1c, mainly due to individual differences in the investigated blood glucose parameters.
Magnesium is required for both the proper utilization of glucose and insulin signaling [17].
Cellular magnesium plays a key role in the insulin-mediated glucose uptake. Its deficiency contributes
to insulin resistance and a decreased utilization of cellular glucose [17]. It has been reported that
hypomagnesemia can lead to a defective activity of tyrosine kinase and can modify insulin sensitivity
by influencing the activity of the insulin receptor after binding or by influencing the intracellular
signaling and processing [24]. There is an additional hypothesis that magnesium deficiency has
deleterious effects on glucose metabolism due to an impairment both in insulin secretion and its action,
contributing to the development of type 2 diabetes (T2D) [25–27].
Many studies have shown that magnesium supplements improve metabolic metrics related
to insulin sensitivity [28–31]. In a study of Chinese populations, serum magnesium levels were
lower in subjects with fasting glucose disorders, impaired glucose tolerance, or T2D than in healthy
controls [32]. Zhao-min Liu and Suzanne C. Ho showed that serum magnesium levels were associated
with prediabetes in postmenopausal women [33]. Previous observational studies have shown that those
who take more magnesium without pre-existing diabetes have a lower risk of developing diabetes [34].Nutrients 2020, 12, 515 9 of 15
It has also been found that ingesting a magnesium-rich diet helps prevent the risk of developing
diabetes in prediabetic patients [17,35]. In a meta-analysis of double-blind randomized controlled
trials on the subject of prediabetes, it was found that oral magnesium supplementation reduces
HOMA-IR [36]. In a search of several electronic databases, there were no reports of reduced plasma
glucose as a primary endpoint in randomized placebo-controlled clinical trials using magnesium
supplementation in prediabetic patients [36]. Consistent with such reports, subjects in this study who
consumed magnesium-rich BDSW supplements had significantly reduced HOMA-IR indices and no
changes to glucose levels.
With reference to available data on this subject, the proportion of prediabetic patients increases in
groups with hypomagnesemia and/or low levels of magnesium intake [37–42]. These studies support
the hypothesis that magnesium deficiency is related to the occurrence of glucose disease. Our findings,
and most findings from other studies on related topics [28–31], demonstrate the efficacy of magnesium
supplements in improving blood glucose conditions in prediabetes patients. Such evidence without a
mechanism of action clearly warrants further study.
According to recommendations provided by the International Diabetes Federation [1], once
diabetes is diagnosed, care must be taken to reduce the risk of future disease. In that sense,
promoting a healthy lifestyle is essential. The inclusion of magnesium-rich BDSW supplements
in the pharmacological treatment of diabetes can now be predicted to be beneficial, so actively seeking
a healthy lifestyle and maintaining an appropriate serum magnesium level using magnesium-rich
BDSW intake is a logical course of action. Our results support the hypothesis that oral magnesium-rich
BDSW supplementation improves insulin-sensitivity metrics in prediabetes and could be used to
establish a public health strategy to reduce the incidence of diabetes.
Dyslipidemia in patients with diabetes plays an important role in promoting atherosclerosis and
is known to contribute to the risk of cardiovascular disease. Considering the prevalence and risk of
diabetes-related cardiovascular disease, it is necessary to evaluate the lipid profile of prediabetic patients.
Therefore, we also studied the impacts of magnesium-rich BDSW on cardiovascular health parameters
that may be secondary to glucose metabolism impairment. Our findings showed amelioration in the
lipid profiles of people who take magnesium-rich BDSW supplements, and are consistent with previous
studies showing that magnesium supplements have a positive impact on lipid response [31,43,44].
In conclusion, our current results demonstrated the efficacy of magnesium-rich BDSW supplements
in improving insulin-sensitivity parameters and lipid profiles in patients with prediabetes. We also
established that BDSW is completely safe for human consumption.
Supplementary Materials: The following are available online at http://www.mdpi.com/2072-6643/12/2/515/s1,
Supplementary File 1. Criterion for exclusion of study subjects; Supplementary File 2. Schedule summary;
Supplementary File 3. Baseline demographic and clinical information.
Author Contributions: Conceptualization, Y.H.S. and J.Y.H.; writing—original draft preparation, Y.H.S.;
writing—review and editing, J.Y.H.; supervision, Y.H.S.; project administration, Y.H.S.; funding acquisition,
Y.H.S. All authors reviewed and approved the final manuscript.
Funding: This study was supported by the National R&D project “Development of new application technology
for deep-seawater industry” (20150274) funded by the Ministry of Oceans and Fisheries, Republic of Korea and
by a grant (No. HI15C0001) from the Korea Health Technology R&D Project through the Korea Health Industry
Development Institute (KHIDI) funded by the Ministry of Health & Welfare, Republic of Korea.
Conflicts of Interest: The authors declare no conflicts of interest.Nutrients 2020, 12, x FOR PEER REVIEW 11 of 15
Appendix
Nutrients 2020, 12, 515 10 of 15
Figure A1. CONSORT 2010 flow diagram.
Appendix A
Figure A1. CONSORT 2010 flow diagram.Nutrients 2020, 12, 515 11 of 15
Table A1. CONSORT 2010 checklist of information to include when reporting a randomized trial.
Section/Topic Item No Checklist Item Reported on Page No.
Title and abstract
1a Identification as a randomized trial in the title 1
Structured summary of trial design, methods,
1b results, and conclusions (for specific guidance see 1
CONSORT for abstracts)
Introduction
Scientific background and explanation of the
Background and 2a 1, 2
rationale
objectives
2b Specific objectives or hypotheses 2
Methods
Description of trial design (such as parallel,
3a 4, Figure A1
factorial) including allocation ratio
Trial design Important changes to methods after trial
3b commencement (such as eligibility criteria), with n/A
reasons
4a Eligibility criteria for participants 2, 3, Suppl. File 1
Participants Settings and locations where the data were
4b 2
collected
The interventions for each group with sufficient
Interventions 5 details to allow replication, including how and 2, 4, 5, Suppl. File 2
when they were actually administered
Completely defined pre-specified primary and
6a secondary outcome measures, including how and 4, 5, Suppl. File 2
Outcomes when they were assessed
Any changes to trial outcomes after the trial
6b n/A
commenced, with reasons
7a How sample size was determined 5, Figure A1
Sample size When applicable, explanation of any interim
7b n/A
analyses and stopping guidelines
Randomization:
Method used to generate the random allocation
8a 4, Figure A1
sequence
Sequence generation
Type of randomization; details of any restriction
8b 4, Figure A1
(such as blocking and block size)
Mechanism used to implement the random
allocation sequence (such as sequentially
Allocation concealment
9 numbered containers), describing any steps taken 4
mechanism
to conceal the sequence until interventions were
assigned
Who generated the random allocation sequence,
Implementation 10 who enrolled participants, and who assigned 4
participants to interventions
If done, who was blinded after assignment to
11a interventions (for example, participants, care 4
Blinding providers, those assessing outcomes) and how
If relevant, description of the similarity of
11b n/A
interventions
Statistical methods used to compare groups for
12a 5
Statistical methods primary and secondary outcomes
Methods for additional analyses, such as subgroup
12b 5
analyses and adjusted analysesNutrients 2020, 12, 515 12 of 15
Table A1. Cont.
Section/Topic Item No Checklist Item Reported on Page No.
Results
For each group, the numbers of participants who
were randomly assigned, received intended
Participant flow (a 13a 5, Figure A1
treatment, and were analyzed for the primary
diagram is strongly
outcome
recommended)
For each group, losses and exclusions after
13b 5, Figure A1
randomization, together with reasons
Dates defining the periods of recruitment and
14a Suppl. File 2
Recruitment follow-up
14b Why the trial ended or was stopped n/A
A table showing baseline demographic and clinical
Baseline data 15 Suppl. File 3, Table 3
characteristics for each group
For each group, number of participants
(denominator) included in each analysis and
Numbers analyzed 16 5, Figure A1
whether the analysis was by original assigned
groups
For each primary and secondary outcome, results
17a for each group, and the estimated effect size and its 5–8, Tables 4–6
Outcomes and precision (such as 95% confidence interval)
estimation
For binary outcomes, presentation of both absolute
17b n/A
and relative effect sizes is recommended
Results of any other analyses performed, including
Ancillary analyses 18 subgroup analyses and adjusted analyses, n/A
distinguishing pre-specified from exploratory
All important harms or unintended effects in each
Harms 19 group (for specific guidance see CONSORT for n/A
harms)
Discussion
Trial limitations, addressing sources of potential
Limitations 20 bias, imprecision, and, if relevant, multiplicity of n/A
analyses
Generalizability (external validity, applicability) of
Generalizability 21 11, 12
the trial findings
Interpretation consistent with results, balancing
Interpretation 22 benefits and harms, and considering other relevant 11, 12
evidence
Other information
Registration 23 Registration number and name of trial registry 4
Where the full trial protocol can be accessed, if
Protocol 24 n/A
available
Sources of funding and other support (such as
Funding 25 12
supply of drugs), role of funders
References
1. International Diabetes Federation. IDF Diabetes Atlas, 8th ed.; Artifex Creative Webnet Ltd.: London, UK,
2017; p. 6.
2. Gardner, T.W.; Sundstrom, J.M. A proposal for early and personalized treatment of diabetic retinopathy
based on clinical pathophysiology and molecular phenotyping. Vision Res. 2017, 139, 153–160. [CrossRef]
[PubMed]
3. Elgebaly, M.M.; Arreguin, J.; Storke, N. Targets, treatments, and outcomes updates in diabetic stroke. J. Stroke
Cerebrovasc. Dis. 2019, 28, 1413–1420. [CrossRef] [PubMed]
4. Doshi, S.M.; Friedman, A.N. Diagnosis and management of type 2 diabetic kidney disease. Clin. J. Am. Soc.
Nephrol. 2017, 12, 1366–1373. [CrossRef]
5. Meiszterics, Z.; Kónyi, A.; Hild, G.; Sárszegi, Z.; Gaszner, B. Effectiveness and safety of anti-ischemic
trimetazidine in patients with stable angina pectoris and type 2 diabetes. J. Comp. Eff. Res. 2017, 6, 649–657.
[CrossRef]Nutrients 2020, 12, 515 13 of 15
6. Echouffo-Tcheugui, J.B.; Kolte, D.; Khera, S.; Aronow, H.D.; Abbott, J.D.; Bhatt, D.L.; Fonarow, G.C. Diabetes
mellitus and cardiogenic shock complicating acute myocardial infarction. Am. J. Med. 2018, 131, 778–786.
[CrossRef]
7. Miyamura, M.; Yoshioka, S.; Hamada, A.; Takuma, D.; Yokota, J.; Kusunose, M.; Kyotani, S.; Kawakita, H.;
Odani, K.; Tsutsui, Y.; et al. Difference between deep seawater and surface seawater in the preventive effect
of atherosclerosis. Biol. Pharm. Bull. 2004, 27, 1784–1787. [CrossRef]
8. de Baaij, J.H.; Hoenderop, J.G.; Bindels, R.J. Magnesium in man: Implications for health and disease. Physiol.
Rev. 2015, 95, 1–46. [CrossRef]
9. Panja, S.; Hua, B.; Zegarra, D.; Ha, T.; Woodson, S.A. Metals induce transient folding and activation of the
twister ribozyme. Nat. Chem. Biol. 2017, 13, 1109–1114. [CrossRef]
10. Kolte, D.; Vijayaraghavan, K.; Khera, S.; Sica, D.A.; Frishman, W.H. Role of magnesium in cardiovascular
diseases. Cardiol. Rev. 2014, 22, 182–192. [CrossRef]
11. Golshani-Hebroni, S. Mg(++) requirement for MtHK binding, and Mg(++) stabilization of mitochondrial
membranes via activation of MtHK & MtCK and promotion of mitochondrial permeability transition pore
closure: A hypothesis on mechanisms underlying Mg(++)’s antioxidant and cytoprotective effects. Gene
2016, 581, 1–13.
12. Gröber, U.; Schmidt, J.; Kisters, K. Magnesium in prevention and therapy. Nutrients 2015, 23, 8199–8226.
[CrossRef]
13. Swaminathan, R. Magnesium metabolism and its disorders. Clin. Biochem. Rev. 2003, 24, 47–66.
14. Sarrafzadegan, N.; Khosravi-Boroujeni, H.; Lotfizadeh, M.; Pourmogaddas, A.; Salehi-Abargouei, A.
Magnesium status and the metabolic syndrome: A systematic review and meta-analysis. Nutrition 2016, 32,
409–417. [CrossRef]
15. Del Gobbo, L.C.; Imamura, F.; Wu, J.H.Y.; de Oliveira Otto, M.C.; Chiuve, S.E.; Mozaffarian, D. Circulating
and dietary magnesium and risk of cardiovascular disease: A systematic review and meta-analysis of
prospective studies. Am. J. Clin. Nutr. 2013, 98, 160–173. [CrossRef]
16. Simental-Mendía, L.E.; Sahebkar, A.; Rodríguez-Morán, M.; Guerrero-Romero, F. A systematic review and
meta-analysis of randomized controlled trials on the effects of magnesium supplementation on insulin
sensitivity and glucose control. Pharmacol. Res. 2016, 111, 272–282. [CrossRef]
17. Hruby, A.; Meigs, J.B.; O’Donnell, C.J.; Jacques, P.F.; McKeown, N.M. Higher magnesium intake reduces risk
of impaired glucose and insulin metabolism and progression from prediabetes to diabetes in middle-aged
americans. Diabetes Care 2014, 37, 419–427. [CrossRef]
18. Katsuda, S.; Yasukawa, T.; Nakagawa, K.; Miyake, M.; Yamasaki, M.; Katahira, K.; Mohri, M.; Shimizu, T.; Hazama, A.
Deep-sea water improves cardiovascular hemodynamics in Kurosawa and Kusanagi-hypercholesterolemic (KHC)
rabbits. Biol. Pharm. Bull. 2008, 31, 38–44. [CrossRef]
19. Mizushima, S.; Cappuccio, F.P.; Nichols, R.; Elliott, P. Dietary magnesium intake and blood pressure: A
qualitative overview of the observational studies. J. Hum. Hypertens. 1998, 12, 447–453. [CrossRef]
20. Bak, J.P.; Kim, Y.M.; Son, J.; Kim, C.J.; Kim, E.H. Application of concentrated deep sea water inhibits the
development of atopic dermatitis-like skin lesions in NC/Nga mice. BMC Complement. Altern. Med. 2012,
12, 108. [CrossRef]
21. Ha, B.G.; Park, J.E.; Shin, E.J.; Shon, Y.H. Modulation of glucose metabolism by balanced deep-sea water
ameliorates hyperglycemia and pancreatic function in streptozotocin-induced diabetic mice. PLoS ONE 2014,
9, e102095. [CrossRef]
22. Ha, B.G.; Shin, E.J.; Park, J.E.; Shon, Y.H. Anti-diabetic effect of balanced deep-sea water and its mode of
action in high-fat diet induced diabetic mice. Mar. Drugs 2013, 11, 4193–4212. [CrossRef]
23. Ha, B.G.; Jung, S.S.; Jang, Y.K.; Jeon, B.Y.; Shon, Y.H. Mineral-enriched deep-sea water modulates lactate
metabolism via PGC-1α-mediated metabolic reprogramming. Mar. Drugs 2019, 17, 611. [CrossRef]
24. Suárez, A.; Pulido, N.; Casla, A.; Casanova, B.; Arrieta, F.J.; Rovira, A. Impaired tyrosine-kinase activity of
muscle insulin receptors from hypomagnesaemic rats. Diabetologia 1995, 38, 1262–1270. [CrossRef]
25. Lima Mde, L.; Cruz, T.; Rodrigues, L.E.; Bomfim, O.; Melo, J.; Correia, R.; Porto, M.; Cedro, A.; Vicente, E.
Serum and intracellular magnesium deficiency in patients with metabolic syndrome–evidences for its relation
to insulin resistance. Diabetes Res. Clin. Pract. 2009, 83, 257–262. [CrossRef]Nutrients 2020, 12, 515 14 of 15
26. Barbagallo, M.; Dominguez, L.J.; Galioto, A.; Ferlisi, A.; Cani, C.; Malfa, L.; Pineo, A.; Busardo’, A.; Paolisso, G.
Role of magnesium in insulin action, diabetes and cardio-metabolic syndrome X. Mol. Asp. Med. 2003, 24,
39–52. [CrossRef]
27. Chaudhary, D.P.; Sharma, R.; Bansal, D.D. Implications of magnesium deficiency in type 2 diabetes: A review.
Biol. Trace Elem. Res. 2010, 134, 119–129. [CrossRef]
28. Mooren, F.C.; Krüger, K.; Völker, K.; Golf, S.W.; Wadepuhl, M.; Kraus, A. Oral magnesium supplementation
reduces insulin resistance in non-diabetic subjects—A double-blind, placebo-controlled, randomized trial.
Diabetes Obes. Metab. 2011, 13, 281–284. [CrossRef]
29. Guerrero-Romero, F.; Rodríguez-Morán, M. Magnesium improves the beta-cell function to compensate
variation of insulin sensitivity: Double-blind, randomized clinical trial. Eur. J. Clin. Investig. 2011, 41,
405–410. [CrossRef]
30. Guerrero-Romero, F.; Tamez-Perez, H.E.; González-González, G.; Salinas-Martínez, A.M.; Montes-Villarreal, J.;
Trevino-Ortiz, J.H.; Rodríguez-Morán, M. Oral magnesium supplementation improves insulin sensitivity in
non-diabetic subjects with insulin resistance. A double-blind placebo-controlled randomized trial. Diabetes
Metab. 2004, 30, 253–258. [CrossRef]
31. Hadjistavri, L.S.; Sarafidis, P.A.; Georgianos, P.I.; Tziolas, I.M.; Aroditis, C.P.; Hitoglou-Makedou, A.;
Zebekakis, P.E.; Pikilidou, M.I.; Lasaridis, A.N. Beneficial effects of oral magnesium supplementation on
insulin sensitivity and serum lipid profile. Med. Sci. Monit. 2010, 16, CR307–CR312.
32. Xu, J.; Xu, W.; Yao, H.; Sun, W.; Zhou, Q.; Cai, L. Associations of serum and urinary magnesium with the
pre-diabetes, diabetes and diabetic complications in the Chinese Northeast Population. PLoS ONE 2013,
8, e56750. [CrossRef]
33. Liu, Z.M.; Ho, S.C. The association of serum C-reactive protein, uric acid and magnesium with insulin
resistance in Chinese postmenopausal women with prediabetes or early untreated diabetes. Maturitas 2011,
70, 176–181. [CrossRef]
34. Dong, J.-Y.; Xun, P.; He, K.; Qin, L.-Q. Magnesium intake and risk of type 2 diabetes: Meta-analysis of
prospective cohort studies. Diabetes Care 2011, 34, 2116–2122. [CrossRef]
35. Hata, A.; Doi, Y.; Ninomiya, T.; Mukai, N.; Hirakawa, Y.; Hata, J.; Ozawa, M.; Uchida, K.; Shirota, T.;
Kitazono, T.; et al. Magnesium intake decreases type 2 diabetes risk through the improvement of insulin
resistance and inflammation: The Hisayama Study. Diabet. Med. 2013, 30, 1487–1494. [CrossRef]
36. Veronese, N.; Watutantrige-Fernando, S.; Luchini, C.; Solmi, M.; Sartore, G.; Sergi, G.; Manzato, E.;
Barbagallo, M.; Maggi, S.; Stubbs, B. Effect of magnesium supplementation on glucose metabolism in people
with or at risk of diabetes: A systematic review and meta-analysis of double-blind randomized controlled
trials. Eur. J. Clin. Nutr. 2016, 70, 1354–1359. [CrossRef]
37. Mejía-Rodríguez, F.; Shamah-Levy, T.; Villalpando, S.; García-Guerra, A.; Méndez-Gómez Humarán, I. Iron,
zinc, copper and magnesium deficiencies in Mexican adults from the National Health and Nutrition Survey
2006. Salud Publica. Mex. 2013, 55, 275–284. [CrossRef]
38. Ford, E.S. Dietary magnesium intake in a National Sample of U.S. adults. J. Nutr. 2003, 133, 2879–2882.
[CrossRef]
39. Karve, A.; Hayward, R.A. Prevalence, diagnosis, and treatment of impaired fasting glucose and impaired
glucose tolerance in nondiabetic U.S. adults. Diabetes Care 2010, 33, 2355–2359. [CrossRef]
40. Guerrero-Romero, F.; Rodríguez-Morán, M.; Pérez-Fuentes, R.; Sánchez-Guillén, M.C.; González-Ortiz, M.;
Martínez-Abundis, E.; Brito-Zurita, O.; Madero, A.; Figueroa, B.; Revilla-Monsalve, C.; et al. Prediabetes and
its relationship with obesity in Mexican adults: The Mexican Diabetes Prevention (MexDiab) Study. Metab.
Syndr. Relat. Disord. 2008, 6, 15–23. [CrossRef]
41. Schimatschek, H.F.; Rempis, R. Prevalence of hypomagnesemia in an unselected German population of
16,000 individuals. Magnes. Res. 2001, 14, 283–290.
42. Völzke, H.; Alte, D.; Schmidt, C.O.; Radke, D.; Lorbeer, R.; Friedrich, N.; Aumann, N.; Lau, K.; Piontek, M.;
Born, G.; et al. Cohort profile: The study of health in Pomerania. Int. J. Epidemiol. 2011, 40, 294–307.
[CrossRef] [PubMed]
43. Rodríguez-Moran, M.; Guerrero-Romero, F. Oral magnesium supplementation improves the metabolic
profile of metabolically obese, normal-weight individuals: A randomized double-blind placebo-controlled
trial. Arch. Med. Res. 2014, 45, 388–393. [CrossRef] [PubMed]Nutrients 2020, 12, 515 15 of 15
44. Rasic-Milutinovic, Z.; Perunicic-Pekovic, G.; Jovanovic, D.; Gluvic, Z.; Cankovic-Kadijevic, M. Association of
blood pressure and metabolic syndrome components with magnesium levels in drinking water in some
Serbian municipalities. J. Water Health 2012, 10, 161–169. [CrossRef]
© 2020 by the authors. Licensee MDPI, Basel, Switzerland. This article is an open access
article distributed under the terms and conditions of the Creative Commons Attribution
(CC BY) license (http://creativecommons.org/licenses/by/4.0/).You can also read