Effect of an Inflatable Air Mattress with Variable Rigidity on Sleep Quality - MDPI
←
→
Page content transcription
If your browser does not render page correctly, please read the page content below
sensors
Letter
Effect of an Inflatable Air Mattress with Variable
Rigidity on Sleep Quality
Hyunsoo Yu 1 , Oh-Soon Shin 2 , Sayup Kim 3, * and Cheolsoo Park 1, *
 1    Department of Computer Engineering, Kwangwoon University, Seoul 01897, Korea; byeng3@kw.ac.kr
 2    School of Electronic Engineering, Soongsil University, Seoul 07040, Korea; osshin@ssu.ac.kr
 3    Human Convergence R&D Department, Korea Institute of Industrial Technology, Ansan 15588, Korea
 *    Correspondence: sayub@kitech.re.kr (S.K.); parkcheolsoo@kw.ac.kr (C.P.)

 Received: 4 August 2020; Accepted: 14 September 2020; Published: 17 September 2020

 Abstract: Several studies, wherein the structure or rigidity of a mattress was varied, have been
 conducted to improve sleep quality. These studies investigated the effect of variation in the surface
 characteristics of mattresses on sleep quality. The present study developed a mattress whose rigidity
 can be varied by controlling the amount of air in its air cells. To investigate the effect of the variable
 rigidity of the air mattress on sleep quality, participants (Male, Age: 23.9 ± 2.74, BMI: 23.3 ± 1.60)
 were instructed to sleep on the air mattress under different conditions, and their sleep quality
 was subjectively and objectively investigated. Subjectively, sleep quality is assessed based on the
 participants’ evaluations of the depth and length of their sleep. Objectively, sleep is estimated using
 the sleep stage information obtained by analysing the movements and brain waves of the participants
 during their sleep. A subjective assessment of the sleep quality demonstrates that the participants’
 sleep was worse with the adjustment of the air mattress than that without; however, the objective
 sleep quality results demonstrates an improvement in the sleep quality when the rigidity of the air
 mattress is varied based on the participant’s preference. This paper proposes a design for mattresses
 that can result in more efficient sleep than that provided by traditional mattresses.

 Keywords: sleep; mattress; sleep quality; brain wave; sleep scoring; sleep experiment; rigidity of
 mattress; mattress design

1. Introduction
     Most people spend one-third of their lives sleeping [1]. Furthermore, sleep is essential to maintain
good health as it helps revitalize and re-energize the body [2–4]. In addition, sleep is associated
with weight management and longevity [5–7], and sleep quality is associated with self-report health,
mood regulation, as well as feelings of anger, confusion, anxiety, and depression [8–12]. In industry,
poor sleep quantity leads to high injury rates and loss of productivity [13–15]. Consequently, sufficient
sleep as well as good sleep quality are critical to ensure good health and overall quality of life [16].
However, Robins et al. reported that solely 19.22% of the adults in the world exhibit good sleep
quality [17].
     Sleep quality is directly related to health and sleepiness [10]. The key feature of insomnia,
which can lead to impairment of immune function [18], cardiac diseases [19], and neurodegenerative
disorders [20], is sleep quality [21]. Sleep deficiency results in not only poor health, but also degradation
of mental and social functioning [22]. Moreover, poor sleep quality has a negative effect on work
productivity and safety [23,24]. Therefore, increasing sleep quality could considerably improve one’s
health and quality of life, as well as their productivity at work.
     To improve sleep quality, various mattresses have been designed in existing studies [25–27].
In a few studies, a thermal controlling device was applied to the developed mattress to improve

Sensors 2020, 20, 5317; doi:10.3390/s20185317                                  www.mdpi.com/journal/sensors
Sensors 2020, 20, 5317                                                                                2 of 16

the sleep quality of the users [28–31]; others studies have determined the relation between sleep
quality and the rigidity of a mattress [27,32,33]. Furthermore, several studies have varied the materials
used to design the mattress and have modified its structure [34–36]. Some studies investigated users’
preferences on mattresses, where Kim et al. proposed a methodology for finding the appropriate
hardness based on various analyzes that measure the users’ experiences with mattresses and found
their preferences to different types of mattress comfort were consistent with the outcomes using
their methodology [37]. Park et al. investigated the users’ preferences to various mattress shapes
corresponding to their postures lying on the mattresses and found that subjective sleeping comfort
is related to bed adjustment [38]. In particular, Yoshida et al. reported that there is a relationship
between the subjective preference and the stress distribution exerted on the body when a user lies on a
mattress [39]. Based on this study, we hypothesized that a mattress customized according to the user’s
preference would improve the quality of sleep.
      This paper introduces an air mattress whose rigidity can be varied corresponding to the preference
of the users. Experiments were conducted to evaluate the effect of the proposed mattress on the quality
and quantity of the sleep of its users. These indices are measured based on the users’ subjective sleep
assessment and objective sleep scoring index, which are estimated via electroencephalogram (EEG)
and accelerometer measurements.

2. Methodology

2.1. Study Design
     Three conditions were set, as shown in Figure 1, to vary the pressure of the air cells in the mattress.
This experiment was conducted to compare sleep quality under three different mattress conditions.
Under Condition A, three air cells were completely filled with air and their internal pressures were
maintained at 25 kPa. Under Condition S, only the pressure of the air cell at the shoulder was varied
corresponding to the user’s preference, and the other two air cells were completely filled. On average,
the preferred pressure of the cell at the shoulder was 14.2 ± 4.4 kPa across the participants. Under the
SH condition, only the air cell at the legs was completely filled, and the pressures of the other air cells
were customized by the participants. The preferred pressures of the cells at the shoulder and hip were
15.8 ± 6.4 kPa and 15.2 ± 5.5 kPa, respectively.
     This experiment was approved by the Institutional Review Board of Seoul National University
(IRB No. 1906-003-016).

2.2. Participants
     To score the sleep quality of the participants, EEG and accelerometer data were recorded for
10 male adults who agreed to participate in the experiments. Their ages were 23.9 ± 2.74 and ranges
from 21 to 28. Gender was controlled as male following a study that gender could affect sleep
quality [40]. The manufactured mattress and air cells were more fit for the body size of the average
Korean male, so males were recruited priory in this study. When recruiting participants, they were
interviewed to determine whether they met the inclusion and exclusion criteria. The inclusion
criterion was that the height is within the range of 170 to 175 cm to fit the size of the mattress.
The exclusion criterion was that the participant may be at risk of leaving the mattress due to a bad
sleeping habit. Participants with poor sleeping habits were excluded through screening interviews,
as Tang et al. did [41]. The average of their BMI scores was 23.3 ± 1.60, and ranges from 20.76 to 25.95.
Their Pittsburgh Sleep Quality Index (PSQI) score, which is a self-report questionnaire that assesses
sleep quality over a month with a score from 0 to 21, was 5.6 ± 2.22 and the range of their PSQI score
was 2 to 10 [42]. Among the participants, there were 5 poor sleepers with a PSQI score higher than 5.
To ensure that the participants’ sleep quality was not affected by other factors, the participants were
forbidden from consuming caffeine and alcohol for 48 h before the experiment [43,44]. In addition,
participants who violate the above policy were excluded from the experiment on the same day through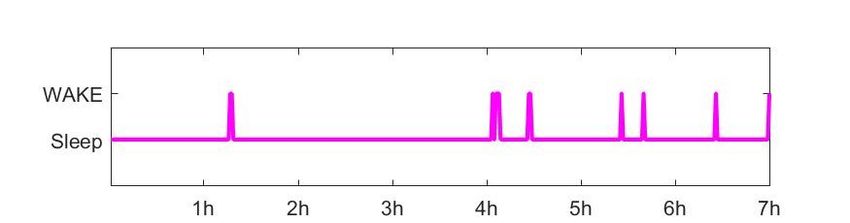
Sensors 2020, 20, 5317                                                                                     3 of 16

a screening interview before the experiment as Tang et al. did [45]. Second, participants finished
their dinners before 7 p.m., had a shower between 9 and 10 p.m., and went to bed at 11 p.m. Lastly,
each participant had a gap of 48 h between experiments to ensure that sleep under one mattress
condition did not affect sleep under another mattress condition.

                                                       (a)

                                                       (b)

                                                       (c)

      Figure 1. (a) Completely filled with pressure condition (A), (b) Shoulder customized condition (S);
      the customized pressure of the air cell at the shoulder was 14.2 ± 4.4 kPa and (c) Shoulder—hip
      customized condition (SH); the customized pressure of the air cell at the shoulder was 15.8 ± 6.4 kPa,
      and the customized pressure of the air cell at the hip was 15.2 ± 5.5 kPa.

2.3. Materials
     A mattress was developed whose height could be varied by controlling three same-sized air cells
in the mattress, as shown in Figure 2. The three air cells are located on the shoulder, hip, and legs of
the participants. The size of the air cells and the mattress were designed to fit an average Korean male
body [46]. The air cells are covered by latex foam, which is in turn covered by a layer of a bed sheet.
The pressures of the air cells are varied using a control box hosed to the air cells, which decides the
height of the mattress.
Sensors 2020, 20, 5317 4 of 16
Figure 2. Location and size of air cells in the mattress.
2.4. Procedure
In this study, sleep scoring was not conducted through polysomnography (PSG), but was
conducted through the estimation using a single channel EEG according to [47–49]. As shown in
Figure 3, four Ag/Ag-Cl electrodes were attached to positions FP1, FP2, A2, and A1 on the participants’
head. The electrodes at positions FP1 and FP2 record the EEG signals; the electrode at position
A2 serves as a reference; and the electrode at position A1 is grounded. The two devices used to
acquire EEG were BIOPAC MP36 (BIOPAC Systems Inc, Goleta, CA, USA), whose sampling rate
was set to 500 Hz, and g.USBamp amplifier (g.tec medical engineering GmbH, Schiedlberg, Austria),
whose sampling rate was 600 Hz. In addition, the participants wore wGT3X-BT (ActiGraph LLC,
Pensacola, FL, USA) on their wrists such that their movement could be monitored; the sampling rate
of the device was 100 Hz.
Figure 3. Positions of the attached electrodes.
To avoid the first night effect [50], all participants slept at the laboratory in the same environment
with attaching all electrodes before the actual experiment. The experiment was conducted on three
days, and one of three different mattress conditions was considered randomly for each day. Figure 4Sensors 2020, 20, 5317 5 of 16
shows the procedure of the experiment. On the first day, all the participants answered the PSQI
questionnaire before going to bed. Before the electrodes were attached to their respective positions,
their exfoliation was removed such that the maximum impedance was 5 kΩ [51]. As shown in Figure 4,
the participant had a 10 min adaption time lying on the mattress [52,53]. The participants went to bed at
11 p.m. and slept for 7 h in a room where the temperature and humidity were maintained at 24 ◦ C and
50% RH, respectively. After waking up at 6 am, the participants responded to a questionnaire designed
to help subjectively evaluate their sleep quality. The questionnaire comprised two questions regarding
‘Sleep Length’ and ‘Sleep Depth’, which are the question number 5 and 8 in the “sleep diary” presented
by Åkerstedt et al. [54]. For more detailed analysis than the original questionnaire, the selection range
was widened from 5 to 7, i.e., a range of 1–7.
Figure 4. Experimental schedule for a night’s sleep.
2.5. Sleep Scoring Algorithm
Subjective sleep assessment was conducted through questionnaires. The length information of
each sleep stage was obtained from a hypnogram, as an objective sleep evaluation, where the duration
of REM and Deep stages (slow wave sleep, SWS) are the length information of the stages, conventionally
used to measure the sleep quality [55]. REM stage maintains the necessary levels of central nervous
system activities, promotes a recovery with providing periodic stimulation to the brain [56] and
preserves emotional memory sources selectively [57]. SWS induces an endocrine environment that
could strongly support the initiation of an adaptive immune response and cleans metabolites [58].
Additionally, RNR (REM to Non-REM ratio) and SSI (Stage Shift index) were calculated as sleep indices
corresponding to the sleep quality. Mendonca et al. reported that the higher RNR and the lower SSI
result in the improvement of sleep quality [55]. RNR is an index representing the ratio of the duration
of the REM stage to that of the non-REM stage, as shown in Equation (1). SSI is an index obtained by
dividing the number of times the sleep stage shift during whole sleep by the total sleep time (TST),
as shown in Equation (2).
Σ REM (min)
RNR(%) = (1)
Σ nonREM (min)
Σ Sleep Stage Shi f t
SSI = (2)
TST (h)
To estimate the lengths of the sleep stages, an automatic sleep scoring algorithm is employed,
which was introduced in a study by Onton et al. [49,59]. Onton et al. acquired EEG signals from
the FP1-A2 and FP2-A2 channels. The signals of one channel were then classified, in terms of 30-s
epoch units, into five sleep stages. This was realized by employing the hidden Markov model (HMM)
algorithm along with Viterbi and expectation-maximization (EM) algorithms, in an unsupervised
manner [60]. The hypnograms of the sleep stages were then estimated. In this study, N1 and N2 were
merged to form a Light sleep stage and N3 was considered to be a Deep sleep stage, reducing the
number of whole stages from five to four.
A single-channel EEG signal was segmented into 30-s epochs, which served as input to the HMM
algorithm [61]; further, the frequency band powers of these epochs were calculated after being filtered
using wavelet transform [49,62,63] (Wake: 35–50 Hz, REM: 20–30 Hz, Light: 10.15–15.75 Hz and Deep:
1–3 Hz). There are three parameters for the HMM algorithm, which are an initial probability (π),
a transition matrix (Q), and an emission matrix (R). Since an initial sleep stage always starts withSensors 2020, 20, 5317 6 of 16
the participant being awake, referring to the paper by Lo et al. [64], the initial probability (π0 ) was
set as Equation (3) and the initial transition matrix (Q0 ) of the HMM algorithm was initialized as
Equation (4). In Equation (4), the element q(i, j) in the matrix represents the probability of transition
from the stage i to the stage j on the next time step. The emission matrix (R) comprises the mean (µ) and
standard deviation matrices (σ). The mean of the initial emission matrix (µ0 ) was set as Equation (5).
Please note that the probability of one particular frequency band corresponding to a sleep stage (see the
diagonal terms in Equation (5)) is higher than those of the others, which was initial expected based
on a study by Onton et al. [49]. The standard deviation of the initial emission matrix (σ0 ) was set as
Equation (6). The parameters (π, Q, R) were updated using the EM algorithm [65], after which the
Viterbi algorithm provides estimations of the sleep stages based on the maximum posteriori [66].
h i
π0 = 1 0 0 0 (3)
q(W, W ) q(W, R) q(W, L) q(W, D ) 0.75 0.01 0.24 0
q( R, W ) q( R, R) q( R, L) q( R, D )
0.05 0.88 0.07 0
Q0 = = (4)
q( L, W ) q( L, R) q( L, L) q( L, D ) 0.18 0.11 0.55 0.16
q( D, W ) q( D, R) q( D, L) q( D, D ) 0.02 0 0.14 0.84
0.7 0.1 0.1 0.1
0.1 0.7 0.1 0.1
µ0 = (5)
0.1 0.1 0.7 0.1
0.1 0.1 0.1 0.7
1 0 0 0
0 1 0 0
σ0 = (6)
0 0 1 0
0 0 0 1
To validate the HMM algorithm as an automatic sleep scoring method, we obtained a public
data set, Sleep-EDF Database Expanded (Sleep-EDFx), containing two EEG channels (Fpz-Cz and
Pz-Oz), an electrooculogram (EOG), and an electromyogram (EMG) recorded at a sampling rate of
100 Hz [67,68]. According to the Rechtschaffen and Kales manuals, well-trained technicians manually
scored the sleep stages, and thus, the Sleep-EDFx includes all the sleep stages, including wake, REM,
S1, S2, S3, and S4. To calculate sleep quality for this data set, S1 and S2 are combined into the light sleep
stage, S3 and S4 into Deep stage, reducing the six stages to four: wake, REM, Light, and Deep stages.
The accelerometer data were analyzed using the Sadeh algorithm [69], implemented in ActiLife6
(ActiGraph LLC, Pensacola, FL, USA) software, which estimates sleep and wake states. Sleep efficiency
(SE) could be calculated using the formula, SE = Sleep/(Sleep + Wake), based on the estimation of the
sleep and wake states. In addition, sleep onset latency (SOL) which is time taken to sleep, wake after
sleep onset (WASO) which is total waking time after sleep, and total sleep time (TST) which is total
sleep time during time in bed could also be obtained from the actigraphy information [70].
2.6. Analyses
To investigate how the proposed mattress affects the quality of sleep, a subjective sleep assessment
and objective sleep evaluation were conducted. The subjective sleep assessment was conducted with a
questionnaire written about the depth and length of sleep experienced by the participants. To analyze
the condition of each mattress, comparative analysis among three different mattress conditions was
conducted on the subjective sleep assessment under each mattress condition.
Objective sleep evaluation was conducted with various sleep parameters which obtained from
actigraphy and EEG analysis. There are two methods for determining the sleep and wake states,
which is a binary decision, using actigraphy analysis and EEG analysis as shown in Figure 5a,b. We canSensors 2020, 20, 5317 7 of 16
get two indices each that can be obtained with wake information such as SE, TST, SOL, and WASO.
In this study, comparative analysis is conducted to see how the above indices are affected by the
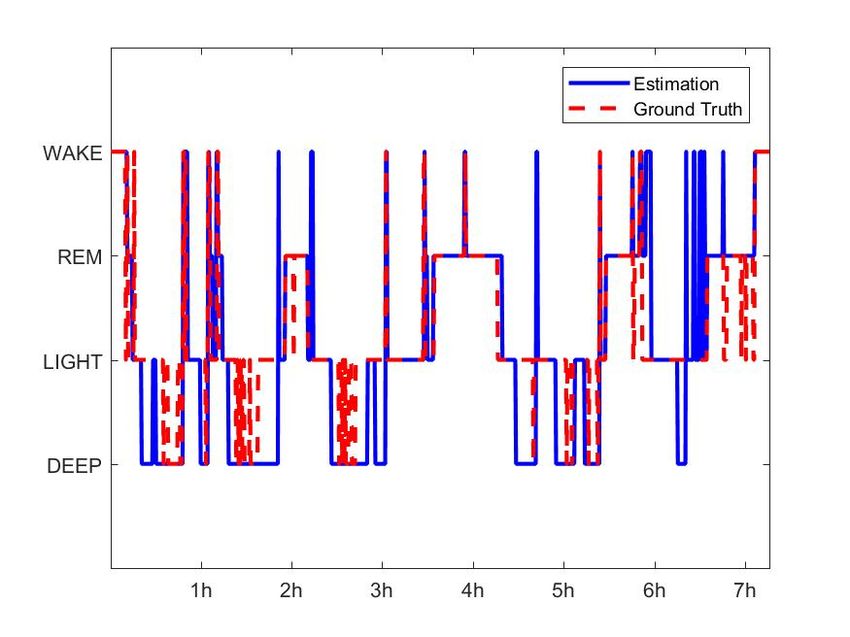
mattress conditions. A hypnogram was estimated using the HMM algorithm, as shown in Figure 5b,
and sleep parameters such as the length of REM and Deep, RNR, and SSI were obtained from the
estimated hypnogram. A comparative analysis was conducted to investigate these sleep parameters
depending on the three mattress conditions.
(a)
(b)
Figure 5. The estimated hypnogram using the (a) Sadeh algorithm from the actigraph and (b) HMM
algorithm from EEG.
Since the number of participants in our study is 10, which is less than 30 samples, statistical
analysis is performed for validation by nonparametric analysis rather than parametric analysis.
Since the results of those sleep parameters in each mattress condition, indicate the conclusion of
this study, a nonparametric wilcoxon signed-rank test was conducted between the base condition,
A condition, and the condition with the highest score among S and SH condition [71].
There were five poor sleepers with a PSQI score higher than 5, so 10 subjects were divided into
5 poor sleepers and five good sleepers. A comparative analysis of each sleep index is conducted
between the two groups to compare and analyze how the customized mattress affects the good sleeper
and the poor sleeper.
3. Results
3.1. Sleep Scoring
Figure 6 is an example of the automatic sleep scoring PSG result for the signal of the
Fpz-Cz channel from the public data set, which had 61 participants and a total of 63231 epochs.
Using Equation (7), for the Sleep-EDFx data set, the HMM algorithm yielded an accuracy of 89.72%,
86.97%, 77.15%, and 89.58%, respectively, for the four sleep stages of Wake, REM, Light, and Deep,
corresponding to the PSG. The accuracy was calculated as a percentage of the number of correct epochs
divided by the total number of epochs. In Equation (7), TP, TN, FP, and FN denote true-positive,
true-negative, false-positive, and false-negative, respectively [72]. Using these values, precision, recall,
and F1 scores were also calculated using Equations (8)–(10), and their results for the Sleep-EDFx
data set are summarized in Table 1. The performance of the HMM algorithm in scoring the Wake,
REM, and Deep stages exceeded 85%. Various sleep parameters related in wake, REM, Deep wereSensors 2020, 20, 5317 8 of 16
used to measure sleep quality. Light sleep was not considered to measure sleep quality, and thus,
this algorithm is suitable for comparing sleep quality under different mattress conditions.
TP + TN
Accuracy = (7)
TP + FP + FN + TN
TP
Precision = (8)
TP + FP
TP
Recall = (9)
TP + FN
Precision × Recall
F1 score = 2 × (10)
Precision + Recall
Figure 6. Estimated and true Hypnograms of the Sleep-EDFx public data set (SC4031E0).
Table 1. Accuracy, precision, and recall for all four sleep stages, yielded by the HMM algorithm for the
Sleep-EDFx public data set with 61 participants consisting of 63,231 epochs.
Wake (%) REM (%) Light (%) Deep (%)
Accuracy 87.72 86.97 77.15 89.58
Precision 65.18 61.16 92.02 58.59
Recall 80.52 83.46 60.27 87.19
F1 score 72.05 70.63 72.85 72.09
3.2. Sleep Quality Analysis
After sleeping on different mattresses, the participants qualitatively assessed the length and depth
of their sleep. As shown in Figure 7, the participants evaluated that the sleep under Condition A,
where all air cells were completely filled with pressure, was the deepest and longest. In contrast,
the participants evaluated that their sleep under the SH condition, where the air cells at the shoulder
and hip were customized by the participants’ preference, was the shallowest and shortest. In addition,Sensors 2020, 20, 5317 9 of 16
the subjective evaluation of the sleep length and depth under the S condition, where the air cell at
the shoulder was customized, was conducted. The value assigned by the participants was between
that of the A condition and that of the SH condition. Both of sleep depth and sleep length had
statistical significance between A condition and SH condition (p < 0.05 for sleep depth, and p < 0.01
for sleep length). This finding implies that the participants felt uncomfortable sleeping on the
customized mattresses.
5.4 5.5
5.2
5
5
4.8
Score
Score
4.5
4.6
4.4
4
4.2
4 3.5
3.8
A S SH A S SH
Mattress condition Mattress condition
(a) (b)
Figure 7. Mean and standard error of the subjective evaluations regarding the (a) depth and (b) length
of sleep on different mattresses under different conditions obtained from the questionnaires to
the participants.
As mentioned earlier, the wake and sleep states could be estimated by the participants via the
actigraphy and EEG analyses. Using the results obtained, SE, TST, SOL, and WASO [73–75] could be
calculated to estimate sleep quantity and quality, as summarized in Table 2. These indices contradict
the subjective evaluations. Both the actigraphy and EEG analyses yielded the highest TST under the
SH condition (389.77 with the actigraphy and 315.75 with EEG) inferring the participants slept in the
customized mattress for the longest period. The WASO estimated by both analyses was the shortest
under the SH condition (30.2 by the actigraphy and 97.98 by EEG), which indicates that sleep quality
was better when the air cells located at the shoulder and hip could be customized. In contrast, the SOL,
the period for which the participant is awake before falling asleep, obtained via the EEG analysis
indicates that the participants took the longest time to fall asleep under the SH condition; the SOL
was 7.4. This might be owing to the difference between their general mattress conditions and the SH
mattress condition. Although the actigraphy estimation provides the shortest SOL, this result is not
reliable since the sleep stage is determined only based on the movement of the participants irrespective
of their actual sleep states.
Through the EEG analysis, sleep indices from all sleep stages (Wake, REM, Light and Deep) could
be estimated. Mendonca et al. reported that the higher the lengths of REM sleep, and Deep stages,
and RNR were, the higher sleep quality was, while the lower SSI yielded the better one [55]. In our
experiment, REM period under the customized SH condition was significantly longer than that under
the uncustomized A condition, as shown in Figure 8a, which was tested using wilcoxon signed-rank
test (p < 0.05). Although the length of Deep stage in the A condition was slightly longer than that in SH
condition, there was no statistical significance as shown in Figure 8b. The results of the comparative
analysis of RNR were similar to the trend of those from the REM stage analysis. Significantly higher
RNR in the SH condition was found compared with that in the A condition as shown in Figure 8c
(p < 0.05). Additionally, Figure 8d displays SSI was lower in the SH condition meaning that the sleep
quality was improved compared with the A condition.Sensors 2020, 20, 5317 10 of 16
Table 2. Sleep efficiency (SE), total sleep time (TST), sleep onset latency (SOL), and wake after sleep
onset (WASO) via the actigraphy signal analysis and the EEG signal analysis.
Mean (SD)
A S SH
SE (%) 91.08 (8.82) 91.32 (5.81) 92.80 (6.01)
TST (min) 382.57 (37.04) 383.56 (24.40) 389.77 (25.25)
Actigraphy
SOL (min) 1.1 (0.31) 1.2 (0.62) 1.0 (0)
WASO (min) 36.1 (35.64) 35.6 (24.29) 30.2 (25.33)
SE (%) 74.87 (8.08) 72.54 (9.30) 75.18 (8.30)
TST (min) 314.45 (33.95) 304.66 (39.04) 315.75 (34.86)
EEG
SOL (min) * 4.05 (4.28) 7.33 (13.02) 7.4 (6.32)
WASO (min) 102.63 (34.67) 109.15 (31.53) 97.98 (34.37)
Depth * 5.0 (1.38) 4.7 (1.53) 4.1 (1.25)
Questionnaire
Length ** 5.2 (0.89) 4.8 (1.70) 3.6 (1.47)
Significance codes: * p < 0.05, ** p < 0.01. Significance between A condition and SH condition.
(a) (b)
(c) (d)
Figure 8. A box plot of the (a) duration of REM sleep obtained from the hypnogram estimated via
EEG under different mattress conditions, (b) duration of Deep sleep obtained from the hypnogram
estimated via EEG under different mattress conditions, (c) ratio of REM sleep to Non-Rem sleep (RNR)
from the hypnogram estimated via EEG under different mattress conditions and (d) stage shift index
(SSI) obtained from the hypnogram estimated via EEG under different mattress conditions.Sensors 2020, 20, 5317 11 of 16
The participants we recruited consisted of good and poor sleepers. Since the factors of the above
comparative analysis such as objective sleep and subjective sleep assessment may be affected by the
participants’ usual sleep quality, a comparative analysis was conducted divided into two groups. As a
result, both the good sleeper and the poor sleeper evaluated similar trends for those three mattress
conditions as shown in Table 3. On the other hand, based on the objective sleep evaluation, the results
of REM and RNR of the poor sleepers were higher in the SH condition higher compared with the
A condition, which are tested using the nonparametric wilcoxon signed-rank test (p < 0.01 for the
length of REM stage and p < 0.05 for RNR) as shown in Table 3. Similarly, the poor sleepers had
lower SSI in the SH condition than that in the A condition, inferring the improvement of the sleep
quality, which was statistically significant with p-value less than 0.01. On the other hand, the Deep
stage parameters of the poor sleepers had the higher mean value in the A condition, but it was not
significant compared with those of the other conditions. These results demonstrates that the mattress
we proposed helps improve the sleep quality in terms of REM, RNR and SSI parameters, particularly
for the poor sleepers.
Table 3. Comparison of subjective and objective sleep evaluation between poor sleepers and good sleepers.
Mean (SD)
A S SH
Depth 5.4(1.26) 5.2(1.23) 4.2(1.23)
Subjective
Length * 5.6 (5.16) 5.4 (1.26) 4.6 (1.08)
REM ** 58.03 (12.03) 66.82 (16.94) 81.05 (20.39)
Poor sleeper
Deep 101.08 (17.38) 85.00 (19.01) 84.95 (31.58)
Objective
RNR * 23.87 (8.65) 34.66 (18.32) 36.65 (14.20)
SSI ** 15.23 (8.03) 14.64 (8.01) 8.80 (1.75)
Depth 4.6 (1.43) 4.2 (1.69) 4.0 (1.33)
Subjective
Length ** 4.8 (1.03) 4.2 (1.93) 2.6 (1.08)
REM 73.51 (13.13) 74.51 (22.69) 76.81 (20.14)
Good sleeper
Deep 101.68 (19.52) 105.42 (12.50) 100.03 (17.67)
Objective
RNR 30.79 (6.19) 30.58 (12.31) 33.09 (13.21)
SSI 12.34 (4.90) 13.71 (4.17) 14.03 (6.12)
Significance codes: * p < 0.05, ** p < 0.01. Significance between A condition and SH condition.
4. Discussion
The objective sleep evaluation in Table 3 illustrated significant improvement of sleep quality for
the poor sleepers using the customized mattress was more effective in improving the sleep quality.
However, the good sleepers were not affected by the different conditions of the mattress. This might
be able to their high quality of sleep, which could not have a chance to be improved any further.
In addition, it should be noted that the REM, RNR, and SSI indices in poor sleeper were higher than
those of good sleepers in SH condition, and SSI particularly showed statistical significance. (p < 0.05).
This suggests that even a poor sleeper could improve the sleep quality more than a good sleeper using
the customized sleep environment.
The subjective evaluation demonstrates that the more the mattress was customized, the lower
the sleep quality. However, the objective measure of SE obtained for the completely customized
mattresses yielded the highest value via the actigraphy and EEG analyses. When using Spearman’s
Roh, which calculates the correlation coefficient between the two parameters in a nonparametric
method, a relationship between objective sleep indices and subjective sleep assessment could not
be found, as shown in Table 4. This result indicates that the length and sleep quality assumed by
the participants could differ from the practical experience they had. Tonetti et al. conducted anSensors 2020, 20, 5317 12 of 16
objective sleep evaluation using actigraphic parameters and subjective sleep evaluation using MSQ
questionnaire on spring mattresses and their proposed latex mattresses [34]. The study showed a
discrepancy between the subjective and objective sleep evaluations. Bader et al. conducted an objective
sleep evaluation using sleep parameters obtained from BCG signals and a subjective sleep evaluation
obtained from self-made questionnaires on soft and hard mattresses [32]. In that study, there was also
a discrepancy between the subjective and the objective sleep evaluation. They suggested that there
might be little relationship between the quality of sleep experienced by the participants and the quality
of sleep measured by the existing sleep parameters.
Table 4. The correlation coefficient using Spearman’s Roh between subjective sleep assessment
(Depth, Length) and objective sleep evaluation (SE, TST, SOL, WASO, REM, Deep, RNR, and SSI).
ACT-SE ACT-TST ACT-SOL ACT-WASO REM Deep
Depth −0.2400 −0.2400 −0.0674 0.2269 0.0781 −0.0695
Length −0.1532 −0.1532 0.0024 0.1382 −0.1429 0.1398
EEG-SE EEG-TST EEG-SOL EEG-WASO RNR SSI
Depth 0.2733 0.0163 −0.0717 −0.0137 0.0375 0.0773
Length 0.0419 0.0419 −0.2076 0.0084 −0.1700 −0.1204
This study has several limitations. Their average PSQI is 5.6, which is a higher score than the cut-off
value of PSQI. In other words, the participants were biased by poor sleeper. Also, only 10 participants
were recruited. Since the number of participants was 10, when the participants was divided into two
groups, poor sleeper and good sleeper, there were only 5 people in one group. More meaningful results
could be obtained if more participants are recruited in future study.
Future studies should focus on automating the process to customize the mattress. In this study,
customization was realized based on the feedback of the participants; the experimenters were adjusting
the pressure of the air cells. The control of the pressure in the air cells can be completely automated,
corresponding to the comforts of the users, using additional sensors such as pressure of their bodies on
the mattress. Maximum sleep quality can then be provided to the participants. In addition, the shape
of the mattress needs to be customized in real time. In this study, the air cells were customized and
fixed while the participants were in a supine position, which might discomfort the participants when
they changed their sleep positions. If the shape of the mattress is customized in real time while the
participants slept, their sleep quality could increase.
5. Conclusions
A mattress whole shape that could be customized was proposed in this paper. Furthermore,
its performance for improving sleep quality was investigated. The quantitative results obtained
demonstrated that objective users’ sleep quality on the mattress customized to their preference was
higher than that on the uncustomized mattress. In other words, varying the shape of a mattress based
on users’ preferences affected their sleep quality.
Author Contributions: Conceptualization and methodology, C.P., S.K. and H.Y.; validation and software, H.Y.
and C.P.; formal analysis, H.Y.; investigation, H.Y. and O.-S.S.; resources, S.K. and O.-S.S.; data curation,
H.Y.; writing—original draft preparation, H.Y.; writing—review and editing, C.P.; visualization, H.Y. and S.K.;
supervision, C.P.; project administration, S.K. All authors have read and agreed to the published version of
the manuscript.
Funding: This work was supported by the National Research Foundation of Korea (NRF) grant funded by the
Korea government(MSIT) (NRF-2017R1A5A1015596) and the work reported in this paper was conducted during
the sabbatical year of Kwangwoon University in 2020.
Conflicts of Interest: The authors declare no conflict of interest.Sensors 2020, 20, 5317 13 of 16
Abbreviations
The following abbreviations are used in this manuscript:
BMI Body mass index
EEG electroencephalogram
PSQI Pittsburgh Sleep Quality Index
PSG Polysomnography
FP(1 or 2) Frontal-pole on the location of scalp electrodes
A(1 or 2) Auricular point on the location of scalp electrodes
SWS Slow wave sleep
RNR REM to Non-REM ratio
SSI Stage shift index
SE Sleep efficiency
TST Total sleep time
SOL Sleep onset latency
WASO Wake after sleep onset
EM algorithm expectation-maximization algorithm
HMM Hidden Markov model
EOG Electrooculogram
EMG Electromyogram
REM sleep Rapid eye movement sleep
TP True-positive
TN True-negative
FP False-positive
FN False-negative
BCG Ballistocardiogram
MSQ Mini sleep questionnaire
References
1. Brown, L.K. Can sleep deprivation studies explain why human adults sleep? Curr. Opin. Pulm. Med. 2012,
18, 541–545. [CrossRef]
2. Lammers-van der Holst, H.M.; Kerkhof, G.A. Shift work tolerance and the importance of sleep quality:
A study of police officers. Biol. Rhythm Res. 2015, 46, 257–264. [CrossRef]
3. Shepard, J.W.; Buysse, D.J.; Chesson, A.L.; Dement, W.C.; Goldberg, R.; Guilleminault, C.; Harris, C.D.;
Iber, C.; Mignot, E.; Mitler, M.M.; et al. History of the development of sleep medicine in the United States.
J. Clin. Sleep Med. Off. Publ. Am. Acad. Sleep Med. 2005, 1, 61–82. [CrossRef]
4. Hsu, H.C.; Lin, M.H. Exploring quality of sleep and its related factors among menopausal women.
J. Nurs. Res. 2005, 13, 153–164. [CrossRef] [PubMed]
5. Jean-Louis, G.; Williams, N.J.; Sarpong, D.; Pandey, A.; Youngstedt, S.; Zizi, F.; Ogedegbe, G. Associations
between inadequate sleep and obesity in the US adult population. BMC Public Health 2014, 14, 290. [CrossRef]
6. Grandner, M.A.; Hale, L.; Moore, M.; Patel, N.P. Mortality associated with short sleep duration: The evidence,
the possible mechanisms, and the future. Sleep Med. Rev. 2010, 14, 191–203. [CrossRef]
7. Åkerstedt, T. Psychosocial stress and impaired sleep. Scand. J. Work Environ. Health 2006, 32, 493–501.
[CrossRef]
8. Pailhous, E.; Benoit, O.; Goldenberg, F.; Bouard, G.; Payant, C. Psychological profile and sleep organization
in young subjects with poor quality of sleep. Psychiatry Res. 1988, 26, 327–336. [CrossRef]
9. Weller, L.; Avinir, O. Hassles, uplifts, and quality of sleep. Percept. Mot. Ski. 1993, 76, 571–576. [CrossRef]
10. Pilcher, J.J.; Ginter, D.R.; Sadowsky, B. Sleep quality versus sleep quantity: Relationships between sleep
and measures of health, well-being and sleepiness in college students. J. Psychosom. Res. 1997, 42, 583–596.
[CrossRef]
11. Scott, J.P.; McNaughton, L.R.; Polman, R.C. Effects of sleep deprivation and exercise on cognitive, motor
performance and mood. Physiol. Behav. 2006, 87, 396–408. [CrossRef] [PubMed]Sensors 2020, 20, 5317 14 of 16
12. Lee, K.A.; Ward, T.M. Critical components of a sleep assessment for clinical practice settings. Issues Ment.
Health Nurs. 2005, 26, 739–750. [CrossRef] [PubMed]
13. Chilcott, L.A.; Shapiro, C.M. The socioeconomic impact of insomnia: An overview. Pharm. Econ. 1996,
10, 1–14. [CrossRef] [PubMed]
14. Drake, C.; Richardson, G.; Roehrs, T.; Scofield, H.; Roth, T. Vulnerability to stress-related sleep disturbance
and hyperarousal. Sleep 2004, 27, 285–291. [CrossRef]
15. Hillman, D.R.; Murphy, A.S.; Antic, R.; Pezzullo, L. The economic cost of sleep disorders. Sleep 2006, 29,
299–305. [CrossRef]
16. Mukherjee, S.; Patel, S.R.; Kales, S.N.; Ayas, N.T.; Strohl, K.P.; Gozal, D.; Malhotra, A. An official American
Thoracic Society statement: The importance of healthy sleep: Recommendations and future priorities. Am. J.
Respir. Crit. Care Med. 2015, 191, 1450–1458. [CrossRef]
17. Robbins, R.; Affouf, M.; Seixas, A.; Beaugris, L.; Avirappattu, G.; Jean-Louis, G. Four-Year Trends in Sleep
Duration and Quality: A Longitudinal Study Using Data from a Commercially Available Sleep Tracker.
J. Med. Internet Res. 2020, 22, e14735. [CrossRef]
18. Taylor, D.J.; Lichstein, K.L.; Durrence, H.H. Insomnia as a Health Risk Factor. Behav. Sleep Med. 2003,
227–247. [CrossRef]
19. Brindle, R.C.; Conklin, S.M. Daytime sleep accelerates cardiovascular recovery after psychological stress.
Int. J. Behav. Med. 2012, 19, 111–114. [CrossRef]
20. Palma, J.A.; Urrestarazu, E.; Iriarte, J. Sleep loss as risk factor for neurologic disorders: A review. Sleep Med.
2013, 14, 229–236. [CrossRef]
21. Harvey, A.G.; Stinson, K.; Whitaker, K.L.; Moskovitz, D.; Virk, H. The subjective meaning of sleep quality:
A comparison of individuals with and without insomnia. Sleep 2008, 31, 383–393. [CrossRef] [PubMed]
22. Kyle, S.D.; Morgan, K.; Espie, C.A. Insomnia and health-related quality of life. Sleep Med. Rev. 2010, 14, 69–82.
[CrossRef] [PubMed]
23. Drake, C.L.; Roehrs, T.; Roth, T. Insomnia causes, consequences, and therapeutics: An overview.
Depress. Anxiety 2003, 18, 163–176. [CrossRef] [PubMed]
24. Jacobson, B.H.; Gemmell, H.A.; Hayes, B.M.; Altena, T.S. Effectiveness of a selected bedding system on
quality of sleep, low back pain, shoulder pain, and spine stiffness. J. Manip. Physiol. Ther. 2002, 25, 88–92.
[CrossRef] [PubMed]
25. Jacobson, B.H.; Wallace, T.; Gemmell, H. Subjective rating of perceived back pain, stiffness and sleep quality
following introduction of medium-firm bedding systems. J. Chiropr. Med. 2006, 5, 128–134. [CrossRef]
26. Lee, H.; Park, S. Quantitative effects of mattress types (comfortable vs. uncomfortable) on sleep quality
through polysomnography and skin temperature. Int. J. Ind. Ergon. 2006, 36, 943–949. [CrossRef]
27. Jacobson, B.H.; Wallace, T.J.; Smith, D.B.; Kolb, T. Grouped comparisons of sleep quality for new and
personal bedding systems. Appl. Ergon. 2008, 39, 247–254. [CrossRef]
28. Li, X.; Zhou, B.; Shen, L.; Wu, Z. Exploring the effect of mattress cushion materials on human–mattress
interface temperatures, pre-sleep thermal state and sleep quality. Indoor Built Environ. 2020, 1–15. [CrossRef]
29. Lan, L.; Tsuzuki, K.; Liu, Y.F.; Lian, Z.W. Thermal environment and sleep quality: A review. Energy Build.
2017, 149, 101–113. [CrossRef]
30. Moon, I.; Kang, S.J.; Kim, G.S.; Mun, M.S. Control of air-cell mattress for preventing pressure ulcer based
on approximate anthropometric model. In Proceedings of the 2005 IEEE 9th International Conference on
Rehabilitation Robotics, Chicago, IL, USA, 28 June–1 July 2005; pp. 164–167. [CrossRef]
31. Li, X.; Shen, L.; Califano, R. The comparative study of thermal comfort and sleep quality for innovative
designed mattress in hot weather. Sci. Technol. Built Environ. 2020, 26, 643–657. [CrossRef]
32. Bader, G.G.; Engdal, S. The influence of bed firmness on sleep quality. Appl. Ergon. 2000, 31, 487–497.
[CrossRef]
33. Kovacs, F.M.; Abraira, V.; Peña, A.; Martín-Rodríguez, J.G.; Sánchez-Vera, M.; Ferrer, E.; Ruano, D.; Guillén, P.;
Gestoso, M.; Muriel, A.; et al. Effect of firmness of mattress on chronic non-specific low-back pain:
Randomised, double-blind, controlled, multicentre trial. Lancet 2003, 362, 1599–1604. [CrossRef]
34. Tonetti, L.; Martoni, M.; Natale, V. Effects of different mattresses on sleep quality in healthy subjects:
An actigraphic study. Biol. Rhythm Res. 2011, 42, 89–97. [CrossRef]
35. Okamoto, K.; Nakabayashi, K.; Mizuno, K.; Okudaira, N. Effects of truss mattress upon sleep and bed
climate. Appl. Hum. Sci. J. Physiol. Anthropol. 1998, 17, 233–237. [CrossRef] [PubMed]Sensors 2020, 20, 5317 15 of 16
36. Wu, F.G.; Shen, T.Y.; Tan, S.H. An innovative Mattress design to improve sleep quality and thermal comfort.
In International Conference on Human-Computer Interaction; LNCS 10902; Springer: Cham, Switzerland, 2018;
pp. 228–237. [CrossRef]
37. Kim, J.Y.; Min, S.N.; Lee, M.H.; Jeong, J.H.; An, J.H.; Shin, Y.S. Measurement of user experience to select
a comfortable mattress. In International Conference of Design, User Experience, and Usability; 6770 LNCS;
Springer: Berlin/Heidelberg, Germany, 2011; pp. 449–458. [CrossRef]
38. Park, S.J.; Kim, J.S.; Kim, C.B. Comfort evaluation and bed adjustment according to sleeping positions.
Hum. Factors Ergon. Manuf. Serv. Ind. 2009, 19, 145–157. [CrossRef]
39. Yoshida, H.; Kamijo, M.; Shimizu, Y. A Study to Investigate the Sleeping Comfort of Mattress using Finite
Element Method. Kansei Eng. Int. J. 2012, 11, 155–162. [CrossRef]
40. Doi, Y.; Minowa, M.; Uchiyama, M.; Okawa, M. Subjective sleep quality and sleep problems in the general
Japanese adult population. Psychiatry Clin. Neurosci. 2001, 55, 213–215. [CrossRef]
41. Tang, N.K.; Anne Schmidt, D.; Harvey, A.G. Sleeping with the enemy: Clock monitoring in the maintenance
of insomnia. J. Behav. Ther. Exp. Psychiatry 2007, 38, 40–55. [CrossRef]
42. Buysse, D.J.; Reynolds, C.F.; Monk, T.H.; Berman, S.R.; Kupfer, D. The Pittsburgh Sleep Quality Index:
A New Instrument for Psychiatric Practice and Research. Psychiatry Res. 1989, 28, 193–213. [CrossRef]
43. Landolt, H.P.; Dijk, D.J.; Gaus, S.E.; Borbély, A.A. Caffeine reduces low-frequency delta activity in the human
sleep EEG. Neuropsychopharmacology 1995, 12, 229–238. [CrossRef]
44. Ebrahim, I.O.; Shapiro, C.M.; Williams, A.J.; Fenwick, P.B. Alcohol and Sleep I: Effects on Normal Sleep.
Alcohol. Clin. Exp. Res. 2013, 37, 539–549. [CrossRef] [PubMed]
45. Tang, N.K.; Harvey, A.G. Effects of cognitive arousal and physiological arousal on sleep perception. Sleep
2004, 27, 69–78. [CrossRef] [PubMed]
46. Kim, Y. The 7th Size Korea Project; Technical Report; Agency for Technology and Standards, Chemistry and
Service Standards Division, Korea, 10 December 2015. Available online: https://sizekorea.kr/page/report/1
(accessed on 16 September 2020).
47. Hassan, A.R.; Bhuiyan, M.I.H. Automated identification of sleep states from EEG signals by means
of ensemble empirical mode decomposition and random under sampling boosting. Comput. Methods
Programs Biomed. 2017, 140, 201–210. [CrossRef]
48. Sors, A.; Bonnet, S.; Mirek, S.; Vercueil, L.; Payen, J.F. A convolutional neural network for sleep stage scoring
from raw single-channel EEG. Biomed. Signal Process. Control 2018, 42, 107–114. [CrossRef]
49. Onton, J.A.; Kang, D.Y.; Coleman, T.P. Visualization of whole-night sleep EEG from 2-channel
mobile recording device reveals distinct deep sleep stages with differential electrodermal activity.
Front. Hum. Neurosci. 2016, 10, 605. [CrossRef]
50. Herbst, E.; Metzler, T.J.; Lenoci, M.; McCaslin, S.E.; Inslicht, S.; Marmar, C.R.; Neylan, T.C. Adaptation effects
to sleep studies in participants with and without chronic posttraumatic stress disorder. Psychophysiology
2010, 47, 1127–1133. [CrossRef] [PubMed]
51. Teplan, M. Fundamentals of eeg measurement. Meas. Sci. Rev. 2002, 2, 1–11.
52. Verhaert, V.; Haex, B.; de Wilde, T.; Berckmans, D.; Verbraecken, J.; de Valck, E.; van der Sloten, J. Ergonomics
in bed design: The effect of spinal alignment on sleep parameters. Ergonomics 2011, 54, 169–178. [CrossRef]
53. Xia, L.; Lan, L.; Tang, J.; Wan, Y.; Lin, Y.; Wang, Z. Bed heating improves the sleep quality and health of the
elderly who adapted to no heating in a cold environment. Energy Build. 2020, 210, 109687. [CrossRef]
54. Åkerstedt, T.; Hume, K.; Minors, D.; Waterhouse, J. The meaning of good sleep: A longitudinal study of
polysomnography and subjective sleep quality. J. Sleep Res. 1994, 3, 152–158. [CrossRef]
55. Mendonça, F.; Mostafa, S.S.; Morgado-Dias, F.; Ravelo-Garcia, A.G.; Penzel, T. A Review of Approaches for
Sleep Quality Analysis. IEEE Access 2019, 7, 24527–24546. [CrossRef]
56. Vertes, R.P.; Eastman, K.E. The case against memory consolidation in REM sleep. Behav. Brain Sci. 2000,
23, 867–876. [CrossRef]
57. Sopp, M.R.; Michael, T.; Weeß, H.G.; Mecklinger, A. Remembering specific features of emotional events
across time: The role of REM sleep and prefrontal theta oscillations. Cogn. Affect. Behav. Neurosci. 2017,
17, 1186–1209. [CrossRef]
58. Léger, D.; Debellemaniere, E.; Rabat, A.; Bayon, V.; Benchenane, K.; Chennaoui, M. Slow-wave sleep:
From the cell to the clinic. Sleep Med. Rev. 2018, 41, 113–132. [CrossRef] [PubMed]Sensors 2020, 20, 5317 16 of 16
59. Onton, J.A.; Matthews, S.C.; Kang, D.Y.; Coleman, T.P. In-home sleep recordings in military veterans with
posttraumatic stress disorder reveal less REM and deep sleepYou can also read