Quantitative Susceptibility Mapping of Venous Vessels in Neonates with Perinatal Asphyxia - American Journal of Neuroradiology
←
→
Page content transcription
If your browser does not render page correctly, please read the page content below
Published April 1, 2021 as 10.3174/ajnr.A7086

                                                                                                                                      ORIGINAL RESEARCH
                                                                                                                                                 PEDIATRICS

           Quantitative Susceptibility Mapping of Venous Vessels in
                                  Neonates with Perinatal Asphyxia
                                                                                          A.M. Weber,          Y. Zhang,        C. Kames, and        A. Rauscher

      ABSTRACT
      BACKGROUND AND PURPOSE: Cerebral venous oxygen saturation can be used as an indirect measure of brain health, yet it often
      requires either an invasive procedure or a noninvasive technique with poor sensitivity. We aimed to test whether cerebral venous
      oxygen saturation could be measured using quantitative susceptibility mapping, an MR imaging technique, in 3 distinct groups:
      healthy term neonates, injured term neonates, and preterm neonates.

      MATERIALS AND METHODS: We acquired multiecho gradient-echo MR imaging data in 16 neonates with perinatal asphyxia and
      moderate or severe hypoxic-ischemic encephalopathy (8 term age: average, 40.0 [SD, 0.8] weeks’ gestational age; 8 preterm, 33.5
      [SD, 2.0] weeks’ gestational age) and in 8 healthy term-age controls (39.3 [SD, 0.6] weeks, for a total of n ¼ 24. Data were postpro-
      cessed as quantitative susceptibility mapping images, and magnetic susceptibility was measured in cerebral veins by thesholding
      out 99.95% of lower magnetic susceptibility values.

      RESULTS: The mean magnetic susceptibility value of the cerebral veins was found to be 0.36 (SD, 0.04) ppm in healthy term neo-
      nates, 0.36 (SD, 0.06) ppm in term injured neonates, and 0.29 (SD, 0.04) ppm in preterm injured neonates. Correspondingly, the
      derived cerebral venous oxygen saturation values were 73.6% (SD, 2.8%), 71.5% (SD, 7.4%), and 72.2% (SD, 5.9%). There was no statis-
      tically significant difference in cerebral venous oxygen saturation among the 3 groups (P ¼ .751).

      CONCLUSIONS: Quantitative susceptibility mapping–derived oxygen saturation values in preterm and term neonates agreed well
      with values in past literature. Cerebral venous oxygen saturation in preterm and term neonates with hypoxic-ischemic encephalop-
      athy, however, was not found to be significantly different between neonates or healthy controls.

      ABBREVIATIONS: x ¼ magnetic susceptibility; CSaO2 ¼ cerebral arterial oxygen saturation; CSvO2 ¼ cerebral venous oxygen saturation; Hct ¼ hematocrit;
      HIE ¼ hypoxic-ischemic encephalopathy; NIRS ¼ near-infrared resonance spectroscopy; QSM ¼ quantitative susceptibility mapping; SSS ¼ superior sagittal
      sinus; TRUST ¼ T2-relaxation-under-spin tagging

                                                                                   1.5 per 1000 live births2 and is the fifth leading cause of death
P   erinatal asphyxia is the condition resulting from the depriva-
    tion of oxygen to a neonate and can lead to brain tissue dam-
age or death. Asphyxia at birth can affect virtually any organ, but
                                                                                   worldwide in children younger than 5 years of age (8%).3
                                                                                       Currently, the severity of HIE is mainly assessed by clinical pa-
the brain is of the highest concern because it is the least likely to              rameters and conventional MR imaging and can be classified into
quickly or completely heal.1 Hypoxic-ischemic encephalopathy                       mild, moderate, or severe categories.4,5 While identifying HIE in
(HIE) occurs when the entire brain is deprived of an adequate                      term infants is generally well-characterized, its identification in pre-
supply of oxygen and can result in neurologic disability, such as                  term infants remains complex, with variable inclusion criteria being
cerebral palsy, mental retardation, and epilepsy. HIE occurs in                    discussed and reported.6-9 More accurate markers would be useful

Received December 7, 2020; accepted after revision January 14, 2021.
                                                                                   A.M. Weber was supported by a British Columbia Children’s Hospital Research
From the Division of Neurology (A.M.W., A.R.), Department of Pediatrics and        Institute, M.I.N.D. postdoctoral fellowship. A. Rauscher is supported by Canada
University of British Columbia MRI Research Centre (A.M.W., C.K., A.R.),           Research Chairs and a Natural Sciences and Engineering Council of Canada grant
Department of Physics and Astronomy (C.K., A.R.), and Department of Radiology      (402039-2011, RGPIN-2016-05371).
(A.R.), University of British Columbia, Vancouver, British Columbia, Canada;
                                                                                   Please address correspondence to Alexander Mark Weber, PhD, BC Children's
Department of Radiology (Y.Z.), Children’s Hospital of Chongqing Medical
                                                                                   Hospital Research Institute, Variety Building, Room 370B, 950 West 28th Ave,
University, Chongqing, China; Ministry of Education Key Laboratory of Child
                                                                                   Vancouver, BC, Canada V5Z 4H4; e-mail: alex.weber@ubc.ca; @AlexMarkWeber
Development and Disorders (Y.Z.), Chongqing, China; Key Laboratory of Pediatrics
in Chongqing (Y.Z.), Chongqing, China; Chongqing International Science and              Indicates open access to non-subscribers at www.ajnr.org
Technology Cooperation Center for Child Development and Disorders (Y.Z.),
Chongqing, China.                                                                       Indicates article with online supplemental data.
A.M. Weber and Y. Zhang contributed equally to this work.                          http://dx.doi.org/10.3174/ajnr.A7086

                                                                                                   AJNR Am J Neuroradiol :           2021   www.ajnr.org          1

                                      Copyright 2021 by American Society of Neuroradiology.
for detection, classification, early therapeutic interventions, and pre- scanning ended due to the neonatal ward of the hospital moving to
dictors of long-term outcome. Several studies have investigated vari- a new branch of the hospital, where their scanners were from a dif-
ous alternative methods for measuring HIE, such as DWI,10 MR ferent vendor, and there were no Phillips Healthcare scanners. The
spectroscopy,11,12 urinary nuclear MR metabolomic profiling,13 and institution’s Committee on Clinical Research Ethics approved the
visual evoked potentials,14 with varying levels of reported success. study protocol, and informed consent was obtained from the
Cerebral venous oxygen saturation (CSvO2) is the amount of parents. The inclusion criteria were determined on the basis of the
leftover oxygen in the veins after oxygen delivery and extraction definition of perinatal asphyxia and moderate or severe HIE as fol-
by the brain and can act as a surrogate of brain oxygen consump- lows: 1) evidence of perinatal asphyxia (Apgar score of #7 for
tion. The oxygen supply is of critical importance to brain func- .5 minutes after birth or a history of acute perinatal event, placen-
tion because neurons rely predominantly on aerobic metabolism tal abruption, cord prolapse, or the need for ventilation for at least
for their energy demands. In infants who have experienced birth 10 minutes after birth27); 2) evidence of moderate or severe HIE
asphyxia, CBF has been reported to be markedly elevated.15 distinguished by using the Sarnat and Sarnat clinical stages5 for
When the brain is hyperperfused like this, elevated CSvO2 values term infants and infants between 33 and 37 weeks’ gestation and
would signal a “luxury perfusion” state, suggesting serious brain significant changes in neurologic examination findings and/or seiz-
damage.16 Normal CSvO2 values, meanwhile, would suggest ures for infants younger than 33 weeks gestation;28 and 3) abnor-
intact coupling between CBF and metabolic needs.17 Thus, know- mal MR imaging findings in all patients on T1-weighted,
ing the CSvO2 in preterm and term infants who are suspected of T2-weighted, and FLAIR images, mainly but not only in the basal
having HIE could provide clinicians with invaluable information. ganglia/thalami region, watershed region, and periventricular
Unfortunately, the 2 current methods for measuring CSvO2 white matter caused by HIE.29,30 Subjects were sedated using 5 mg/
require either the invasive insertion of an internal jugular vein kg of phenobarbital (intramuscular injection). Neonates with high
catheter for co-oximetry or a blood gas analyzer, or the noninva- motion or image artifacts were excluded. In total, 8 term neonates
sive use of near-infrared resonance spectroscopy (NIRS). NIRS, and 8 preterm neonates who were determined to have perinatal as-
however, has been shown to have poor sensitivity at low CSvO2 phyxia and moderate or severe HIE were included for further study.
compared with co-oximetry and can reach a depth of only a few Eight term neonates with hyperbilirubinemia who were free of
millimeters.18 other neonatal complications, such as congenital and chromosomal
Quantitative susceptibility mapping (QSM)19,20 examines gra- abnormalities and with normal MR imaging findings were recruited
dient-echo phase data, usually acquired with SWI,21 to determine prospectively as healthy controls. Hct values were obtained as part
local tissue magnetic susceptibility ( x ). Because deoxyhemoglobin of the regular clinical work-up.
in the venous blood is paramagnetic, a decrease in x of venous
blood compared with the surrounding brain tissue will indicate MR Imaging Acquisition
increased CSvO2. Thus, QSM, a noninvasive method, may provide Brain MR images were obtained on a 3T system (Achieva; Philips
an indirect measure of CSvO2.22,23 For example, Doshi et al,24 in Healthcare) using an 8-channel sensitivity encoding head coil.
2015, reported increased CSvO2 in adults following mild traumatic Data for QSM were collected using a 3D gradient-echo sequence
brain injury. Similarly, Chai et al,25 in 2017, reported increased with 5 echoes (TR ¼ 30 ms, TE1 ¼ 4.5 ms, echo spacing ¼ 5.5 ms,
CSvO2 in subjects with mild traumatic brain injury compared with flip angle ¼ 17°, FOV ¼ 196 154 103 mm3, acquired voxel
healthy controls, but they also reported a positive correlation of size ¼ 0.50 0.5 1.0 mm3, reconstructed voxel size ¼ 0.5
CSvO2 with postconcussive symptoms. Chai et al,26 in 2020, also 0.5 0.5 mm3, scan time ¼ 5 minutes 9 seconds).31 Other scans
reported reduced CSvO2 in patients undergoing hemodialysis, included the following: inversion recovery turbo spin-echo T1-
which also correlated with cognitive scores (r ¼ 0.492, P ¼ .02). weighted (TR/TI ¼ 7000/600 ms, TE ¼ 15 ms, section thickness ¼
Thus, we set out to determine how well CSvO2 could be meas- 5 mm, FOV ¼ 160 151 98 mm3, acquisition matrix ¼
ured using QSM and hematocrit (Hct) from blood samples in 220 163, scan time ¼ 2 minutes 17 seconds); turbo spin-echo
term and preterm neonates with moderate or severe HIE and to T2-weighted (TR ¼ 5000 ms, TE ¼ 100 ms, section thickness ¼
compare those values with those of healthy term controls. We 5 mm, FOV ¼ 160 149 98 mm3, acquisition matrix ¼ 332 -
hypothesized that after perinatal asphyxia, both preterm and 205, scan time ¼ 1 minute 38 seconds); and fast FLAIR images
term neonates with moderate or severe HIE would demonstrate (TR/TI ¼ 12,000/2850 ms, TE ¼ 140 ms, section thickness ¼
increased CSvO2 through decreased cerebral vein magnetic sus- 5 mm, FOV ¼ 160 149 98 mm3, acquisition matrix ¼
ceptibility compared with healthy term controls. 176 144, scan time ¼ 3 minutes 55 seconds). The total acquisi-
tion time was 13 minutes 23 seconds.
MATERIALS AND METHODS
Patients MR Imaging Analysis
Between January 2017 and January 2018, preterm and term QSM images of all 5 echoes were postprocessed from the phase
neonates with a clinical history of perinatal asphyxia and moderate data of the multi-gradient-echo scans. Phase unwrapping was
or severe HIE who were transferred to Children’s Hospital of achieved using a 3D Laplacian algorithm,32 while the background
Chongqing Medical University intensive care nursery were en- field was removed using the variable sophisticated harmonic arti-
rolled in a study evaluating the detection of brain injury by MR fact reduction for phase method.33 A Gaussian filter (s ¼ 0.5)
imaging, in accordance with The Code of Ethics of the World was applied to the normalized field maps to smooth out high-fre-
Medical Association (Declaration of Helsinki). Recruitment and quency errors originating from the reconstruction steps before
2 Weber 2021 www.ajnr.orgFIG 1. Sample internal veins selected after thresholding out the lower 99.95% x values. As can be seen in these sagittal, coronal, and axial views
from a sample healthy term neonate, the major veins that were left over include the straight sinus, inferior sagittal sinus, and the internal cerebral
vein. Note the weak contrast between gray and white matter and the basal ganglia due to the low myelin and iron content of the neonate brain.
the inversion. A 2-step dipole inversion algorithm34 was used to Statistical Analysis
solve the dipole inversion problem. The last echo was used to Statistical analysis was performed using R 3.4.2 (2017; http://
obtain the brain mask, which effectively removed the exter- www.r-project.org/). The relationship between calculated CSvO2
nal cerebral veins. Using the last echo to generate the brain and condition (healthy control, preterm injury, and term injury)
mask reliably removed artifacts from air-tissue and bone-tis- was investigated using a 1-way ANOVA. Visual inspection of re-
sue interfaces, eg, sinuses, especially in the later echoes, sidual plots did not reveal any obvious deviations from homosce-
without the need for manual erosion. This QSM algorithm dasticity or normality.
can be freely accessed at https://github.com/kamesy/QSM.m.
Finally, only the fourth echo (TE ¼ 21 ms) was used for RESULTS
measuring x values because even echoes were flow-compen- Patient Characteristics
sated along the readout direction and the second echo Demographic data and clinical characteristics for both groups (8
(TE =10 ms) had a poor contrast-to-noise ratio. healthy controls, 8 term neonates, and 8 preterm neonates with
The x of cerebral veins was measured by thresholding out the perinatal asphyxia and moderate or severe HIE) are summarized
lowest 99.95% values of the whole brain. In the absence of intracra- in Table 1. No significant differences were found in gestational
nial hemorrhage and because neonates have very low brain iron age, corrected gestational age at MR imaging, time interval
content, voxels that reside entirely inside veins reflect the structures between age at birth and age at MR imaging, birth weight, or
with the highest magnetic susceptibility values. Total blood volume sex between healthy controls and term neonates with HIE.
is about 3%.35,36 Venous blood volume is about two-thirds of total No significant differences were found in sex, time interval
blood volume. For a voxel to be free of partial volume effects and between age at birth and age at MR imaging, clinical history,
given the spatial resolution of 0.5 0.5 1 mm3 of the scan, only and symptoms and signs between term neonates and preterm
veins with an inner diameter of at least 1 mm could be included in neonates with perinatal asphyxia and moderate or severe
the analysis. After thresholding, images were assessed by A.M.W. HIE. As expected, a significant difference (P , .05) was found
to ensure that only veins remained (Fig 1). The remaining 0.25% in the Apgar grade between healthy term neonates and term
of x values was then averaged to give the mean cerebral x value neonates with HIE. Between term and preterm neonates with
for each subject. ROIs were also drawn manually on nonvein tissue HIE, significant differences (P , .05) were found only in ges-
by A.M.W. to calculate D x . Visual inspection did not reveal any tational age, corrected gestational age at MR imaging, and
germinal matrix bleeding in the deep cerebral veins. birth weight, as would be expected.
CSvO2 Analysis
Calculating CSvO2
The mean x value of the internal cerebral veins in healthy controls
CSvO2 was calculated using the following equation:
and term and preterm injured neonates was found to be 0.36 (SD,
D x ¼ D x do HCT ð1 CSvO2 Þ; 0.04) ppm, 0.36 (SD, 0.06) ppm, and 0.29 (SD, 0.04) ppm, respec-
tively, while the mean fractional Hct values were 0.52 (SD, 0.03),
where D x is the susceptibility difference between venous blood 0.49 (SD, 0.07), and 0.42 (SD, 0.06), respectively. Correspondingly,
and surrounding tissue, D x do is the susceptibility difference per the derived mean CSvO2 values were 73.6% (SD, 2.8%), 71.5% (SD,
unit hematocrit between fully deoxygenated and fully oxygenated 7.4%), and 72.2% (SD, 6.0%), respectively. The Cohen D effect size
blood, Hct is the individual fractional hematocrit, and CSvO2 is between each group was found to be 0.38 for healthy controls and
the blood oxygen saturation. D x do was taken to be 4 p 0.21, term injured neonates; 0.30 for healthy controls and preterm neo-
or 2.64 ppm.37,38 nates; and 0.10 between term injured neonates and preterm
AJNR Am J Neuroradiol : 2021 www.ajnr.org 3Table 1: Demographic data and clinical characteristics of the 3 groupsa
Healthy Term Neonates P Value between Preterm P Value between
Controls with HIE Controls and Neonates with Term and Preterm
Characteristics (n = 8) (n = 8) Term HIE HIE (n = 8) HIE
Gestational age (mean) (wk) 39.3 (SD, 0.6) 40.0 (SD, 0.8) .056 33.5 (SD, 2.1) ,.001
Corrected gestational age at MRI 41.3 (SD, 1.1) 41.9 (SD, 0.7) .166 35.7 (SD, 2.6) ,.001
(mean) (wk)
Time interval between age at birth 2.0 (SD, 0.7) 1.9 (SD, 0.6) .819 2.2 (SD, 0.9) .404
and age at MR imaging (mean) (wk)
Birth weight (mean) (g) 3306.3 (SD, 353.1) 3430.6 (SD, 471.4) .560 1926.3 (SD, 350.3) ,.001
No. of male neonates (No.) (%) 4 (50) 5 (62.5) 1.000 4 (50) 1.000
Apgar grade (median) (IQR) 10 (10–10) 6.5 (4–7) ,.001 6 (2–7) .543
Umbilical cord around the neck 2 (25) 1 (12.5) 1.000 1 (12.5) 1.000
(No.) (%)
Oxygen inhalation (No.) (%) 0 4 (50) NA 7 (87.5) 1.000
Pulse oximetry (%) 95–100 90–95 ,.001 90–95 .122
Meconium-stained amniotic fluid 0 3 (37.5) NA 1 (12.5) .569
(No.) (%)
Premature rupture of fetal 0 3 (37.5) NA 5 (62.5) .619
membranes (No.) (%)
Placental abruption (No.) (%) 0 0 NA 2 (25) NA
Cord prolapse (No.) (%) 0 0 NA 1 (12.5) NA
Fetal intrauterine distress (No.) (%) 0 7 (87.5) NA 2 (25) .119
Neonatal asphyxia resuscitation 0 8 (100) NA 8 (100) NA
(No.) (%)
Respiratory failure and ventilation 0 2 (25) NA 5 (62.5) .315
(No.) (%)
Obtundation (No.) (%) 0 7 (87.5) NA 6 (75) 1.000
Stuporous (No.) (%) 0 1 (12.5) NA 2 (25) 1.000
Inhibited primitive reflexes (No.) (%) 0 7 (87.5) NA 6 (75) 1.000
Disappeared primitive reflexes 0 1 (12.5) NA 2 (25) 1.000
(No.) (%)
Hypotonia (No.) (%) 0 2 (25) NA 4 (50) .608
Flaccid (No.) (%) 0 1 (12.5) NA 2 (25) 1.000
Seizures (No.) (%) 0 2 (25) NA 3 (37.5) 1.000
Therapeutic hypothermia (No.) (%) 0 2 (25) NA 1 (12.5) 1.000
Note:—IQR indicates interquartile range; NA, not applicable.
a
P values were from the x 2 test or Fisher exact test for categoric variables or the Student t test for continuous variables.
DISCUSSION
In this study, we quantified CSvO2 from x values in the internal
cerebral veins of preterm and term neonates with HIE and
healthy term controls. Moderate-to-severe HIE caused by intra-
partum or late antepartum hypoxic-ischemic events may lead to
neurodevelopmental disability.1 It is of great importance to
examine cerebral hemodynamic changes in neonates with moder-
ate or severe HIE because this examination may lead to a better
understanding of the cerebral oxygen metabolism of brain injury
in HIE and early therapeutic interventions. Although no statisti-
cal difference in CSvO2 values was found between healthy term
controls and preterm and term infants with moderate or severe
HIE, to the best of our knowledge, this is one of the first studies
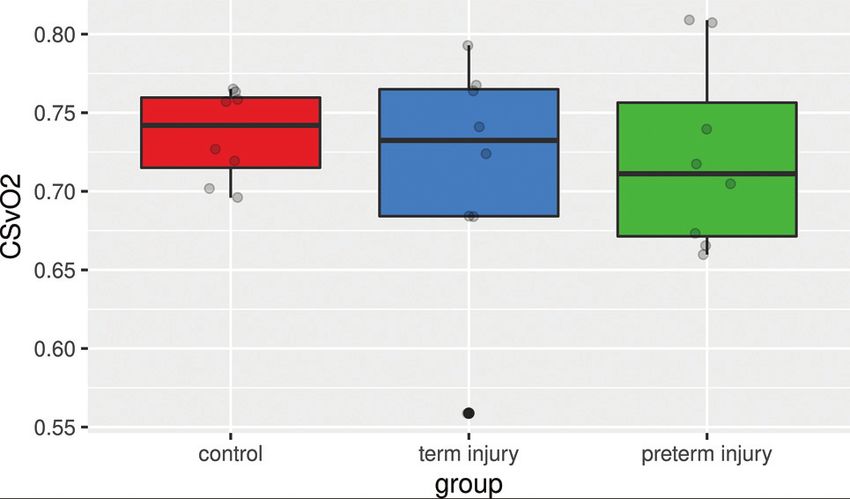
FIG 2. Boxplot of CSvO2 percentages by group. Gray circles are the
measuring CSvO2 using QSM in healthy term neonates, as well as
ROI measurements from each subject.
the first to do so in term and preterm neonates with moderate or
severe HIE. Thus, our reported values for healthy neonates as
neonates. A CSvO2 boxplot among the 3 groups with individual well as injured preterm and term neonates may be used in future
points for each subject is shown in Fig 2. One-way ANOVA analy- studies for comparison purposes. These values agree well with
sis did not reveal that the condition (healthy control, preterm previously reported values using other methods (Table 2).
injury, and term injury) made a significant difference among Noninvasive measurements of CSvO2 in neonates has histori-
groups (P . .05). Boxplots of x and Hct values in each group, with cally been quite difficult. The current best practice, NIRS, does
individual points for each subject are included in the Online not provide robust and reliable measurements due to several limi-
Supplementary Data. tations,39,40 including contamination from extracerebral tissue
4 Weber 2021 www.ajnr.orgTable 2: Comparison of CSvO2 percentages in fetuses and neonates in the literature
Study CSvO2 (mean) (%) Method Subjects Region
van der Hoeven 73.56 (SD, 5.25) Fiber optic catheter Healthy neonates
et al57
Buchvald et al58 64.12 (SD, 4.6) NIRS Healthy neonates Frontotemporal region
Wintermark et al59 77.3 (SD, 4.7) NIRS Hypothermia therapy (moderate) in neonatal HIE Frontal lobe
Wintermark et al59 77.6 (SD, 6.6) NIRS Hypothermia therapy (severe) in neonatal HIE Frontal lobe
De Vis et al60 65.0 (SD, 13.0 T2-TRIR Healthy neonates SSS
Shetty et al48 73.2 (SD, 5.5) TRUST Hypothermia therapy in neonatal HIE SSS
Shetty et al48 68.5 (SD, 9.6) TRUST Post-hypothermia therapy in neonatal HIE SSS
Liu et al49 62.6 (SD, 8.3) TRUST Healthy neonates SSS
Yadav et al44 67 (SD, 7) QSM Healthy fetuses (31 wk) SSS
Jain et al45 55.2 Susceptometry Neonates with congenital heart disease SSS
Yadav et al46 62.6 (SD, 3.25) Susceptometry Healthy fetuses (31 wk) SSS
Neelavalli et al47 66 (SD, 9.4) Susceptometry Healthy fetuses (34 wk) SSS
Average 68.12
Note:—T2-TRIR indicates T2-prepared tissue relaxation inversion recovery; SSS, superior sagittal sinus; TRUST, T2-relaxation-under-spin tagging; QSM, quantitative sus-
ceptibility mapping; NIRS, near infrared resonance spectroscopy.
and arterial blood (generally 30% but can vary considerably Along with the susceptibility-based methods of measuring
among subjects)41 and an insensitivity to low CSvO2 levels.18 CSvO2 in neonates and fetuses, there have been other MR imag-
QSM, meanwhile, is a relatively new technique, which fully quan- ing–related techniques worth mentioning. One such method is
tifies x using MR imaging phase data. Because oxyhemoglobin is known as T2-relaxation-under-spin tagging (TRUST). For
diamagnetic and deoxyhemoglobin is paramagnetic, a reduction instance, Shetty et al,48 in 2019, reported CSvO2 changes during
in deoxyhemoglobin and an increase in oxyhemoglobin will be and after therapeutic hypothermia in neonatal HIE using
reflected as a decrease in the x of venous blood. Using Hct values TRUST. The CSvO2 was calculated by measuring 1/T2 (R2) of the
obtained from blood samples, one can then calculate the CSvO2. SSS. They examined CSvO2 values during early hypothermia
Recently, several studies have been published demonstrating treatment (18–24 hours after initiating treatment) and after and
the promise22,42,43 of using QSM to quantify CSvO2 changes in found posttreatment CSvO2 to have been reduced from 73.2%
brain injuries of adults.24,25 Doshi et al24 and Chai et al25 reported (SD, 5.5%) (during treatment) to 68.5% (SD, 9.6%) (posttreat-
CSvO2 differences between adult healthy controls and subjects ment). These posttreatment values agreed well with a previous
with mild traumatic brain injury by measuring the x of cerebral study that reported 62.6% (SD, 8.3%) in healthy infants using the
major veins. Doshi et al found decreases in venous x in the left same method.49 While these initial reports of measuring CSvO2
thalamostriate vein and right basal vein, while Chai et al found using TRUST are promising, some drawbacks should be consid-
decreases in venous x in the straight sinus. Both of these studies ered. On the one hand, the measurement of R2 is relatively easier
suggested increased CSvO2 after a mild traumatic brain injury, to postprocess than QSM because it requires only a few simple
with different conclusions as to what this might suggest. Doshi et steps. On the other hand, unlike QSM, the measurement of R2
al also obtained CBF measurements and found injured subjects has confounding factors such as fat, fibrosis, and edema,50 along
to have significantly increased CBF postinjury. Along with the with saturation and blooming artifacts. Additionally, the scan
increase in CSvO2, they suggested that the brain responds to trau- required for QSM provides a wealth of additional information
matic injuries by trying to protect brain tissue via the supply of such as R2* maps and SWI, which can be used to better character-
more oxygen than the tissue requires. Whereas Chai et al did not ize lesions.51 In fact, SWI is already often used in clinical settings
acquire CBF measures but did look at the correlation of x reduc- to detect intracranial hemorrhages and other brain abnormalities
tions with the amount of time post-trauma, they reported a posi- and is often part of the neonatal and pediatric MR imaging proto-
tive correlation between the 2 measures, which indicates recovery cols.52-54 The scan is fast (,3 minutes on modern scanners) even
to normal levels of oxygenation with time. Chai et al suggested that at high spatial resolution (,1 mm3). Disadvantages in QSM
QSM can thus be used as a biomarker and to monitor progress. include a range of different approaches for background field re-
Closer to our study, Yadav et al44 used QSM to measure moval, dipole inversion, and referencing to other tissue.
CSvO2 in healthy fetuses (n ¼ 21, median week of pregnancy ¼ The results of our study indicate that CSvO2 values were not
31.3). They reported a mean CSvO2 of 67% (SD, 7%) in the supe- found to be significantly different in injured preterm and term
rior sagittal sinus (SSS) vein, an external cerebral vein that is less neonates compared with healthy term controls. One reason for
than our reported values in internal cerebral veins in healthy con- this finding could be that preterm and term infants with moder-
trols (73.6% [SD, 2.84%]). Similarly, several studies have used a ate or severe HIE could have reduced CBF, which, along with a
method analogous to QSM, known as MR susceptometry, which reduced oxygen metabolism, would result in CSvO2 similar to
uses a susceptibility-weighted image to measure x values on the that in healthy controls. In this case, injured neonates would have
basis of geometric assumptions (such as the SSS vein being an reduced oxygen metabolism and, thus, compromised brain
infinitely long cylinder). These studies reported CSvO2 values in health. To test these 2 opposing theories, however, we would
the SSS ranging from 55.2% in neonates with congenital heart require additional information, such as CBF and cerebral arterial
disease45 to 66% in 34-week-old healthy fetuses (Table 2).46,47 oxygen saturation (CSaO2). For instance, the oxygen extraction
AJNR Am J Neuroradiol : 2021 www.ajnr.org 5fraction, the percentage of oxygen used from the blood as it 2. Kurinczuk JJ, White-Koning M, Badawi N. Epidemiology of neona-
passes through the capillary network, can be calculated by sub- tal encephalopathy and hypoxic-ischaemic encephalopathy. Early
Hum Dev 2010;86:329–38 CrossRef Medline
tracting the fraction of oxygen saturation in the cerebral arteries
3. Bryce J, Boschi-Pinto C, Shibuya K, et al. WHO estimates of the causes
(CSaO2) from the fraction of oxygen saturation in the cerebral of death in children. Lancet 2005;365:1147–52 CrossRef Medline
veins (CSvO2).22,23 While CSaO2 can be easily and noninvasively 4. Barkovich AJ, Hajnal BL, Vigneron D, et al. Prediction of neuromo-
measured using a pulse oxygen monitor and CBF can be acquired tor outcome in perinatal asphyxia: evaluation of MR scoring sys-
tems. AJNR Am J Neuroradiol 1998;19:143–49 Medline
using another MR imaging scan such as arterial spin-labeling or
5. Sarnat HB, Sarnat MS. Neonatal encephalopathy following fetal dis-
phase contrast,55 our study, unfortunately, did not acquire these tress: a clinical and electroencephalographic study. Arch Neurol
data because they were not part of the original study design. 1976;33:696–705 CrossRef Medline
Thus, we cannot make more conclusive statements regarding pre- 6. Chalak LF, Rollins N, Morriss MC, et al. Perinatal acidosis and
term and term injured brain health. An alternative explanation hypoxic-ischemic encephalopathy in preterm infants of 33 to 35
weeks’ gestation. J Pediatr 2012;160:388–94 CrossRef Medline
could be because our data show premature rupture of fetal mem- 7. Logitharajah P, Rutherford MA, Cowan FM. Hypoxic-ischemic ence-
branes in .60% of the preterm infants, which is higher than phalopathy in preterm infants: antecedent factors, brain imaging,
usual. It is possible that these infants have adapted to the outside and outcome. Pediatr Res 2009;66:222–29 CrossRef Medline
world and have CSvO2 values closer to term infants. 8. Laptook AR. Birth asphyxia and hypoxic-ischemic brain injury in
the preterm infant. Clin Perinatol 2016;43:529–45 CrossRef Medline
Two strengths of our method are as follows: The QSM algo-
9. Salhab WA, Perlman JM. Severe fetal acidemia and subsequent
rithm is available for free on-line at https://github.com/kamesy/ neonatal encephalopathy in the larger premature infant. Pediatr
QSM.m for researchers and clinicians to download and use. Neurol 2005;32:25–29 CrossRef Medline
Furthermore, our method of selecting venous susceptibility val- 10. Rana L, Sood D, Chauhan R, et al. MR imaging of hypoxic ischemic
ues (looking at the highest 0.25%) helps reduce human error encephalopathy: distribution patterns and ADC value correlations.
Eur J Radiol Open 2018;5:215–20 CrossRef Medline
using a completely data-driven process.
11. Azzopardi D, Edwards AD. Magnetic resonance biomarkers of neu-
There are several limitations to the current study. Only 8 sub- roprotective effects in infants with hypoxic ischemic encephalop-
jects from each group were examined, limiting our statistical athy. Semin Fetal Neonatal Med 2010;15:261–69 CrossRef Medline
power. We did not acquire CSaO2 or CBF measurements, which 12. Thayyil S, Chandrasekaran M, Taylor A, et al. Cerebral magnetic res-
would have allowed us to examine why both preterm and term onance biomarkers in neonatal encephalopathy: a meta-analysis.
Pediatrics 2010;125:e382-395 CrossRef Medline
infants with moderate or severe HIE did not show statistically sig-
13. Skappak C, Regush S, Cheung P-Y, et al. Identifying hypoxia in a
nificant differences in CSvO2 compared with healthy controls. newborn piglet model using urinary NMR metabolomic profiling.
Furthermore, no follow-up with these patients was attempted, PLoS ONE 2013;8:e65035 CrossRef Medline
such as cognitive scores, which could have been used to investi- 14. Cainelli E, Trevisanuto D, Cavallin F, et al. Evoked potentials predict
gate any correlations with CSvO2. In the future, we hope to add psychomotor development in neonates with normal MRI after
hypothermia for hypoxic-ischemic encephalopathy. Clin Neurophysiol
more subjects, acquire CSaO2 and CBF measurements (such as 2018;129:1300–06 CrossRef Medline
arterial spin-labeling), and perform cognitive measurements as 15. Pryds O, Greisen G, Lou H, et al. Vasoparalysis associated with
the infants develop later in life. One piece of advice the authors brain damage in asphyxiated term infants. J Pediatr 1990;117:119–
wish to pass on to future researchers is the importance of acquir- 25 CrossRef Medline
ing and using Hct values in calculating CSvO2. Had we used a 16. Lassen NA. The luxury-perfusion syndrome and its possible rela-
tion to acute metabolic acidosis localised within the brain. Lancet
constant value for Hct, the preterm group would have been found 1966;2:1113–15 CrossRef Medline
to have a statistically significant difference in CSvO2. However, 17. Skov L, Pryds O, Greisen G, et al. Estimation of cerebral venous sat-
by using acquired Hct from each subject, this difference was no uration in newborn infants by near infrared spectroscopy. Pediatr
longer seen because Hct increases with gestational age and pre- Res 1993;33:52–55CrossRef Medline
term infants were scanned at a younger gestational age.56 18. Rescoe E, Tang X, Perry DA, et al. Cerebral near-infrared spectros-
copy insensitively detects low cerebral venous oxygen saturations
after stage 1 palliation. J Thorac Cardiovasc Surg 2017;154:1056–62
CONCLUSIONS CrossRef Medline
We were able to measure CSvO2 in the internal cerebral veins in 19. Shmueli K, de Zwart JA, van Gelderen P, et al. Magnetic susceptibil-
ity mapping of brain tissue in vivo using MRI phase data. Magn
healthy term, preterm, and term injured neonates. These values
Reson Med 2009;62:1510–22 CrossRef Medline
agree well with previously reported values in the literature. 20. Deistung A, Schweser F, Reichenbach JR. Overview of quantitative sus-
However, we did not see a difference in CSvO2, despite the pres- ceptibility mapping. NMR Biomed 2017;30:e3569 CrossRef Medline
ence of HIE in the term injured and preterm infants. More stud- 21. Haacke EM, Xu Y, Cheng Y-CN, et al. Susceptibility-weighted imag-
ies should be performed in preterm and term infants with ing (SWI). Magn Reson Med 2004;52:612–18 CrossRef Medline
22. Haacke EM, Tang J, Neelavalli J, et al. Susceptibility mapping as a
moderate or severe HIE, while acquiring other brain oxygen met-
means to visualize veins and quantify oxygen saturation. J Magn
rics such as CBF and CSaO2 along with cognitive metrics as the Reson Imaging 2010;32:663–76 CrossRef Medline
infants develop later in life. 23. Tang J, Liu S, Neelavalli J, et al. Improving susceptibility mapping
using a threshold-based K-space/image domain iterative recon-
struction approach. Magn Reson Med 2013;69:1396–1407 CrossRef
Medline
REFERENCES 24. Doshi H, Wiseman N, Liu J, et al. Cerebral hemodynamic changes of
1. Ferriero DM. Neonatal brain injury. N Engl J Med 2004;351:1985–95 mild traumatic brain injury at the acute stage. PLoS One 2015;10:
CrossRef Medline e0118061 CrossRef Medline
6 Weber 2021 www.ajnr.org25. Chai C, Guo R, Zuo C, et al. Decreased susceptibility of major veins the superior sagittal sinus. Eur Radiol 2019;29:2017–26 CrossRef
in mild traumatic brain injury is correlated with post-concussive Medline
symptoms: a quantitative susceptibility mapping study. Neuroimage 45. Jain V, Buckley EM, Licht DJ, et al. Cerebral oxygen metabolism in
Clin 2017;15:625–32 CrossRef Medline neonates with congenital heart disease quantified by MRI and
26. Chai C, Wang H, Chu Z, et al. Reduced regional cerebral venous ox- optics. J Cereb Blood Flow Metab 2014;34:380–88 CrossRef Medline
ygen saturation is a risk factor for the cognitive impairment in 46. Yadav BK, Krishnamurthy U, Buch S, et al. Imaging putative foetal
hemodialysis patients: a quantitative susceptibility mapping study. cerebral blood oxygenation using susceptibility weighted imaging
Brain Imaging Behav 2020;14:1339–49 CrossRef Medline (SWI). Eur Radiol 2018;28:1884–90 CrossRef Medline
27. Antonucci R, Porcella A, Pilloni MD. Perinatal asphyxia in the term 47. Neelavalli J, Jella PK, Krishnamurthy U, et al. Measuring venous
newborn. Journal of Pediatric and Neonatal Individualized Medicine blood oxygenation in fetal brain using susceptibility-weighted
2014;3:e030269 CrossRef imaging. J Magn Reson Imaging 2014;39:998–1006 CrossRef Medline
28. Gopagondanahalli KR, Li J, Fahey MC, et al. Preterm hypoxic-ische- 48. Shetty AN, Lucke AM, Liu P, et al. Cerebral oxygen metabolism
mic encephalopathy. Front Pediatr 2016;4:114 CrossRef Medline during and after therapeutic hypothermia in neonatal hypoxic-is-
29. Sie LT, van der Knaap MS, Oosting J, et al. MR patterns of hypoxic- chemic encephalopathy: a feasibility study using magnetic reso-
ischemic brain damage after prenatal, perinatal or postnatal as- nance imaging. Pediatr Radiol 2019;49:224–33 CrossRef Medline
phyxia. Neuropediatrics 2000;31:128–36 CrossRef Medline 49. Liu P, Huang H, Rollins N, et al. Quantitative assessment of global
30. Barkovich AJ, Sargent SK. Profound asphyxia in the premature cerebral metabolic rate of oxygen (CMRO2) in neonates using
infant: imaging findings. AJNR Am J Neuroradiol 1995;16:1837–46 MRI. NMR Biomed 2014;27:332–40 CrossRef Medline
Medline 50. Wang Y, Spincemaille P, Liu Z, et al. Clinical quantitative susceptibil-
31. Denk C, Rauscher A. Susceptibility weighted imaging with multiple ity mapping (QSM): biometal imaging and its emerging roles in
echoes. J Magn Reson Imaging 2010;31:185–91 CrossRef Medline patient care. J Magn Reson Imaging 2017;46:951–71 CrossRef Medline
32. Schofield MA, Zhu Y. Fast phase unwrapping algorithm for inter- 51. Zhang Y, Rauscher A, Kames C, et al. Quantitative analysis of punc-
ferometric applications. Opt Lett 2003;28:1194–96 CrossRef Medline tate white matter lesions in neonates using quantitative susceptibility
33. Li W, Wu B, Liu C. Quantitative susceptibility mapping of human
mapping and R2* relaxation. AJNR Am J Neuroradiol 2019;40:1221–
brain reflects spatial variation in tissue composition. Neuroimage
26 CrossRef Medline
2011;55:1645–56 CrossRef Medline
52. Bosemani T, Poretti A, Huisman TA. Susceptibility-weighted imag-
34. Kames C, Wiggermann V, Rauscher A. Rapid two-step dipole inver-
ing in pediatric neuroimaging. J Magn Reson Imaging 2014;40:530–
sion for susceptibility mapping with sparsity priors. Neuroimage
44 CrossRef Medline
2018;167:276–83 CrossRef Medline
53. Tortora D, Severino M, Malova M, et al. Variability of cerebral deep
35. Leenders KL, Perani D, Lammertsma AA, et al. Cerebral blood flow,
venous system in preterm and term neonates evaluated on MR SWI
blood volume and oxygen utilization normal values and effect of
venography. AJNR Am J Neuroradiol 2016;37:2144–49 CrossRef
age. Brain 1990;113:27–47 CrossRef Medline
Medline
36. Doucette J, Wei L, Hernández-Torres E, et al. Rapid solution of the
54. Albayram MS, Smith G, Tufan F, et al. Frequency, extent, and corre-
Bloch-Torrey equation in anisotropic tissue: application to dynamic
lates of superficial siderosis and ependymal siderosis in premature
susceptibility contrast MRI of cerebral white matter. Neuroimage
infants with germinal matrix hemorrhage: an SWI study. AJNR
2019;185:198–207 CrossRef Medline
37. Sedlacik J, Rauscher A, Reichenbach JR. Obtaining blood oxygen- Am J Neuroradiol 2020;41:331–37 CrossRef Medline
ation levels from MR signal behavior in the presence of single ve- 55. Dolui S, Wang Z, Wang DJ, et al. Comparison of non-invasive MRI
nous vessels. Magn Reson Med 2007;58:1035–44 CrossRef Medline measurements of cerebral blood flow in a large multisite cohort. J
38. Portnoy S, Milligan N, Seed M, et al. Human umbilical cord blood Cereb Blood Flow Metab 2016;36:1244–56 CrossRef Medline
relaxation times and susceptibility at 3 T: human umbilical cord 56. Jopling J, Henry E, Wiedmeier SE, et al. Reference ranges for hemat-
blood relaxation times and susceptibility at 3 T. Magn Reson Med ocrit and blood hemoglobin concentration during the neonatal pe-
2018;79:3194–3206 CrossRef Medline riod: data from a multihospital health care system. Pediatrics
39. Ferrari M, Mottola L, Quaresima V. Principles, techniques, and limita- 2009;123:e333–37 CrossRef Medline
tions of near infrared spectroscopy. Can J Appl Physiol 2004;29:463– 57. van der Hoeven MA, Maertzdorf WJ, Blanco CE. Continuous central
87 CrossRef Medline venous oxygen saturation (SCvO2) measurement using a fiber
40. Davies DJ, Su Z, Clancy MT, et al. Near-infrared spectroscopy in the optic catheter in newborn infants. Arch Dis Child Fetal Neonatal Ed
monitoring of adult traumatic brain injury: a review. J Neurotrauma 1996;74:F177–81 CrossRef Medline
2015;32:933–41 CrossRef Medline 58. Buchvald FF, Kesje K, Greisen G. Measurement of cerebral oxyhae-
41. Murkin JM, Arango M. Near-infrared spectroscopy as an index of moglobin saturation and jugular blood flow in term healthy new-
brain and tissue oxygenation. Br J Anaes 2009;103(Suppl 1):i3–13 born infants by near-infrared spectroscopy and jugular venous
CrossRef Medline occlusion. Biol Neonate 1999;75:97–103 CrossRef Medline
42. Fan AP, Bilgic B, Gagnon L, et al. Quantitative oxygenation venog- 59. Wintermark P, Hansen A, Warfield SK, et al. Near-infrared spec-
raphy from MRI phase. Magn Reson Med 2014;72:149–59 CrossRef troscopy versus magnetic resonance imaging to study brain perfu-
Medline sion in newborns with hypoxic-ischemic encephalopathy treated
43. Liu S, Buch S, Chen Y, et al. Susceptibility-weighted imaging: cur- with hypothermia. Neuroimage 2014;85:287–93 CrossRef Medline
rent status and future directions. NMR Biomed 2017;30:10.1002/ 60. De Vis JB, Petersen ET, Alderliesten T, et al. Non-invasive MRI
nbm.3552 CrossRef Medline measurements of venous oxygenation, oxygen extraction fraction
44. Yadav BK, Buch S, Krishnamurthy U, et al. Quantitative susceptibil- and oxygen consumption in neonates. Neuroimage 2014;95:185–92
ity mapping in the human fetus to measure blood oxygenation in CrossRef Medline
AJNR Am J Neuroradiol : 2021 www.ajnr.org 7You can also read