Population Age Structure, Complex Socio-Demographic Systems and Resilience Potential: A Spatio-Temporal, Evenness-Based Approach
←
→
Page content transcription
If your browser does not render page correctly, please read the page content below
sustainability

Case Report
Population Age Structure, Complex
Socio-Demographic Systems and Resilience Potential:
A Spatio-Temporal, Evenness-Based Approach
Massimo Cecchini 1 , Sirio Cividino 2 , Rosario Turco 3 and Luca Salvati 3,4, *
 1    Department of Agricultural and Forestry Sciences (DAFNE), University of Tuscia, Via S. Camillo De Lellis
      snc, I-01100 Viterbo, Italy; cecchini@unitus.it
 2    Department of Agriculture, University of Udine, Via del Cotonificio 114, I-33100 Udine, Italy;
      civsirio@tiscali.it
 3    Council for Agricultural Research and Economics (CREA), Viale Santa Margherita 80, I-52100 Arezzo, Italy;
      rosario.turco@crea.gov.it
 4    Global Change Research Institute of the Czech Academy of Sciences, Lipová 9, CZ-37005 České Budějovice,
      Czech Republic
 *    Correspondence: luca.salvati@uniroma1.it

 Received: 2 March 2019; Accepted: 2 April 2019; Published: 6 April 2019

 Abstract: The present study illustrates an original approach grounded on entropy theory and complex
 system thinking with the aim to investigate changes over time and space in population structure
 by age in Italy, in light of socioeconomic resilience and post-crisis recovery potential. Assuming
 that population structure may reflect different levels of resilience to exogenous shocks, a Pielou
 J evenness index was calculated on census data made available every 10 years (1861–2011) with
 the aim to identify compositional homogeneity (or heterogeneity) in the age structure of the Italian
 population. Trends over time in the Pielou J evenness index were identified using descriptive statistics,
 comparison with ancillary demographic indicators and multivariate exploratory techniques including
 principal component analysis. The empirical results allowed the identification of multiple dimensions
 of demographic transition in Italy, distinguishing two phases, the former encompassing a relatively
 long time period between 1861 and 1936, and the latter covering a shorter period between 1936
 and 2011. A spatially-explicit analysis of Pielou J evenness indices applied to the population age
 structure of each Italian municipality at the latest survey (2017) finally provided a comprehensive
 overview of the demographic characteristics likely influencing the resilience potential of local districts.
 The empirical evidence outlined the consolidation of a coastal–inland divide as a result of the complex
 linkage between demographic dynamics and local background contexts.

 Keywords: population dynamics; age structure; spatial analysis; exploratory data analysis; Italy

1. Introduction
     Despite the importance of the resilience dimension in social and economic disciplines, a partial
consensus on definitions and assessment techniques has been reached, deriving concepts and basic
approaches from the general notion of socio-ecological resilience [1–3]. Assuming that resilience is
the ability of a local socioeconomic system to tolerate external disturbance without shifting to a state
governed by different conditions, the amplitude of changes caused by disturbance and post-disturbance
recovery dynamics is a pivotal issue when evaluating a system’s resilience [4]. The assessment
of resilience in systems transforming rapidly over time is key for advancing policies of local and
regional development [5]. Holling [6] discussed the resilience concept within the broader notion of
system stability, focusing on the level of disturbance that a system can face under pre-determined,

Sustainability 2019, 11, 2050; doi:10.3390/su11072050                       www.mdpi.com/journal/sustainability
Sustainability 2019, 11, 2050                                                                      2 of 12

self-organized processes [7]. By referring to the ability to respond to continuous changes, more recent
studies re-framed the concept of resilience in the light of a multiple ensemble of opportunities that
disturbances open up in terms of new structures and functions [5], system renewal [6], and the
emergence of new developmental paths [4]. While being a relatively underexplored dimension in
studies assessing local system resilience, demography is a key component of socioeconomic processes,
expressing—likely better than other factors—local adaptation to new conditions [8].
      Assessing the specific contribution of demography to socioeconomic resilience at different spatial
scales (i.e., defining the importance of intrinsic system properties such as population structure by
age) provides basic knowledge to develop a demographically-informed vision of a socioeconomic
system’s resilience, as an original contribution to integrated issues of sustainable development in
advanced countries [9]. Assuming that resilience involves path-dependent, historical lock-in processes,
a local system has multiple equilibria emphasizing the linkage between economic expansion and
social transformation [10]. The low-level equilibrium of a given system depends on the related
social structure, which can be stable or allow for transitions between different configurations [11–14].
Assuming that resilience implies (more or less rapid) recovery from external shocks to a system [15–17],
population structure by age is considered a key variable contributing to system stability and leading to
higher resilience [18–20]. In this regard, urbanization and population change are important factors
shaping the resilience of local systems [21].
      Demographic transitions (DTs) from high birth and death rates to low birth and death rates [22]
take place in countries with marked socioeconomic transformations [23–25]. In Europe, reduced
fertility was observed in the last century [26–30], with death rates levelling off at even lower
rates [31]. Considering that a DT is a phenomenon shaping the resilience of local socioeconomic
systems, the identification of the demographic dynamics resulting in specific population structures
is key to a better understanding of local system’s response to external shocks and recovery after
crises [31–33]. Assuming a link between regional development and population dynamics [33,34],
a refined understanding of DTs based on complex adaptive system theory may shed light on long-term
socioeconomic transformations [34–36].
      With the understanding that DT is a multidimensional process of change involving several
dimensions of population structure and dynamics, the present study hypothesized that different
population distributions by age reflect distinctive levels of resilience of a local system, underlying
different responses to external shocks [37,38]. Based on these premises, a two-step exploratory analysis
verifying (i) the temporal coherency of population structure indicators in Italy between 1861 and 2011;
and (ii) the spatial coherence of population structures in Italian municipalities at the most recent time
point was developed. This analysis defined homogeneous (i) time intervals and (ii) spatial districts
with distinctive demographic contexts implying a variable level of local resilience. Step 1 involved
a comprehensive analysis of an entropy-based indicator (the Pielou J evenness index) computed
on aggregated census data for representative time points with the aim of assessing compositional
homogeneity (or heterogeneity) in the age structure of the Italian population. Analysis was carried
out using a multivariate technique (principal component analysis), with the objective of identifying
latent relationships among input variables. Step 2 involves a spatially-explicit analysis of Pielou J
evenness indices applied to the population age structure of each Italian municipality at the latest
survey (2017), providing a comprehensive overview of the demographic characteristics affecting the
resilience potential of local districts. A multi-stage approach investigating selected demographic
attributes over time and space may reveal latent interactions between socioeconomic development,
local system resilience and long-term demographic processes [39–42].
Sustainability 2019, 11, 2050 3 of 12
2. Materials and Methods
Sustainability 2019, 11, x FOR PEER REVIEW 3 of 12
2.1. Study Area and Data Collection
This
This study
study investigated
investigated temporal
temporal and and spatial
spatial patterns
patterns in in selected
selected demographic
demographic indicators,
indicators,
applying
applying complex
complex system
system theoryand
theory andananevenness
evennessindex
index to to the analysis
analysis ofof changes
changesininpopulation
populationage
agestructures
structuresover
overa asufficiently
sufficientlylong
longtime
timeperiod
periodininItaly
Italy[43–45].
[43–45].TheThestudy
studyarea
areacoincided
coincidedwithwiththe
Italian borders and covered 301,330 km 2 2of land (23% flat land, 42% uplands, 35% mountains). A
the Italian borders and covered 301,330 km of land (23% flat land, 42% uplands, 35% mountains).
map of
A map of Italy
Italyillustrating
illustratingboundaries
boundariesofofadministrative
administrativeregions
regionsand and municipalities
municipalities is is presented
presented in in
Figure 1. The long-term population dynamics in Italy reflect the typical outcomes
Figure 1. The long-term population dynamics in Italy reflect the typical outcomes of a transitional of a transitional
demography
demography in in advanced
advanced economies.
economies. Until
Until World
World WarWar I, high
I, high fertility
fertility contributed
contributed significantly
significantly to to
natural
natural population
population growth,
growth, and massive
and massive emigration
emigration to Northern
to Northern Europe and Europe
Northand Northallowed
America America
allowed the balancing of socioeconomic disparities within the country,
the balancing of socioeconomic disparities within the country, containing unemployment and ruralcontaining unemployment
and rural
poverty. Duringpoverty. Duringperiod,
the inter-war the inter-war period, fertility
fertility remained high and remained
mortality high and mortality
increased increased
slightly, despite
slightly, despite
a moderate increasea inmoderate increase in life expectancy.
life expectancy.
Figure 1. Map of Italy illustrating the boundaries of administrative regions (and the official name)
and municipalities (the insert indicates the geographical position of Italy within Europe and the
Mediterranean basin).
Figure 1. Map of Italy illustrating the boundaries of administrative regions (and the official
name) and municipalities (the insert indicates the geographical position of Italy within
Europe and the Mediterranean basin).
In the post-war decades, fertility became more variable over time, with the highest peaks
observed in the late 1950s and the early 1970s, corresponding to the so-called baby boom in WesternSustainability 2019, 11, 2050 4 of 12
In the post-war decades, fertility became more variable over time, with the highest peaks observed
in the late 1950s and the early 1970s, corresponding to the so-called baby boom in Western Europe.
Intense migration from Southern to Northern Italy reflected the economic backwardness of a relatively
large part of the country south of Rome. At the same time, life expectancy increased more markedly,
outlining an increasing divide between urban and rural areas. Since the late 1970s, the total fertility rates
decreased continuously—although with a temporary recovery during the 2000s—and population aging
consolidated in both urban and rural areas. Fertility decline and aging both contributed negatively
to the natural population balance. The total population growth was (and still is) slightly positive
thanks to the contribution of massive international migration from developing countries. Population
trends in Italy were extensively discussed in Billari et al. [26], Vignoli et al. [28], Cazzola et al. [29] and
Caltabiano et al. [33], among others.
The population structure by age (using homogeneous, 5-year age classes) was derived from
time-series data (1861–2011) disseminated by the Italian National Institute of Statistics (ISTAT) at the
national scale (www.istat.it/demo). These data refer to homogeneous geographical boundaries over
time and were derived from the general census of the population and households held approximately
every 10 years [46]. A specific focus on municipal data was also carried out considering the population
structure by age for all Italian municipalities, using aggregated data from the national population
register held by ISTAT referring to 2017. Indicators of population structure by age [47] (old age
dependency index and structural dependency index) were also derived from the same dataset
disseminated by ISTAT and supplemented the information derived from a multivariate analysis
of population structure by age.
2.2. Methodology
The relative share of population by age class in the total resident population at each census year
or spatial domain (municipality) was the input for the Pielou evenness J index [48,49]. The Pielou J
index is a Shannon diversity function (the so-called H’ Shannon index) standardized to the level of
diversification in a given spatial unit [50,51]. The Pielou J index ranges from 0 (complete homogeneity)
to 1 (the highest heterogeneity according to the level of local-scale diversification), calculated as follows:
J = H0 /Hmax (1)
where H0 is the Shannon diversity index, calculated as:
n
H0 = ∑ pi ln pi (2)
i =1
where pi is the proportion of observations falling in the i-th class on the total number of observations
for each age class, and Hmax is the logarithm of the number of age classes with at least one observation.
While Pielou’s evenness functions were traditionally used in ecological applications, with the final
objective of assessing the diversity of animal and plant communities, this index was more recently
adopted in research dealing with, e.g., the related variety of economic activities, class diversification,
social inequalities and compositional analysis of migrant communities by citizenship [6–8,47].
To assess changes over time in the age structure of the Italian population, a principal component
analysis (PCA) was run on the matrix consisting of the relative proportions of population by age class
in the total population on the country scale by year. The PCA is an exploratory approach selecting
independent latent variables (components) from a given data set treating redundancy and serial
autocorrelation in a multivariate distribution of observations [40,50,52,53]. Starting from elementary
observations, a correlation matrix was adopted as the input of the PCA [54]. While being subjective
and not based on hypothesis testing, the selection of relevant components was based on the a priori
eigenvalue threshold [55]: components with an eigenvalue > 1 were retained and analyzed further [56].
Component loadings and scores were considered together when defining the independent dimensionsSustainability 2019, 11, 2050 5 of 12
Sustainability 2019, 11, x FOR PEER REVIEW 5 of 12
of DT in Italy. The PCA was supplemented with three non-active indicators (old age dependency
of population
index, structure)
structural contributing
dependency index, andto identifying time periods
evenness J index with homogeneous
of population population
structure) contributing to
dynamics. The spatial distribution of the Pielou J index applied to the population age
identifying time periods with homogeneous population dynamics. The spatial distribution of the structure in
each Italian
Pielou municipality
J index applied toat thethe last surveyage
population date (2017) was
structure finally
in each mapped
Italian using a shapefile
municipality at the lastofsurvey
local
administrative
date (2017) wasunits provided
finally mapped byusing
ISTAT.a shapefile of local administrative units provided by ISTAT.
3.3.Results
Results
Changesin
Changes inthe
theageagestructure
structureof of the
the Italian
Italian population
populationare areshown
shownin inFigure
Figure2, 2, using
using 5-year
5-yearageage
classes.The
classes. Thedemographic
demographicstructurestructureobserved
observedfor for1911
1911was
was particularly
particularly homogeneous,
homogeneous,displaying
displayingaa
characteristicpyramidal
characteristic pyramidalshape.shape.ThisThisform
formwas wasaaconsequence
consequenceofofthe thehigh
highfertility
fertilityand
andhigh
highmortality,
mortality,
typical of an early stage of a demographic transition. The distribution
typical of an early stage of a demographic transition. The distribution by age in the previous 50by age in the previous 50years
years
(from 1861)
(from 1861) waswas instead
instead more
more convoluted,
convoluted, with with evident
evident local
local peaks,
peaks, likely
likely the
the result
result of
of exogenous
exogenous
shocks(e.g.
shocks (e.g.,wars,
wars,diseases,
diseases,famines,
famines,ruralruralpoverty)
poverty)affecting
affectingthethestructure
structureof ofthe
thepopulation
populationin inthe
the
past (e.g., in the early decades of the 19th century). With the rising life expectancy,
past (e.g. in the early decades of the 19th century). With the rising life expectancy, the age structure the age structure
of the
of the Italian
Italian population
population in in 1951
1951 became
became more more heterogeneous,
heterogeneous, with with aa progressive
progressive decrease
decrease in in the
the
youngersegment
younger segment(age (ageclasses
classesup upto to25–29
25–29years)
years)and
andaasubstantial
substantialstability
stabilityof ofthe
thepopulation
populationat atolder
older
ages.The
ages. Theimpact
impactof ofWorld
WorldWar War II was
was particularly
particularly relevant
relevant inin the
the 30–34
30–34 ageage group.
group. The The population
population
structurein
structure in1981
1981waswasevenevenmore
moreheterogeneous,
heterogeneous,reflecting
reflectingthe
theincrease
increasein inlife
lifeexpectancy
expectancyin inaacontext
context
of stable (or slightly declining) fertility. Finally, the structure of the population in 2011 presented aa
of stable (or slightly declining) fertility. Finally, the structure of the population in 2011 presented
particularly unbalanced
particularly unbalancedage age distribution,
distribution, reflecting a marked
reflecting decline decline
a marked in fertility,
in with an increasingly
fertility, with an
visible impact
increasingly on younger
visible impact age classes and
on younger age showing
classes andan aging
showingpopulation.
an aging The changesThe
population. overchanges
time in
the old age dependency index reflected a substantial aging of the Italian
over time in the old age dependency index reflected a substantial aging of the Italian population, population, accelerating
since 1971. The
accelerating sincestructural
1971. Thepopulation dependencedependence
structural population showed a quiteshowed homogeneous trend, remaining
a quite homogeneous trend,
substantially
remaining stable until
substantially 1936until
stable and 1936
varying andonly moderately
varying in subsequent
only moderately decades. decades.
in subsequent The Pielou TheJ
evenness
Pielou index grew
J evenness index progressively over time,
grew progressively indicating
over a regimeashift
time, indicating from
regime a proportional
shift structure
from a proportional
by age class
structure to a class
by age moretoheterogeneous,
a more heterogeneous,rectangular structure.structure.
rectangular
Percent
Figure2.2.Per
Figure cent share
shareofofpopulation
populationby by
ageage
classclass
in the
intotal
the resident population
total resident in Italy by
population in year.
Italy
by year.
A descriptive analysis was carried out by computing two demographic indicators (the old age
dependency indexanalysis
A descriptive and structural dependency
was carried out by index)
computingtogether
twowith the Pielouindicators
demographic J index (Table
(the 1).
old age
dependency index and structural dependency index) together with the Pielou J index (Table 1).
Table 1. The relationship between the Pielou J evenness index applied to population
structure by age in Italy and supplementary demographic indicators over time, 1861–2011.Sustainability 2019, 11, 2050 6 of 12
Table 1. The relationship between the Pielou J evenness index applied to population structure by age
in Italy and supplementary demographic indicators over time, 1861–2011.
Year Old Age Dependency Index Structural Dependency Index Evenness J Index
1861 12.2 62.3 0.854
1871 15.7 60.2 0.869
1881 16.0 59.5 0.870
1901 17.7 67.9 0.871
1911 20.2 67.9 0.871
1921 23.3 61.2 0.875
1931 24.7 58.8 0.881
1936 24.3 61.4 0.884
1951 31.4 52.3 0.895
1961 38.9 51.6 0.906
1971 46.1 55.5 0.914
1981 61.7 53.1 0.921
1991 96.6 45.3 0.930
2001 131.4 49.0 0.939
2011 148.7 53.5 0.945
A principal component analysis was carried out on the data matrix consisting of per cent shares
of the population by age class in the total population, evidencing specific trends over time and links
with supplementary indicators (the old age dependency index, structural dependency index, and the
Pielou J evenness index). The first two components accounted for a cumulated variance larger than
85%, indicating multidimensional patterns for each analysis dimension, and the variables contributing
the most to such trends (Table 2).
Table 2. Variable loadings (per cent share of population by age class in total population) of selected
principal components (see also Figure 2). Bold indicates relevant loadings > |0.5|; Italics indicate a
supplementary variable in the PCA.
Class (Years) Axis 1 Axis 2was also negatively associated with the structural dependency index. The temporal structure
associated with the principal components 1 and 2 is illustrated in Figure 3. A moderate shift along
Component 2 (from negative to positive values) was observed during the period 1861–1936, together
with a more accelerated shift along Component 1 (1936–2011). Municipalities with the highest Pielou
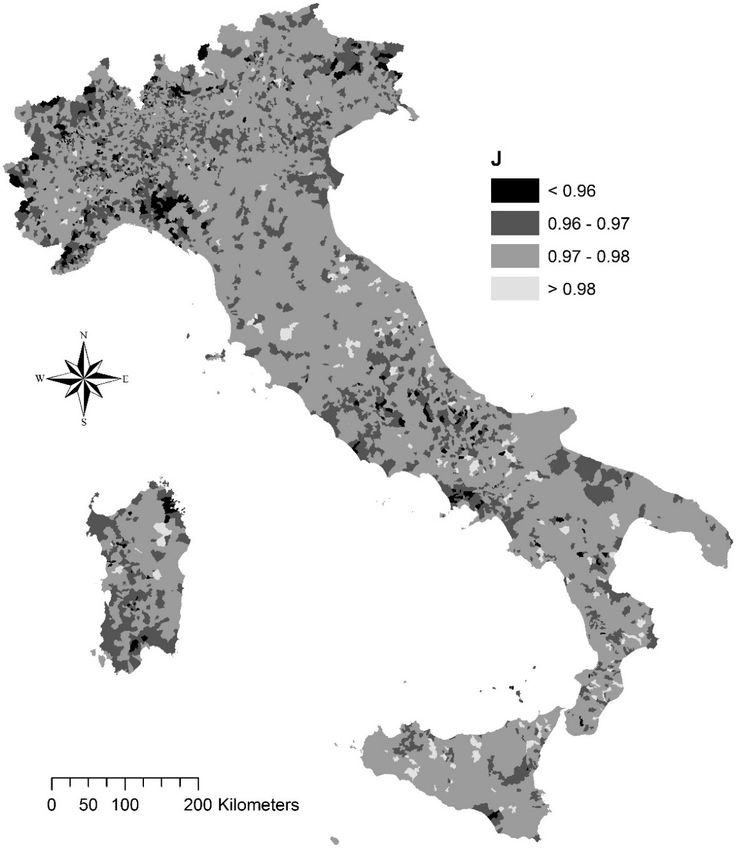
JSustainability
evenness index2019, 11,(>2050
0.98) were scattered in internal areas of the country, especially along the central 7 of 12
and southern Apennines, and more occasionally along the Alps (Figure 4).
Low fertility and population aging have characterized these districts in recent times [26,28,29].
Most Component
of the Italian 1 extracted 77% ofwere
municipalities the overall
classifiedvariance
in theinrangethe data matrix0.97
between andand was0.98:
associated
these
negatively with younger population (age classes up to 20–24 years)
territories—widespread throughout the country, both inland and along the coasts—displayed and positively with the adult
population (from
demographic 35 years
dynamics onwards).
associated with The old age dependency
progressive aging and aindex and Pielou
moderate J evenness
fertility index
decline. The J
were positively associated with Component 1, while the structural dependency
class between 0.96 and 0.97 identified municipalities with a mixed demographic structure basically index was negatively
associated
found with the
in coastal sameespecially
areas, component. in The age and
central classes (25–29 years
southern Italy. and 30–34
These years) were are
municipalities positively
often
associated with Component 2, which explains 7% of the overall variance.
situated at the border of large cities (e.g. Rome, Naples, Cagliari, Bari, Palermo) and display This component was also
a
negatively associated with the structural dependency index. The temporal structure
relatively young population structure, with moderately high fertility rates and intense population associated with
the principal
growth thankscomponents
to immigration 1 andfrom2 isabroad.
illustrated in Figure
Finally, 3. A moderate
municipalities shift along
with a Pielou J indexComponent
lower than2
0.96 present a particularly mixed demographic structure, dominated by a young population inasome
(from negative to positive values) was observed during the period 1861–1936, together with more
accelerated shift along Component 1 (1936–2011). Municipalities with the highest
cases (urban areas of Rome, Naples and Cagliari), or by an adult and older population in other cases Pielou J evenness
index and
(rural (>0.98) were scattered
internal in internal
areas of the Northern areas
andofCentral
the country, especially
Apennines along
as well as the central and southern
economically-marginal
Apennines, and more occasionally
areas of Piedmont and Friuli Venezia Giulia). along the Alps (Figure 4).
Figure 3. Biplot
Figure illustrating
3. Biplot thethe
illustrating year scores
year scoresfor
forprincipal components
principal components 1 and
1 and 2 (see
2 (see Table
Table 2). 2).
Low fertility and population aging have characterized these districts in recent times [26,28,29].
Most of the Italian municipalities were classified in the range between 0.97 and 0.98: these territories—
widespread throughout the country, both inland and along the coasts—displayed demographic
dynamics associated with progressive aging and a moderate fertility decline. The J class between 0.96
and 0.97 identified municipalities with a mixed demographic structure basically found in coastal areas,
especially in central and southern Italy. These municipalities are often situated at the border of large
cities (e.g., Rome, Naples, Cagliari, Bari, Palermo) and display a relatively young population structure,
with moderately high fertility rates and intense population growth thanks to immigration from abroad.
Finally, municipalities with a Pielou J index lower than 0.96 present a particularly mixed demographic
structure, dominated by a young population in some cases (urban areas of Rome, Naples and Cagliari),
or by an adult and older population in other cases (rural and internal areas of the Northern and Central
Apennines as well as economically-marginal areas of Piedmont and Friuli Venezia Giulia).Sustainability 2019, 11, 2050 8 of 12
Sustainability 2019, 11, x FOR PEER REVIEW 8 of 12
Friuli Venezia Giulia
Piedmont
Liguria
Rome
Bari
Naples
Cagliari
Palermo
Figure
Figure 4. Spatial
4. Spatial distribution
distribution of theJ Pielou
of the Pielou J evenness
evenness index
index applied to applied to population
population structure
structure by age in
bymunicipalities
Italian age in Italian(2017).
municipalities (2017).
4. Discussion
4. Discussion
Under the assumption
Under the assumption thatthat
economic
economicdevelopment
development is a is
key component
a key component of aofsystem’s
a system’sresilience,
resilience,
socio-demographic
socio-demographic diversity makes local systems less vulnerable to external shocks withrespect
diversity makes local systems less vulnerable to external shocks with respect to
to lower-diversity contexts [1]. While greater diversity may reduce fluctuations
lower-diversity contexts [1]. While greater diversity may reduce fluctuations and uncertainty in and uncertainty
in present
presentand andfuture
futuregrowth,
growth,districts
districtswith
withhigh
highresilience
resilience areare
adapting
adapting more
more quickly
quicklyto global
to global
challenges and external shocks [5–8]. Systems with low resilience may experience
challenges and external shocks [5–8]. Systems with low resilience may experience negative negative impacts
impacts
fromfrom
population aging, unemployment and emigration [57]. Analysis of the
population aging, unemployment and emigration [57]. Analysis of the multifaceted multifaceted dimensions of
socio-demographic resilience contributes to estimating the adaptive capacity of local
dimensions of socio-demographic resilience contributes to estimating the adaptive capacity of local systems to external
shocks [58,59].
systems to In this regard,
external shocks approaches
[58,59]. Inevaluating
this regard,theapproaches
contributionevaluating
of the population structure of
the contribution to the
the socioeconomic conditions
population structure of socioeconomic
to the local systems are particularly
conditions appropriate
of local systemsforarea comparative
particularly analysis
appropriate
of system resilience [60]. A comprehensive analysis of changes over time
for a comparative analysis of system resilience [60]. A comprehensive analysis of changes in population indicators
over time
during the Italian demographic transition contributes to identifying key components
in population indicators during the Italian demographic transition contributes to identifying key of socioeconomic
resilience [61]. Asofitsocioeconomic
components is grounded in resilience
a multivariate
[61].statistical approach,inour
As it is grounded study provides
a multivariate a conceptual
statistical approach,
and our
operational perspective for a renewed understanding of long-term population
study provides a conceptual and operational perspective for a renewed understanding trends at the country of
long-term population trends at the country and regional scale, focusing on the latent interplays
between demographic patterns and processes [62]. The results of this study support the assumptionSustainability 2019, 11, 2050 9 of 12
and regional scale, focusing on the latent interplays between demographic patterns and processes [62].
The results of this study support the assumption that demographic transformations are linked with a
broad spectrum of socioeconomic conditions influencing the resilience of local systems [48].
In line with previous works grounded on different disciplinary approaches [10,41,56],
the empirical results of this study offer a reflection on the notion of regional resilience in advanced
countries, reconnecting local systems to issues of territorial disparities and socioeconomic imbalances,
considering a specific aspect of resilience resulting from the intimate characteristics of demographic
structures [40]. Our work outlines the relevance of integrated assessment frameworks for spatial
demography. In this regard, population structure by age—together with other socioeconomic aspects
characterizing local systems—is a key variable when assessing the level of resilience at the local
scale [39]. Demographic phases may reflect a dynamic balance between the population and the
evolving socioeconomic context, highlighting latent system transitions [45]. Homogeneous time
intervals featuring different demographic dynamics were identified as sequential developmental waves
in Italy. These time intervals reflect conditions of dynamic equilibrium within specific socioeconomic
contexts [15,16,43]. Population dynamics have contributed to this transition thanks to e.g., the inherent
polarization of settlements in high-density and low-density areas [42].
As it involves socioeconomic dimensions that are hard to characterize as factors of change,
the latent link between demographic structures and local development requires a more comprehensive
analysis in economically-advanced countries [60]. A comparative investigation of population age
structures over time and space can be extended to other countries in Mediterranean Europe with the
aim of identifying common resilience trends, assuming that changes in vital rates are responsible for
distinctive paths of population growth (or decline) in this region [39]. The operational framework
proposed in this study outlines the importance of novel demographic indicators in a broader framework
linking changes in population structure with the socioeconomic resilience of local systems (more or
less rapidly) adapting to global change [17].
The approach proposed in this paper contributes to identifying specific demographic patterns
and processes over time and space, in relation with the evolving socioeconomic context at different
investigation scales. Based on a simplified indicator of evenness in the population structure
by age, two homogeneous time intervals—corresponding to distinctive phases of demographic
transition—were identified in Italy: a relatively long time period between 1861 and 1936, and a
more recent phase between 1936 and 2011. Being characterized by different demographic conditions
(birth and death rates, migration, aging), these stages may reflect a dynamic balance between the
population and the evolving socioeconomic context, highlighting latent system transitions responding
to specific drivers of change and shaping the overall resilience to external shocks. A spatial analysis
of the evenness indexes applied to the population structure by age in Italian municipalities finally
identified a gradient reflecting coastal–inland disparities consolidated over time.
5. Conclusions
An explicit analysis of demographic processes allows a more comprehensive definition of
socioeconomic resilience, informing strategies aimed at stimulating the faster recovery of local systems
from external shocks. Further investigation based on such observations should operationally focus
on the (apparent and latent) effects of demographic transitions (considering together changes in
population dynamics and structure) on regional resilience. As proposed in this study, indicators
inspired to incorporate complex system thinking and renewed approaches grounded on entropy
theory seem to be appropriate to unravel the latent link between spatial demography and resilience
science, providing an improved characterization of the socioeconomic patterns and processes that
underlie regional resilience.
Author Contributions: Conceptualization, L.S.; methodology, R.T.; software, R.T.; validation, S.C.; formal analysis,
L.S. and S.C.; investigation, M.C.; resources, M.C.; data curation, R.T.; writing—original draft preparation, L.S.;
writing—review and editing, S.C.; visualization, M.C.; supervision, R.T.; funding acquisition, M.C.Sustainability 2019, 11, 2050 10 of 12
Funding: This work was supported by the Ministry of Education, Youth and Sports of CR within the National
Sustainability Program I (NPU I), grant number LO1415.
Conflicts of Interest: The authors declare no conflict of interest.
References
1. Berkes, F.; Colding, J.; Folke, C. Navigating Social–Ecological Systems: Building Resilience for Complexity and
Change; Cambridge University Press: Cambridge, UK, 2003.
2. Adger, W.N. Social and ecological resilience: Are they related. Prog. Hum. Geogr. 2000, 24, 347–364.
[CrossRef]
3. Harte, J. Human population as a dynamic factor in environmental degradation. Popul. Environ. 2007,
28, 223–236. [CrossRef]
4. Brand, F.X.; Jax, K. Focusing the meaning(s) of resilience: Resilience as a descriptive concept and a boundary
object. Ecol. Soc. 2007, 12, 23. [CrossRef]
5. Folke, C. Resilience: The emergence of a perspective for social–ecological systems analyses.
Glob. Environ. Chang. 2006, 16, 253–267. [CrossRef]
6. Holling, C.S. Understanding the complexity of economic, ecological and social systems. Ecosystems 2001,
4, 390–405. [CrossRef]
7. Folke, C.; Carpenter, S.R.; Walker, B.; Scheffer, M.; Chapin, T.; Rockström, J. Resilience thinking: Integrating
resilience, adaptability and transformability. Ecol. Soc. 2010, 15, 20. [CrossRef]
8. Carpenter, S.; Walker, B.; Anderies, J.; Abel, N. From metaphor to measurement: Resilience of what to what?
Ecosystems 2001, 4, 765–781. [CrossRef]
9. Folke, C.; Hahn, T.; Olsson, P.; Norberg, J. Adaptive governance of social-ecological systems. Annu. Rev.
Environ. Resour. 2005, 30, 441–473. [CrossRef]
10. Kelly, C.; Ferrara, A.; Wilson, G.A.; Ripullone, F.; Nolè, A.; Harmer, N.; Salvati, L. Community resilience and
land degradation in forest and shrubland socio-ecological systems: Evidence from Gorgoglione, Basilicata,
Italy. Land Use Policy 2015, 1146, 11–20. [CrossRef]
11. Karamesouti, M.; Detsis, V.; Kounalaki, A.; Vasiliou, P.; Salvati, L.; Kosmas, C. Land-use and land degradation
processes affecting soil resources: Evidence from a traditional Mediterranean cropland (Greece). Catena 2015,
132, 45–55. [CrossRef]
12. Serra, P.; Vera, A.; Tulla, A.F.; Salvati, L. Beyond urban-rural dichotomy: Exploring socioeconomic and
land-use processes of change in Spain (1991–2011). Appl. Geogr. 2014, 55, 71–81. [CrossRef]
13. Zitti, M.; Ferrara, C.; Perini, L.; Carlucci, M.; Salvati, L. Long-term urban growth and land-use efficiency in
southern europe: Implications for sustainable land management. Sustainability 2015, 7, 3359–3385. [CrossRef]
14. Duvernoy, I.; Zambon, I.; Sateriano, A.; Salvati, L. Pictures from the other side of the fringe: Urban growth
and peri-urban agriculture in a post-industrial city (Toulouse, France). J. Rural Stud. 2018, 57, 25–35.
[CrossRef]
15. Recanatesi, F.; Clemente, M.; Grigoriadis, S.; Ranalli, F.; Zitti, M.; Salvati, L. A fifty-years sustainability
assessment of Italian agro-forest districts. Sustainability 2016, 8, 32. [CrossRef]
16. Di Feliciantonio, C.; Salvati, L. ‘Southern’ alternatives of urban diffusion: Investigating settlement
characteristics and socioeconomic patterns in three mediterranean regions. Tijdschrift voor Economische
en Sociale Geografie 2015, 106, 453–470. [CrossRef]
17. Walker, B.; Gunderson, L.; Kinzig, A.; Folke, C.; Carpenter, S.; Schult, L. A Handful of heuristics and some
propositions for understanding resilience in social-ecological systems. Ecol. Soc. 2006, 11, 13. [CrossRef]
18. Cherlin, A.; Cumberworth, E.; Morgan, S.P.; Wimer, C. The effects of the great recession on family structure
and fertility. Ann. Am. Acad. Political Soc. Sci. 2013, 6501, 214–231. [CrossRef]
19. Walford, N.; Kurek, S. Outworking of the second demographic transition: National trends and regional
patterns of fertility change in Poland, and England and Wales, 2002–2012. Popul. Space Place 2016, 22, 508–525.
[CrossRef]
20. Sobotka, T.; Skirbekk, V.; Philipov, D. Economic recession and fertility in the developed world.
Popul. Dev. Rev. 2011, 37, 267–306. [CrossRef] [PubMed]Sustainability 2019, 11, 2050 11 of 12
21. Salvati, L.; Gargiulo, V.; Rontos, K.; Sabbi, A. Latent exurban development: City expansion along the
rural-to-urban gradient in growing and declining regions of southern Europe. Urban Geogr. 2013, 34, 376–394.
[CrossRef]
22. Caldwell, J.C. Demographic Transition Theory; Springer: Berlin, Germany, 2006.
23. Chesnais, J.-C. The Demographic Transition: Stages, Patterns, and Economic Implications: A Longitudinal Study of
Sixty-Seven Countries Covering the Period 1720–1984; Oxford University Press: Oxford, UK, 1993.
24. Dudley, K. The Demographic transition. Popul. Stud. 1996, 50, 361–387.
25. Myrskyla, M.; Kohler, H.-P.; Billari, F. Advances in development reverse fertility declines. Nature 2009,
460, 741–743. [CrossRef]
26. Billari, F.C.; Kohler, H.-P.; Andersson, G.; Lundström, H. Approaching the limit: Long-term trends in late
and very late fertility. Popul. Develop. Rev. 2007, 33, 149–170. [CrossRef]
27. Modena, F.; Rondinelli, C.; Sabatini, F. Economic insecurity and fertility intentions: The case of italy.
Rev. Income Wealth 2014, 60, S233–S255. [CrossRef]
28. Vignoli, D.; Drefahl, S.; De Santis, G. Whose job instability affects the likelihood of becoming a parent in
Italy? A tale of two partners. Demogr. Res. 2012, 26, 42–62. [CrossRef]
29. Cazzola, A.; Pasquini, L.; Angeli, A. The relationship between unemployment and fertility in Italy:
A time-series analysis. Demogr. Res. 2016, 34, 1–38. [CrossRef]
30. Tragaki, A.; Bagavos, C. Male fertility in Greece: Trends and differentials by educational level and
employment status. Demogr. Res. 2014, 31, 137–160. [CrossRef]
31. Schneider, D. The great recession, fertility, and uncertainty: Evidence from the united states.
J. Marriage Family 2015, 77, 1144–1156. [CrossRef]
32. Goldstein, J.; Kreyenfeld, M.; Jasilioniene, A.; Örsal, D.D.K. Fertility reactions to the “great recession” in
Europe: Recent evidence from order-specific data. Demogr. Res. 2013, 29, 85–104. [CrossRef]
33. Caltabiano, M.; Castiglioni, M.; Rosina, A. Lowest-low fertility: Signs of a recovery in Italy? Demogr. Res.
2009, 21, 681–718. [CrossRef]
34. Kreyenfeld, M.; Andersson, G.; Pailhé, A. Economic uncertainty and family dynamics in Europe: Introduction.
Demogr. Res. 2012, 27, 835–852. [CrossRef]
35. Ciganda, D. Unstable work histories and fertility in france: An adaptation of sequence complexity measures
to employment trajectories. Demogr. Res. 2015, 32, 843–876. [CrossRef]
36. Del Bono, E.; Weber, A.; Winter-Ebmer, R. Fertility and economic instability: The role of unemployment and
job displacement. J. Popul. Econ. 2015, 28, 46–479.
37. Costanza, R.; d’Arge, R.; De Groot, R.; Farber, S.; Grasso, M.; Hannon, B.; Raskin, R.G. The value of the
world’s ecosystem services and natural capital. Nature 1997, 387, 253. [CrossRef]
38. Van den Bergh, J.C.J.M.; Stagl, S. Coevolution of economic behavior and institutions: Towards a theory of
institutional change. J. Evol. Econ. 2003, 13, 289–317. [CrossRef]
39. Crews, K.A.; Peralvo, M.F. Segregation and fragmentation: Extending landscape ecology and pattern metrics
analysis to spatial demography. Popul. Res. Policy Rev. 2008, 27, 65–88. [CrossRef]
40. Wagmiller, R.L. Race and the spatial segregation of jobless men in urban America. Demography 2007,
44, 539–562. [CrossRef]
41. Ferrara, A.; Kelly, C.; Wilson, G.; Nolè, A.; Mancino, G.; Bajocco, S.; Salvati, L. Shaping the role of ‘fast’ and
‘slow’ drivers of change in forest-shrubland socio-ecological systems. J. Environ. Manag. 2016, 169, 155–166.
[CrossRef] [PubMed]
42. Colantoni, A.; Mavrakis, A.; Sorgi, T.; Salvati, L. Towards a ‘polycentric’ landscape? Reconnecting fragments
into an integrated network of coastal forests in rome. Rendiconti Accademia Nazionale dei Lincei 2015,
26, 615–624. [CrossRef]
43. Ferrara, C.; Carlucci, M.; Grigoriadis, S.; Corona, P.; Salvati, L. A comprehensive insight into the geography
of forest cover in Italy: Exploring the importance of socioeconomic local contexts. Forest Policy Econ. 2017,
75, 12–22. [CrossRef]
44. Gowdy, J.M. The social context of natural capital: The social limits to sustainable development. Int. J.
Soc. Econ. 1994, 21, 43–55. [CrossRef]
45. Kallis, G. Socio-environmental coevolution: Towards an analytical approach. Int. J. Sustain. Dev. World Ecol.
2007, 14, 9–19. [CrossRef]
46. Istat. Atlante Statistico dei Comuni; Istituto Nazionale di Statistica: Roma, Italy, 2006.Sustainability 2019, 11, 2050 12 of 12
47. Zambon, I.; Serra, P.; Sauri, D.; Carlucci, M.; Salvati, L. Beyond the ‘Mediterranean city’: Socioeconomic
disparities and urban sprawl in three Southern European cities. Geographiska Annaler B 2017, 99, 319–337.
[CrossRef]
48. Salvati, L.; Carlucci, M.; Venanzoni, G. Recession, resilience, local labour markets: Wealthier is better?
Lett. Spat. Res. Sci. 2017, 10, 177–204. [CrossRef]
49. Biasi, R.; Colantoni, A.; Ferrara, C.; Ranalli, F.; Salvati, L. In-between sprawl and fires: Long-term forest
expansion and settlement dynamics at the wildland-urban interface in Rome, Italy. Int. J. Sustain. Dev.
World Ecol. 2015, 22, 467–475. [CrossRef]
50. Salvati, L. Agro-forest landscape and the ‘fringe’ city: A multivariate assessment of land-use changes in a
sprawling region and implications for planning. Sci. Total Environ. 2014, 490, 715–723. [CrossRef]
51. Zambon, I.; Colantoni, A.; Cecchini, M.; Mosconi, E.M. Rethinking sustainability within the viticulture
realities integrating economy, landscape and energy. Sustainability 2018, 10, 320. [CrossRef]
52. Colantoni, A.; Marucci, A.; Monarca, D.; Pagniello, B.; Cecchini, M.; Bedini, R. The risk of musculoskeletal
disorders due to repetitive movements of upper limbs for workers employed to vegetable grafting. J. Food
Agric. Environ. 2012, 10, 14–18.
53. Anifantis, A.S.; Colantoni, A.; Pascuzzi, S. Thermal energy assessment of a small scale photovoltaic, hydrogen
and geothermal stand-alone system for greenhouse heating. Renew. Energy 2017, 103, 115–127. [CrossRef]
54. Salvati, L.; Zitti, M.; Ceccarelli, T. Integrating economic and environmental indicators in the assessment of
desertification risk: A case study. Appl. Ecol. Environ. Res. 2008, 6, 129–138. [CrossRef]
55. Colantoni, A.; Ferrara, C.; Perini, L.; Salvati, L. Assessing trends in climate aridity and vulnerability to soil
degradation in Italy. Ecol. Indic. 2015, 48, 599–604. [CrossRef]
56. Salvati, L.; Serra, P. Estimating rapidity of change in complex urban systems: A multidimensional, local-scale
approach. Geogr. Anal. 2016, 48, 132–156. [CrossRef]
57. Rubiera-Morollón, F.; del Rosal, I.; Díaz-Dapena, A. Can large cities explain the aggregate movements of
economies? Testing the ‘granular hypothesis’ for US counties. Lett. Spat. Res. Sci. 2015, 8, 109–118. [CrossRef]
58. Fernandez-Vazquez, E.; Lemelin, A.; Rubiera-Morollón, F. Applying entropy econometrics to estimate data
at a disaggregated spatial scale. Lett. Spat. Res. Sci. 2014, 7, 159–169. [CrossRef]
59. Kallis, G.; Norgaard, R.B. Coevolutionary ecological economics. Ecol. Econ. 2010, 69, 690–699. [CrossRef]
60. Carlucci, M.; Grigoriadis, E.; Rontos, K.; Salvati, L. Revisiting a hegemonic concept: Long-term
‘mediterranean urbanization’ in between city re-polarization and metropolitan decline. Appl. Spat.
Anal. Policy 2017, 10, 347–362. [CrossRef]
61. Ward, H. The co-evolution of regimes of accumulation and patterns of rule: State autonomy and the
possibility of functional responses to crisis. N. Political Econ. 2003, 8, 179–202. [CrossRef]
62. Safarzynska, K.; van den Bergh, J.C.J.M. Demand-supply coevolution with multiple increasing returns:
Policy analysis for unlocking and system transitions. Technol. Forecast. Soc. Chang. 2010, 77, 297–317.
[CrossRef]
© 2019 by the authors. Licensee MDPI, Basel, Switzerland. This article is an open access
article distributed under the terms and conditions of the Creative Commons Attribution
(CC BY) license (http://creativecommons.org/licenses/by/4.0/).You can also read