Galectin 3 gene deletion results in defective adipose tissue maturation and impaired insulin sensitivity and glucose homeostasis - Nature
←
→
Page content transcription
If your browser does not render page correctly, please read the page content below
www.nature.com/scientificreports

                OPEN             Galectin‑3 gene deletion
                                 results in defective adipose
                                 tissue maturation and impaired
                                 insulin sensitivity and glucose
                                 homeostasis
                                 Claudia Blasetti Fantauzzi1,4, Carla Iacobini1,4, Stefano Menini1, Martina Vitale1,
                                 Gian Pio Sorice2, Teresa Mezza2, Saverio Cinti3, Andrea Giaccari2 & Giuseppe Pugliese1*

                                 Adiposopathy is a pathological adipose tissue (AT) response to overfeeding characterized by reduced
                                 AT expandability due to impaired adipogenesis, which favors inflammation, insulin resistance (IR),
                                 and abnormal glucose regulation. However, it is unclear whether defective adipogenesis causes
                                 metabolic derangement also independently of an increased demand for fat storage. As galectin-3 has
                                 been implicated in both adipocyte differentiation and glucose homeostasis, we tested this hypothesis
                                 in galectin-3 knockout (Lgal3−/−) mice fed a standard chow. In vitro, Lgal3−/− adipocyte precursors
                                 showed impaired terminal differentiation (maturation). Two-month-old Lgal3−/− mice showed impaired
                                 AT maturation, with reduced adipocyte size and expression of adipogenic genes, but unchanged fat
                                 mass and no sign of adipocyte degeneration/death or ectopic fat accumulation. AT immaturity was
                                 associated with AT and whole-body inflammation and IR, glucose intolerance, and hyperglycemia.
                                 Five-month-old Lgal3−/− mice exhibited a more mature AT phenotype, with no difference in insulin
                                 sensitivity and expression of inflammatory cytokines versus WT animals, though abnormal glucose
                                 homeostasis persisted and was associated with reduced β-cell function. These data show that
                                 adipogenesis capacity per se affects AT function, insulin sensitivity, and glucose homeostasis
                                 independently of increased fat intake, accumulation and redistribution, thus uncovering a direct link
                                 between defective adipogenesis, IR and susceptibility to diabetes.

                                 Abbreviations
                                 AT	Adipose tissue
                                 IR	Insulin resistance
                                 PPAR	Peroxisome proliferator-activated receptor
                                 Lgals3−/−	Galectin 3 knockout
                                 WT	Wild-type
                                 SVF	Stromal vascular precursor
                                 SAT	Subcutaneous AT
                                 Dlk1	Preadipocyte factor 1 or Delta Like Non-Canonical Notch Ligand gene
                                 Pparg	PPARγ gene
                                 CEBP	Ccaat-Enhancer-Binding Protein
                                 Cebpb	CEBP β gene
                                 Pnpla2	Adipose Triglyceride Lipase or Patatin Like Phospholipase Domain Containing 2 gene
                                 Srebf1	Sterol Regulatory Element Binding Transcription Factor 1 gene
                                 Acaca	Acetyl-CoA Carboxylase α gene

                                 1
                                  Department of Clinical and Molecular Medicine, “La Sapienza” University, Via di Grottarossa, 1035‑1039,
                                 00189 Rome, Italy. 2Centre for Endocrine and Metabolic Diseases, Fondazione Policlinico Universitario A. Gemelli
                                 IRCCS, Catholic University, Rome, Italy. 3Department of Experimental and Clinical Medicine, Center of Obesity,
                                 University of Ancona (Politecnica delle Marche), Ancona, Italy. 4These authors contributed equally: Claudia Blasetti
                                 Fantauzzi and Carla Iacobini. *email: giuseppe.pugliese@uniroma1.it

Scientific Reports |   (2020) 10:20070               | https://doi.org/10.1038/s41598-020-76952-z                                                  1

                                                                                                                                              Vol.:(0123456789)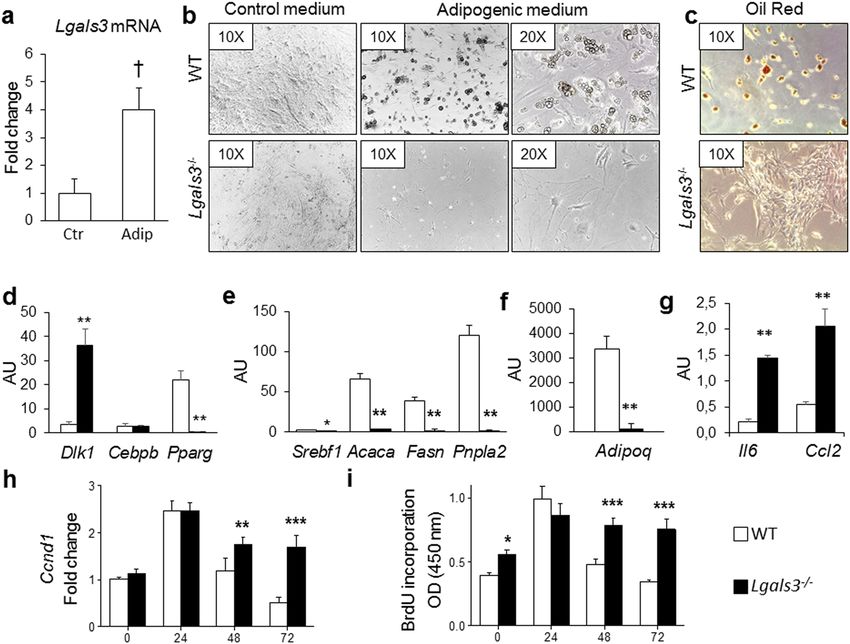
www.nature.com/scientificreports/
Fasn Fatty Acid Synthase gene
Adipoq Adiponectin gene
IL Interleukin
Il6 IL-6 gene
Ccl2 Monocyte chemoattractant protein 1 or C–C Motif Chemokine Ligand 2 gene
Ccnd1 Cyclin D1 gene
BrdU 5-Bromo-2′-deoxyuridine
VAT Visceral AT
Cebpa CEBP α gene
Fabp4 Fatty acid binding protein 4 gene
Lep Leptin gene
Cdf Adipsin or Complement Factor D gene
BAT Brown AT
Cidea Cell Death-Inducing DFFA-Like Effector A gene
Ppara PPARα gene
Ucp1 Uncoupling Protein 1 gene
NEFAs Non-esterified fatty acids
TNF Tumor necrosis factor
Tnfa Tumor necrosis factor -α gene
Il1b IL-1β gene
ER Endoplasmic reticulum
Hspa5 Heat Shock Protein Family A Member 5 gene
Ddit3 C/EBP-Homologous Protein 10 or DNA Damage Inducible Transcript 3 gene
Xbp1 Tax-Responsive Element-Binding Protein 5 or X-Box Binding Protein 1 gene
Fn1 Fibronectin 1 gene
Cola1a1 Collagen Type I Alpha 1 Chain gene
Cola4a1 Collagen Type IV Alpha 1 Chain gene
Cola6a1 Collagen Type VI Alpha 1 Chain gene
Slc2a4 Glucose Transporter Type 4 or Solute Carrier Family 2 Member 4 gene
Irs1 Insulin Receptor Substrate 1 gene
Insr Insulin Receptor gene
IPGTT Intraperitoneal glucose tolerance test
HOMA Homeostasis model assessment
HOMA-IR HOMA-insulin resistance
Cd68 Cluster of differentiation 68
HOMA-%β HOMA-β-cell function
Actb β-Actin gene
The ongoing epidemics of obesity and diabetes have focused attention on adipose tissue (AT)1, as fat accumula-
tion is causally related to insulin resistance (IR) and type 2 d iabetes2. However, the existence of both metaboli-
cally healthy obese individuals and unhealthy insulin-resistant lean (metabolically obese) subjects3 indicates
that it is not just a matter of absolute quantity of fat and shifts the focus on dysfunction of AT and remodeling
of AT depots, i.e., the so-called a diposopathy4,5. Adiposopathy is a pathological AT response to positive caloric
balance in susceptible individuals contributing to increased cardiometabolic risk. It is characterized by limited
AT plasticity, i.e., reduced capacity to expand and accommodate the surplus of e nergy6. Expansion of AT relies
upon adipogenesis, the process by which pluripotent mesenchymal stem cells commit to the adipose lineage to
become pre-adipocytes, which then differentiate into adipocytes by undergoing mitotic clonal expansion, fol-
lowed by growth arrest and terminal differentiation with acquisition of a mature phenotype, i.e., expression of
adipocyte genes and accumulation of t riglycerides7. The overall AT capacity to store excess fat is dependent upon
the ability of increasing both adipocyte number and size without achieving a critical cell v olume4. When this
capacity is overwhelmed, adipocytes degenerate and die by p yroptosis8, with consequent fibrosis and macrophage
9
infiltration . These processes ultimately lead to ectopic fat accumulation, tissue and systemic inflammation
and IR, and development of type 2 diabetes10,11. While the role of adiposopathy in the pathological response to
positive caloric balance is well established, it is unclear whether impaired adipogenesis per se may affect insulin
sensitivity and glucose homeostasis, independently of an increased demand for fat storage.
Among the factors that control adipogenesis by regulating the various steps in the commitment and differen-
tiation programs7, there is galectin-312, a multifunctional protein involved in many physiological and pathological
processes13,14. In human AT, galectin-3 was found to be expressed also by a dipocytes15, where it is modulated
during cell d ifferentiation16. Moreover, Baek et al. reported that galectin-3 induces nuclear translocation and acti-
vation of peroxisome proliferator-activated receptor (PPAR) γ in 3T3-L1 cells, whereas both mouse embryonic
fibroblasts isolated from galectin 3 knockout (Lgals3−/−) mice and stably galectin-3-silenced 3T3-L1 cells show
delayed adipogenic d ifferentiation17. They also found that aged (17-month-old) Lgals3−/− mice display reduced
body weight associated with decreased epididymal AT size and expression of adipogenic and lipogenic genes
compared with wild-type (WT) mice17. Finally, other studies reported unchanged weight gain associated with
either increased blood glucose levels in younger (3-to-5-month-old)18,19 or improved glucose regulation in older
(8-month-old)20 Lgals3−/− versus WT mice.
To date, the relationship between decreased AT expression of adipogenic and lipogenic g enes17 and impaired
glucose homeostasis associated with unchanged body weight18,19 in Lgals3−/− mice fed a standard chow remains
Scientific Reports | (2020) 10:20070 | https://doi.org/10.1038/s41598-020-76952-z 2
Vol:.(1234567890)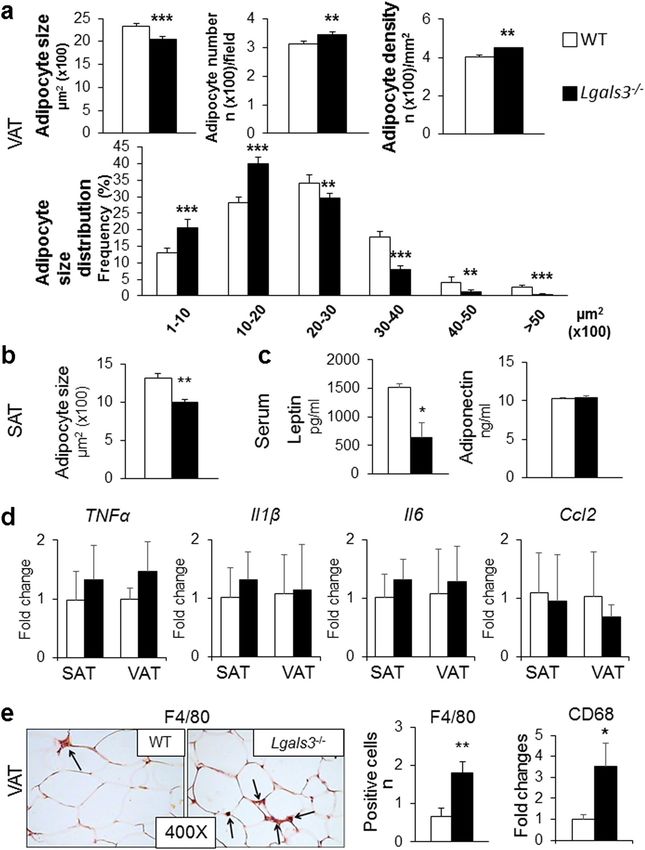
www.nature.com/scientificreports/

                                  Figure 1.  In vitro adipogenic differentiation of SVF cells. Lgals3 mRNA levels from SVF cells of WT mice
                                  cultured in normal control (Ctr) or adipogenic (Adip) medium (a); representative images of adipogenic
                                  differentiation of SVF cells isolated from SAT of WT and Lgals3−/− mice, cultured in control or adipogenic
                                  medium for 14 days (original magnification, 10X or 20X) (b); oil-Red-O staining of WT and Lgals3−/− SVF cells
                                  induced to differentiation (c); qRT-PCR analysis of genes involved in adipogenesis (Dlk1, Cebpb, and Pparg) (d),
                                  lipid metabolism (Srebf1, Acaca, Fasn, and Pnpl + a2) (e), adipokine synthesis (Adipoq) (f), inflammation (Il6
                                  and Ccl2) (g), and proliferation (Ccnd1) (h); and analysis of BrdU incorporation (i) from SVF cells induced to
                                  differentiation of WT and Lgals3−/− mice. Values represent the mean ± SD of two independent experiments (n = 3
                                  mice per group per experiment). †P < 0.01 versus control medium; *P < 0.05, **P < 0.01, or ***P < 0.001 versus
                                  WT.

                                  unexplored. The aim of this study was to gain pathophysiological insights into the role of AT dysfunction due
                                  to defective adipogenesis in the impaired glucose regulation occurring in Lgals3−/− mice in the absence of an
                                  increased demand for fat storage. To this end, the Lgals3−/− mouse appears to be a suitable model for testing
                                  the working hypothesis that impaired adipogenesis may directly affect glucose homeostasis and contribute to
                                  metabolic derangement independently of environmental obesogenic or diabetogenic stimuli.

                                  Results
                                  In vitro studies. Adipogenic differentiation of adipocyte precursors. Adipose-derived stromal vascular frac-
                                  tion (SVF) precursor cells were isolated from subcutaneous AT (SAT) of WT and Lgals3−/− and exposed to an
                                  adipogenic medium. Under these conditions, Lgals3 expression increased in SVF cells from WT mice (Fig. 1a).
                                  The SVF cells from Lgals3−/− mice, though replicated well in culture, showed impaired adipogenesis, maintaining
                                  an immature (fibroblast-like) phenotype (Fig. 1b) with negative Oil-Red-O staining even after 14 days (Fig. 1c).
                                  Conversely, the SVF cells from WT mice differentiated into round shaped adipocytes (Fig. 1b), filled with Oil-
                                  Red-O positive lipid droplets (Fig. 1c). Consistently, Lgals3−/− cells showed higher Preadipocyte factor 1 or Delta
                                  Like Non-Canonical Notch Ligand (Dlk1) (Fig. 1d) and lower PPARγ (Pparg), but unchanged Ccaat-Enhancer-
                                  Binding Protein (CEBP) β (Cebpb) gene expression levels (Fig. 1d), as compared with WT cells. The mRNA
                                  levels of the genes involved in lipid metabolism Adipose Triglyceride Lipase or Patatin Like Phospholipase Do-
                                  main Containing 2 (Pnpla2), Sterol Regulatory Element Binding Transcription Factor 1 (Srebf1), Acetyl-CoA

Scientific Reports |   (2020) 10:20070 |               https://doi.org/10.1038/s41598-020-76952-z                                                  3

                                                                                                                                              Vol.:(0123456789)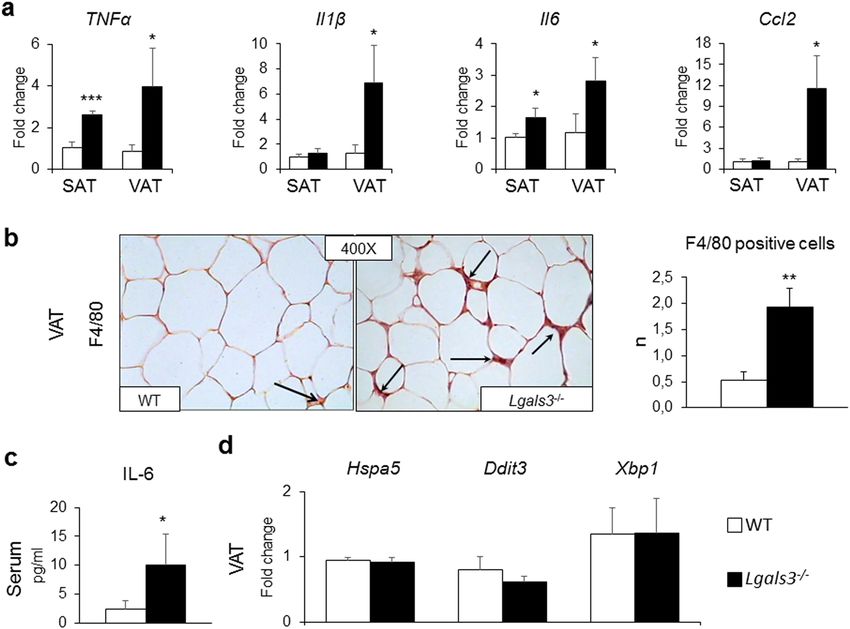
www.nature.com/scientificreports/
Carboxylase α (Acaca), Fatty Acid Synthase (Fasn) (Fig. 1e) and the adiponectin gene (Adipoq) (Fig. 1f) were
also lower, whereas those of the inflammatory markers interleukin (IL)-6 (Il6) and monocyte chemoattractant
protein 1 or C–C Motif Chemokine Ligand 2 (Ccl2) were higher (Fig. 1g) in Lgals3−/− versus WT cells. In addi-
tion, the mitotic clonal expansion following adipogenesis induction was abnormally regulated in Lgals3−/− SVF
cells. In fact, the expression of the gene coding for the cell cycle regulator cyclin D1 (Ccnd1), which is required
for G1/S transition and is degraded as the cell enters the S phase (Fig. 1h), and the incorporation of the prolif-
eration marker 5-bromo-2′-deoxyuridine (BrdU) (Fig. 1i) showed little or no decrease, respectively, 48 and 72 h
after exposure to adipogenic medium in SVF cells from Lgals3−/− mice, at variance with those from wild type
animals. In addition, baseline BrUD incorporation was higher in Lgals3−/− versus wild type SVF cells.
Lipid metabolism in mature adipocytes. To rule out the possibility that the reduced lipid accumulation detected
in adipocytes derived from Lgals3−/− SVF cells was due impaired lipid metabolism instead of defective adipogen-
esis, Lgals3 was silenced in mature adipocytes. No differences were observed in the gene expression for lipogenic
and lipolytic enzyme between silenced and non-silenced cells (Supplementary Fig. 2).
In vivo/ex vivo studies. The growth curve did not differ between the two genotypes throughout the study
(Supplementary Fig. 1a), as did food intake (not shown). Conversely, fasting plasma glucose levels showed a
trend toward an increase in Lgals3−/−Lgals3−/− versus WT mice, which became significant at 3 months of age
(Supplementary Fig. 1b). The animals were studied at 2 and 5 months of age.
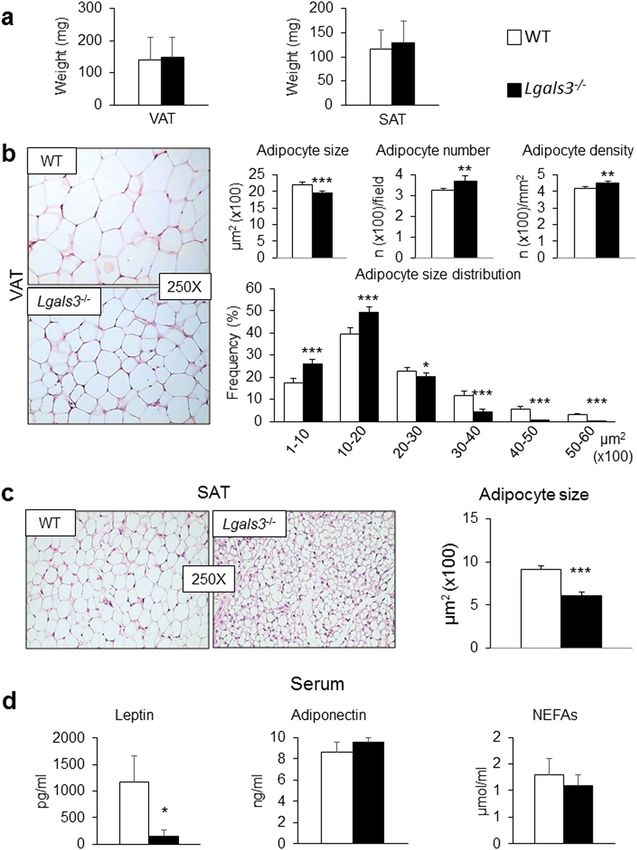
Two‑month‑old mice. AT phenotype. Lgals3−/− mice showed no change in visceral AT (VAT) or SAT
mass compared to coeval WT mice (Fig. 2a). No obvious sign of adipocyte degeneration was observed in VAT
from Lgals3−/− mice (Fig. 2b). Morphometric analysis revealed a significant decrease in average adipocyte size
in VAT (Fig. 2b) and particularly in SAT (Fig. 2c) of Lgals3−/− mice. Moreover, VAT from Lgals3−/− mice showed
a higher number and density of adipocytes as well as a change in adipocyte size distribution, with a higher fre-
quency of smaller adipocytes (Fig. 2b). Furthermore, the transcriptional levels of genes involved in adipogenesis
(Pparg and CEBP α [Cebpa] in SAT and VAT), and lipogenesis (Srebf1 in SAT and Acaca in VAT) as well as of
genes coding for adipokines (leptin [Lep] in SAT and VAT and Adipsin or Complement Factor D [Cdf] only in
SAT) were reduced in Lgals3−/− versus WT mice (Table 1). Transcripts for Pparg, Srebf1, Acaca, and Fasn were
reduced in brown AT (BAT) (Table 1). The expression levels of the “browning” genes Cell Death-Inducing DF-
FA-Like Effector A (Cidea) and PPARα (Ppara) were also lower in SAT from Lgals3−/− versus WT mice. Further-
more, the gene expression for Uncoupling Protein 1 (Ucp1) was significantly reduced in BAT of Lgals3−/− versus
WT mice (Table 1). Circulating leptin was markedly reduced in Lgals3−/− versus WT mice, whereas adiponectin
and non-esterified fatty acid (NEFA) levels were unchanged (Fig. 2d).
AT and systemic inflammation. The gene expression of tumor necrosis factor (TNF)-α (Tnfa) and Il6 were sig-
nificantly increased in both SAT and VAT, whereas the mRNA levels of IL-1β (Il1b) and Ccl2 were increased only
in VAT of Lgals3−/− versus WT mice (Fig. 3a). Immunohistochemical analysis revealed a higher number of F4/80
positive cells in VAT of Lgals3−/− animals (Fig. 3b). However, no crown-like structures or dead/dying adipocytes,
i.e., negative for the lipid droplet coating protein perilipin-121, were observed (Supplementary Fig. 3). In sera,
the concentration of IL-6 was significantly higher in Lgals3−/− than in WT mice (Fig. 3c), whereas TNF-α and
IL-1β levels were below the limit of detectability in both genotypes. No difference was observed between the two
genotypes in the VAT expression of genes coding for the endoplasmic reticulum (ER) stress markers Heat Shock
Protein Family A Member 5 (Hspa5), C/EBP-Homologous Protein 10 or DNA Damage Inducible Transcript
3 (Ddit3), and Tax-Responsive Element-Binding Protein 5 or X-Box Binding Protein 1 (Xbp1) (Fig. 3d). The
mRNA levels of Collagen Type I Alpha 1 Chain (Cola1a1) and Collagen Type I Alpha 1 Chain (Cola4a1) were
significantly increased only in BAT of Lgals3−/− versus WT mice, whereas levels of these and other genes involved
in fibrosis (i.e., Fibronectin 1 [Fn1] and Collagen Type VI Alpha 1 Chain [Cola6a1]) were comparable between
the two genotypes in both VAT and SAT (Table 1).
Tissue insulin sensitivity. Lgals3−/− mice showed a significant decrease in the gene expression of Glucose Trans-
porter Type 4 or Solute Carrier Family 2 Member 4 (Slc2a4) in SAT, VAT, and BAT and Insulin Receptor Sub-
strate 1 (Irs1) in SAT, as compared to WT animals (Table 1). Insulin-stimulated AKT phosphorylation and glu-
cose uptake were markedly decreased in VAT from Lgals3−/− versus WT mice (Fig. 4a-b), whereas no significant
difference in glucose uptake was observed in skeletal muscle (Fig. 4c).
Systemic insulin sensitivity and glucose homeostasis. Lgals3−/− mice showed unchanged fasting plasma glucose
levels with an exaggerated glycemic response to the intraperitoneal glucose tolerance test (IPGTT) (Fig. 4d)
as well as increased insulin levels, as compared to WT mice (Fig. 4e). The homeostasis model assessment
(HOMA)—insulin resistance (IR) index was also increased in Lgals3−/− versus wild type mice (Fig. 4f) and the
euglycemic-hyperinsulinemic clamp confirmed the lower whole-body insulin sensitivity in the Lgals3−/− animals
(Fig. 4g).
Five‑month‑old mice. AT phenotype. A substantial improvement in SAT and VAT maturation was ob-
served in Lgals3−/− mice, which showed similar gene expression levels of almost all markers of adipogenesis and
lipid metabolism to those of WT mice (Table 2). However, adipocyte size remained significantly lower in both
VAT (Fig. 5a) and SAT (Fig. 5b), and the number and density of VAT adipocytes as well as the frequency of
Scientific Reports | (2020) 10:20070 | https://doi.org/10.1038/s41598-020-76952-z 4
Vol:.(1234567890)www.nature.com/scientificreports/
Figure 2. AT phenotype and serum levels of adipokines and NEFAs in WT and Lgals3−/− mice aged 2 months.
Weight of VAT and SAT (a); representative haematoxylin–eosin images of VAT (b) and SAT (c) (original
magnification, 250X), quantification of size of adipocytes from VAT (b) and SAT (c), and number, density
and size distribution of adipocytes from VAT (b) from WT and Lgals3−/− mice; and serum levels of leptin,
adiponectin and NEFAs in WT and Lgals3−/− mice (d). Values represent the mean ± SD (n = 6 mice per
genotype). White bars = WT mice; black bars = Lgals3−/− mice; *P < 0.05, **P < 0.01 or ***P < 0.001 versus WT.
Scientific Reports | (2020) 10:20070 | https://doi.org/10.1038/s41598-020-76952-z 5
Vol.:(0123456789)www.nature.com/scientificreports/
SAT VAT BAT
WT Lgals3−/− WT Lgals3−/− WT Lgals3−/−
Adipogenesis
Cebpb 0.91 ± 0.41 0.31 ± 0.16† 1.80 ± 1.48 1.77 ± 0.99 1.45 ± 0.47 0.91 ± 0.31
Pparg 0.61 ± 0.25 0.42 ± 0.29* 1.31 ± 0.68 0.96 ± 0.39* 1.03 ± 0.24 0.57 ± 0.16*
Cebpa 0.61 ± 0.24 0.27 ± 0.16* 1.04 ± 0.56 0.56 ± 0.17* 0.90 ± 0.13 0.71 ± 0.08
Lipolysis
Pnpla2 0.47 ± 0.31 0.21 ± 0.10 0.81 ± 0.62 0.64 ± 0.39 0.93 ± 0.16 0.72 ± 0.15
Lipogenesis
Srebf1 0.90 ± 0.39 0.49 ± 0.06* 1.07 ± 0.45 1.14 ± 0.32 0.93 ± 0.06 0.59 ± 0.04‡
Acaca 0.68 ± 0.39 0.63 ± 1.19 0.89 ± 0.32 0.54 ± 0.14* 1.03 ± 0.24 0.17 ± 0.04†
Fasn 0.68 ± 0.76 0.81 ± 1.31 1.09 ± 0.50 0.70 ± 0.68 0.93 ± 0.06 0.13 ± 0.04‡
Fabp4 0.54 ± 0.34 0.24 ± 0.09 0.80 ± 0.60 0.56 ± 0.25 1.03 ± 0.33 0.66 ± 0.09
Adipokines
Lep 0.42 ± 0.33 0.10 ± 0.08* 0.56 ± 0.29 0.17 ± 0.12* 0.80 ± 0.21 0.44 ± 0.26
Adipoq 0.73 ± 0.28 0.45 ± 0.19 1.22 ± 0.64 0.81 ± 0.23 1.04 ± 0.40 0.80 ± 0.20
Cfd 0.83 ± 0.46 0.33 ± 0.12* 1.40 ± 1.02 0.87 ± 0.33 1.10 ± 0.37 0.87 ± 0.12
Browning
Cidea 0.34 ± 0.37 0.08 ± 0.02* 0.87 ± 0.86 0.65 ± 0.85 0.95 ± 0.18 0.72 ± 0.19
Ppara 0.50 ± 0.36 0.13 ± 0.06* 1.59 ± 0.99 1.12 ± 0.73 1.17 ± 0.36 0.74 ± 0.25
Ucp1 N/A N/A N/A N/A 0.91 ± 0.17 0.42 ± 0.16*
Insulin signaling
Slc2a4 0.45 ± 0.38 0.06 ± 0.08* 1.35 ± 0.35 0.73 ± 0.22‡ 0.97 ± 0.04 0.31 ± 0.08‡
Insr 0.70 ± 0.30 0.47 ± 0.15 1.10 ± 0.34 1.42 ± 0.39 1.04 ± 0.17 0.87 ± 0.04
Irs1 0.84 ± 0.23 0.50 ± 0.24* 1.02 ± 0.60 0.70 ± 0.25 1.46 ± 0.94 1.12 ± 0.24
Fibrosis
Fn1 1.67 ± 1.73 0.64 ± 0.22 2.32 ± 1.72 3.65 ± 1.06 1.14 ± 0.17 0.94 ± 0.06
Cola1a1 3.32 ± 4.22 2.76 ± 2.96 1.44 ± 0.85 3.01 ± 1.75 0.92 ± 0.10 1.36 ± 0.17*
Cola4a1 0.49 ± 0.29 0.25 ± 0.10 0.84 ± 0.56 1.02 ± 0.66 0.97 ± 0.13 1.26 ± 0.01*
Cola6a1 0.58 ± 0.24 0.36 ± 0.12 1.06 ± 0.68 1.51 ± 1.28 0.98 ± 0.03 1.47 ± 0.41
Table 1. Adipogenesis, lipid metabolism and fibrosis in adipose tissue of 2-month-old mice. Expression of
genes involved in adipogenesis, white and brown/beige lipid metabolism, insulin signaling, and fibrosis in
SAT, VAT and BAT from 2-month-old WT and Lgals3−/− mice. Values represent the mean ± SD (n = 7 per
genotype). P values calculated by t-test between WT and Lgals3−/−: *P < 0.05; †P < 0.01 and ‡P < 0.001 versus the
corresponding WT mice.
smaller cells remained significantly higher (Fig. 5a), compared to WT mice. In addition, serum concentration
of leptin remained lower in Lgals3−/− than in WT mice, and adiponectin levels continued to be similar between
the two genotypes (Fig. 5c).
AT and systemic inflammation. Both AT and systemic inflammation reversed almost completely in Lgals3−/−,
with no difference in transcript levels of inflammatory cytokines versus WT animals (Fig. 5d) and serum TNF-
α, IL-1β, and IL-6 below the limit of detectability in both genotypes. However, the number of macrophages
remained significantly higher in VAT of 5-month-old Lgals3−/− versus wild type mice, as assessed by both F4/80-
positive cell count and expression of the gene coding for Cluster of Differentiation 68 (Cd68) macrophage
marker (Fig. 5e).
Tissue insulin sensitivity. Insulin-dependent AKT activation and glucose uptake in VAT (Fig. 6a,b) and glucose
uptake in muscle (Fig. 6c) were similar in Lgals3−/− and WT mice.
Systemic insulin sensitivity and glucose homeostasis. Fasting plasma glucose levels were significantly higher
(Fig. 6d) and the glucose response to the IPGTT remained abnormal (Fig. 6e) in Lgals3−/−. Insulin levels
decreased markedly in Lgals3−/− mice and became significantly lower than in WT animals (Fig. 6f), with a signif-
icant reduction in the HOMA-β-cell function (HOMA-%β) index (Fig. 6g). The euglycemic-hyperinsulinemic
clamp demonstrated comparable systemic insulin sensitivity in Lgals3−/− and WT mice (Fig. 6h).
Scientific Reports | (2020) 10:20070 | https://doi.org/10.1038/s41598-020-76952-z 6
Vol:.(1234567890)www.nature.com/scientificreports/
Figure 3. Tissue and systemic inflammation in WT and Lgals3−/− mice aged 2 months. qRT-PCR analysis of
the inflammatory markers Tnfa, Il1b, Il6, and Ccl2 in SAT and VAT (a); representative immunohistochemical
staining for F4/80 (original magnification, 400X; black arrows = macrophages), and measurement of positive cell
number in VAT (b); serum levels of IL-6 (c); and qRT-PCR analysis of the ER stress markers Hspa5, Ddit3, and
Xbp1 in VAT (d) in WT and Lgals3−/− mice. Values represent the mean ± SD (n = 6 mice per genotype). White
bars = WT mice; black bars = Lgals3−/− mice; *P < 0.05, **P < 0.01 or ***P < 0.001 versus WT.
Discussion
This study indicates that, under normal feeding conditions, Lgals3 deletion results in impaired terminal adipo-
genic differentiation associated with AT dysfunction and inflammation, IR, and altered glucose regulation, in
the absence of obvious signs of adipocyte degeneration/death and changes in both the amount and distribution
of body fat. From a pathomechanistic point of view, our data support the concept that AT dysfunction limit-
ing tissue plasticity and fat storage capacity may derive not only by a reduced hyperplastic AT response due to
defective recruitment and expansion of adipocyte precursors (first step of adipogenesis), but also by a failure
of adipocytes to accumulate lipids, due to defective terminal differentiation of pre-adipocytes into fully mature
cells (second step of adipogenesis).
Deletion of Lgals3 led to severely impaired adipogenesis in vitro. The SVF cells isolated from Lgals3−/− mice
failed to undergo growth arrest and terminal differentiation into mature adipocytes following adipogenic induc-
tion, with consequent uninterrupted clonal expansion and impaired expression of adipocyte genes and reduced
accumulation of triglycerides. This extreme in vitro phenotype translated into a less severe in vivo phenotype,
characterized by delayed AT maturation and function, as shown by the reduced expression of genes involved in
adipogenesis, browning, lipid metabolism, and endocrine function only in younger (2-month-old) Lgals3−/− mice.
AT immaturity resulted in decreased adipocyte size and increased percentage of smaller adipocytes, pointing
to a reduced fat storing capacity of each individual cell. However, these changes were associated with increased
adipocyte number and density depending on a shift in the balance between proliferation/clonal expansion and
terminal differentiation in favor of the former, occurring in the absence of galectin-3 during AT development.
Therefore, total fat (VAT and SAT) mass was unchanged, suggesting that the overall AT capacity of accumulating
lipids was unaffected, at least in the absence of an increased demand for fat storage. Consistently, AT immaturity
was not associated with hypertrophy-induced adipocyte damage, increased NEFA release, and, as previously
shown in the liver from Lgals3−/− mice fed a standard diet, fat diversion to ectopic s ites22.
Scientific Reports | (2020) 10:20070 | https://doi.org/10.1038/s41598-020-76952-z 7
Vol.:(0123456789)www.nature.com/scientificreports/
Figure 4. Tissue and systemic insulin sensitivity and glucose homeostasis in 2-month-old WT and Lgals3−/−
mice. Representative Western blot analysis of phospho-AKT (p-AKT, 60 kDa) and total AKT (AKT, 60 kDa) in
protein extracts from WT and Lgals3−/− VAT cultures stimulated with insulin and quantification of phospho-
AKT (active AKT) relative to total AKT (n = 4 per genotype) (a); measurement of glucose uptake in ex vivo
cultures of VAT (b) and skeletal muscle (c) treated with insulin (1 µM) and 2-deoxy-D-glucose (1 mM)
from WT or Lgals3−/− mice (n = 4 per genotype); IPGTT (n = 5 per genotype) (d); fasting insulin levels (e),
and calculation of HOMA-IR index in WT and Lgals3−/− mice (n = 6 per genotype) (f); and euglycaemic-
hyperinsulinemic clamp in WT and Lgals3−/− mice (n = 7 per genotype) (g). Values represent the mean ± SD.
White bars and squares, continuous line = WT mice; black bars and triangles, dashed line = Lgals3−/− mice;
*P < 0.05, **P < 0.01 or ***P < 0.001 versus WT.
Scientific Reports | (2020) 10:20070 | https://doi.org/10.1038/s41598-020-76952-z 8
Vol:.(1234567890)www.nature.com/scientificreports/
SAT VAT BAT
WT Lgals3−/− WT Lgals3−/− WT Lgals3−/−
Adipogenesis
Cebpb 1.31 ± 1.63 0.80 ± 0.58 1.34 ± 1.02 0.78 ± 0.47 0.84 ± 0.22 0.99 ± 0.78
Pparg 0.67 ± 0.50 0.60 ± 0.21 0.75 ± 0.19 0.61 ± 0.20 1.01 ± 0.02 1.16 ± 0.01*
Cebpa 0.80 ± 0.60 0.74 ± 0.31 1.07 ± 0.64 0.93 ± 0.41 1.03 ± 0.04 0.89 ± 0.04*
Lipolysis
Pnpla2 1.12 ± 1.19 0.86 ± 0.58 0.40 ± 0.60 0.31 ± 0.45 1.01 ± 0.01 0.99 ± 0.02
Lipogenesis
Srebf1 0.80 ± 0.55 0.69 ± 0.37 0.87 ± 0.31 0.84 ± 0.23 0.92 ± 0.11 0.70 ± 0.14
Acaca 1.55 ± 2.04 1.39 ± 0.73 0.98 ± 0.53 0.99 ± 0.44 0.79 ± 0.29 0.96 ± 0.44
Fasn 0.65 ± 0.51 0.75 ± 0.38 0.97 ± 0.67 0.84 ± 0.43 0.76 ± 0.34 0.61 ± 0.12
Fabp4 1.11 ± 0.86 1.05 ± 0.40 4.18 ± 3.68 3.16 ± 3.03 0.99 ± 0.01 0.72 ± 0.16
Adipokines
Lep 1.54 ± 2.38 0.58 ± 0.49 1.23 ± 0.76 1.17 ± 0.80 0.67 ± 0.47 1.25 ± 0.78
Adipoq 0.84 ± 0.77 0.66 ± 0.31 0.72 ± 0.19 0.75 ± 0.16 1.02 ± 0.02 1.10 ± 0.08
Cfd 0.79 ± 0.79 0.72 ± 0.39 0.87 ± 0.32 0.83 ± 0.31 1.00 ± 0.005 0.91 ± 0.11
Browning
Cidea 2.91 ± 2.32 1.68 ± 0.75 1.06 ± 1.38 0.13 ± 0.12* 0.92 ± 0.12 0.94 ± 0.07
Ppara 1.26 ± 0.69 0.96 ± 0.35 0.88 ± 0.63 0.46 ± 0.28 0.98 ± 0.03 0.98 ± 0.21
Ucp1 N/A N/A N/A N/A 1.13 ± 0.18 0.70 ± 0.13*
Insulin signaling
Slc2a4 0.89 ± 0.94 0.62 ± 0.35 0.89 ± 0.57 0.64 ± 0.28 0.82 ± 0.25 0.72 ± 0.06
Insr 0.62 ± 0.43 0.56 ± 0.35 0.76 ± 0.37 0.84 ± 0.36 1.09 ± 0.13 0.90 ± 0.09
Irs1 1.00 ± 0.93 0.87 ± 0.51 1.10 ± 0.34 1.07 ± 0.39 1.54 ± 0.76 1.98 ± 0.73
Fibrosis
Fn1 0.45 ± 0.38 0.71 ± 0.33 1.40 ± 0.79 1.86 ± 0.82 1.03 ± 0.04 1.40 ± 0.32
Cola1a1 0.26 ± 0.38 0.19 ± 0.10 1.31 ± 0.78 1.68 ± 0.94 1.11 ± 0.16 1.98 ± 0.11†
Cola4a1 0.62 ± 0.52 0.54 ± 0.25 1.00 ± 0.32 1.23 ± 0.50 0.99 ± 0.01 1.08 ± 0.36
Cola6a1 0.61 ± 2.12 1.46 ± 1.15 1.80 ± 1.71 2.41 ± 2.04 1.18 ± 0.26 1.50 ± 0.49
Table 2. Adipogenesis, lipid metabolism and fibrosis in adipose tissue of 5-month-old mice. Expression of
genes involved in adipogenesis, white and brown/beige lipid metabolism, insulin signaling, and fibrosis in
SAT, VAT and BAT from 5-month-old WT and Lgals3−/− mice. Values represent the mean ± SD (n = 7 per
genotype). P values calculated by t-test between WT and Lgals3−/−: *P < 0.05; †P < 0.01 and ‡P < 0.001 versus the
corresponding WT mice.
Nevertheless, incomplete AT maturation (terminal differentiation) was associated with tissue and systemic
inflammation and IR, ultimately leading to impaired glucose homeostasis. Inflammation was detected both
in pre-adipocytes derived from Lgals3−/− SVF cells and Lgals3−/− mice at the AT and systemic level, consistent
with previous findings that mesenchymal stem cells and human pre-adipocytes are the primary source of pro-
inflammatory cytokines/chemokines23–25, particularly IL-6, the levels of which dramatically decrease during
adipogenic differentiation23,24. Immature adipocytes from the AT may also have contributed to the increased
plasma IL-6 levels of 2-month-old Lgals3−/− mice, as previously demonstrated in leptin-deficient obese (ob/
ob) mice24. In parallel with the defective maturation and increased expression of IL-6, ex vivo glucose uptake
and insulin sensitivity were reduced in AT, whereas they were unaffected in muscle, consistent with previous
observations in Lgals3−/− mice26. These changes at the AT level resulted in an impairment of whole-body insulin
sensitivity and glucose homeostasis, which were associated with increased circulating levels of IL-6, in keeping
with the findings that serum IL-6 levels are elevated in IR and metabolic d isorders27,28 and that chronic exposure
to IL-6 produces muscle IR29. Though whole-body IR as measured by the euglycemic-hyperinsulinemic clamp
technique is mainly accounted for by a reduction in muscle insulin sensitivity, the unchanged NEFA levels despite
twice-higher insulin concentrations provided indirect evidence that the AT of Lgals3−/− mice was insulin resistant
also in vivo, consistent with the ex vivo findings.
In vivo, AT maturation was only delayed, since at 5 months of age the gene expression profile was not different
between Lgals3−/− and coeval wild type mice. In parallel, AT and systemic inflammation and IR were no longer
observed in 5-month-old Lgals3−/− mice, further supporting the relationship of these changes with the impaired
AT maturation observed in younger animals. Conversely, the number of macrophages continued to be elevated
in the VAT of Lgals3−/− mice, a finding possibly related to the lack of the specific regulatory functions of Lgals3
in macrophage homeostasis30,31. In addition, the comparable increase in AT macrophages from Lgals3−/− versus
wild type animals at 2 and 5 months of age further supports the concept that immature adipocytes are the main
source of the increased cytokine levels observed in 2-month-old Lgals3−/− mice. Despite maturation of adipocytes,
Scientific Reports | (2020) 10:20070 | https://doi.org/10.1038/s41598-020-76952-z 9
Vol.:(0123456789)www.nature.com/scientificreports/
Figure 5. AT phenotype and inflammation in 5-month-old WT and Lgals3−/− mice. Quantification of size,
number, density and size distribution of adipocytes from VAT (a); adipocyte size from SAT (b); serum levels
of leptin and adiponectin (c); qRT-PCR analysis of the inflammatory markers Tnfa, Il1b, Il6, and Ccl2 in SAT
and VAT (d); representative immunohistochemical staining for F4/80 (original magnification, 400X; black
arrows = macrophages), measurement of F4/80 positive cell number, and RT-PCR analysis of the macrophage
marker Cd68 in VAT (e) in WT and Lgals3−/− mice. Values represent the mean ± SD (n = 6 per genotype). White
bars = WT mice; black bars = Lgals3−/− mice; *P < 0.05, **P < 0.01 or ***P < 0.001 versus WT.
Scientific Reports | (2020) 10:20070 | https://doi.org/10.1038/s41598-020-76952-z 10
Vol:.(1234567890)www.nature.com/scientificreports/
Figure 6. Tissue and systemic insulin sensitivity and glucose homeostasis in 5-month-old WT and Lgals3−/− mice.
Representative Western blot analysis of phospho-AKT (p-AKT, 60 kDa) and total AKT (AKT, 60 kDa) in protein extracts
from VAT cultures stimulated with insulin and quantification of phospho-AKT (active AKT) relative to total AKT (n = 4
per genotype) (a); measurement of glucose uptake in ex vivo cultures of VAT (b) and skeletal muscle (c) treated with insulin
(1 µM) and 2-deoxy-D-glucose (1 mM) (n = 4 per genotype); fasting glucose levels (n = 4 per genotype) (d); IPGTT (n = 5
per genotype) (e); fasting insulin levels (f); HOMA-%β (g) (n = 6 per genotype); and euglycemic-hyperinsulinemic clamp
(n = 7 per genotype) (h) in WT and Lgals3−/− mice. Values represent the mean ± SD. White bars and squares, continuous
line = WT mice; black bars and triangles, dashed line = Lgals3−/− mice; *P < 0.05, **P < 0.01 or ***P < 0.001 versus WT.
Scientific Reports | (2020) 10:20070 | https://doi.org/10.1038/s41598-020-76952-z 11
Vol.:(0123456789)www.nature.com/scientificreports/
resolution of inflammation, and restoration of insulin sensitivity, older Lgals3−/− mice showed persistently abnor-
mal glucose metabolism associated with reduced insulin levels and HOMA-%B, suggesting that Lgals3 ablation
might impair also β-cell functional reserve during aging.
Overall our data indicate that the concept of adiposopathy should be extended to normal feeding conditions,
under which an AT dysfunction due to a defect of terminal adipogenesis may directly cause inflammation and IR
at the tissue and systemic level, without inducing adipocyte degeneration/death and fat diversion to ectopic sites,
consistent with the unchanged total fat mass. Conversely, in response to a high-fat intake, such an adipogenic
defect may lower the threshold of critical volume beyond which adipocyte injury, fat diversion, and the detri-
mental downstream events occur9. This concept is consistent with the increased susceptibility of Lgals3−/− mice
to IR, inflammation, and diabetes induced by a high-fat d iet18,19.
The results of our study have important clinical implications, as they suggest that a genetic background that
is associated with an impaired ability of pre-adipocytes to terminal differentiate into functional mature cells
without affecting pre-adipocyte recruitment may underlie an increased susceptibility to develop abnormalities
of insulin sensitivity and glucose regulation. Consistently, a growing body of evidence from human and experi-
mental obesity indicates that adiposopathy is mainly characterized by a defect in the hypertrophic response of
newly formed adipocytes rather than by an impaired recruitment and proliferation of adipocyte precursors32–36.
Our results may reconcile the apparently discordant findings of defective adipogenesis, unchanged body
weight, and impaired glucose regulation previously reported in Lgals3−/− mice fed a standard d iet17–19. Never-
theless, there are some differences with previous studies using this mouse model, which however were also in
contrast between each other for several fi ndings17–20.
The main strength of our work is the use of the Lgals3−/− mouse model, which is characterized by both
impaired adipocyte differentiation and altered glucose regulation and is therefore suited to test the study hypoth-
esis. A weakness is the use of total body instead of AT-specific Lgals3−/− mice, which did not allow to rule out
a background effect of whole-body deletion of Lgals3 especially on inflammation, which is modulated by this
lectin13,14, but also on IR and glucose homeostasis. Indeed, as discussed above, the persistence of altered glucose
regulation despite AT maturation in 5-month-old Lgals3−/− mice might suggest that Lgals3 ablation directly affects
the β-cell. However, the strict temporal relationship between AT maturation and function and systemic IR and
inflammation, with all these changes being observed at 2 months and no longer detected at 5 months of age,
strongly support a major role for Lgals3 deficiency at the AT level in the pathogenesis of metabolic derangement.
Other limitations include the lack of mechanistic studies explaining the delayed AT maturation and the pan-
creatic defect observed in Lgals3−/− mice, which require further studies. However, unrevealing the mechanisms
underlying the effect of Lgals3 ablation on AT and other metabolic organs was beyond the scope of our work.
In conclusion, our data indicate that Lgas3 deletion results in impaired terminal differentiation (maturation)
of pre-adipocytes, which might directly affect insulin sensitivity and increase susceptibility to type 2 diabetes in
the absence of an increased demand for fat storage and, hence, independently of increased fat accumulation and
redistribution. This implies that defective adipogenesis is a central mechanism underlying IR and susceptibility
to diabetes, thus providing the conceptual framework for designing and testing new molecules targeting AT
adipogenic capacity.
Methods
Design. The study protocol was approved by the National Ethics Committee for Animal Experimentation of
the Italian Minister of Health (D.lgs. 26/2014, Act n. 184) and included in vitro, in vivo, and ex vivo studies using
5-week-old female Lgals3−/− and the corresponding C57BL/6J WT mice (gift of Daniel K Hsu & Fu-Tong Liu,
Department of Dermatology, University of California-Davis, Sacramento, CA, USA).
In vitro studies. The SVF cells were isolated from SAT of WT and Lgals3−/− mice. Briefly, tissue was washed
with PBS, mechanically disrupted, and enzymatically digested in a buffer containing 1.5 mg/ml collagenase
type II, 0.5% BSA, and 15 mM HEPES (Merck KGaA, Darmstadt, Germany) for 45 min at 37 °C and 150 rpm.
The disassociated tissue was filtered and centrifuged at 700 × g for 10 min to pellet SVF cells, which were then
plated in DMEM/F12 supplemented with 10% FBS and 1% penicillin/streptomycin (Thermo Fisher Scientific,
Waltham, MA, USA).
For Lgals3 knockdown experiments in mature adipocytes, murine 3T3-L1 pre-adipocytes (ATCC, Manassas,
VA, USA) were induced to differentiate into fully mature adipocytes as per vendor’s protocol. At day 7 post-
induction, adipocytes were reverse transfected using Silencer Select siRNA to Lgals3 and irrelevant scrambled
siRNA as control (Thermo Fisher Scientific) at day 7 post-induction using DharmaFECT Duo Transfection
Reagent (Healthcare Dharmacon Inc., Lafayette, CO, USA).
In vivo studies. The animals were housed in single cages in a germ-free stabularium and cared according to the
“Animal Research: Reporting of In Vivo Experiments” (ARRIVE) guidelines (https://www.nc3rs.org.uk/arriv
e-guidelines) and national laws and regulations. Mice received water and food ad libitum. Body weights and
fasting plasma glucose levels were measured monthly, together with food intake.
Part of the mice were subjected to an IPGTT (n = 6 per age and genotype) or a euglycemic-hyperinsulinemic
clamp (n = 7 per age and genotype). The remaining mice (n = 6 per age and genotype) were starved for 4 h, then
blood samples were collected, the animals were euthanized by cervical dislocation, and inguinal SAT, gonadal
VAT, and interscapular BAT were sampled, weighed, and fixed in phosphate buffered 4% formaldehyde solution
and processed for morphometric and immunohistochemical analysis or frozen in liquid nitrogen and stored at
− 80 °C until analysis of gene expression by qRT-PCR.
Scientific Reports | (2020) 10:20070 | https://doi.org/10.1038/s41598-020-76952-z 12
Vol:.(1234567890)www.nature.com/scientificreports/
Ex vivo studies. Samples of VAT and gastrocnemius muscle were obtained from 4 mice per age and genotype,
washed in PBS, and cultured for 2 h in RPMI containing penicillin and streptomycin (Thermo Fisher Scientific).
Then, tissues were stimulated with 1 µM insulin (Merck KGaA) or vehicle for 20 min and processed for the
assessment of glucose uptake or, in case of VAT, frozen and stored at − 80 °C for Western blot analysis.
Measurements. Adipogenic differentiation. The SVF cells were cultured for 14 days in complete DMEM/
F12 medium (Thermo Fisher Scientific) supplemented with 50 μM indomethacine, 0.5 μM hydrocortisone,
0.5 mM isobutylmethylxanthine, and 5 μg/ml insulin (Merck KGaA).
Lipid accumulation was detected using Oil-Red-O staining (O0625, Sigma-Aldrich, St.Louis, MO, USA) with
the aid of the image analysis system Optimas 6.5 (Bioscan, Washington DC, USA).
Cell proliferation was assessed by measuring BrdU incorporation using an Eloisa kit from Cell Biolabs (San
Diego, CA, USA) following the manufacturer’s instructions.
Biochemistry and ELISA. Fasting blood samples were analyzed for glucose by an automated colorimetric
instrument (Glucocard SM, Menarini, Florence, Italy) and insulin by ELISA (Ultrasensitive Mouse Insulin
ELISA kit, Mercodia AB, Uppsala, Sweden); the HOMA-IR and HOMA-%β indexes were then calculated from
glucose and insulin.
Levels of NEFAs were measured with a colorimetric Kit (MAK044, Merck KGaA). Serum levels of TNF-α,
IL-1β, IL-6, leptin, and adiponectin were assessed using ELISA kits from R&D Systems (Minneapolis, MN, USA)
and ENZO Life Sciences (Farmingdale, NY, USA) for leptin.
Histology, morphometry and Immunohistochemistry. Sections of VAT and SAT were stained with hematoxylin–
eosin for histological examination. Adipocyte size in VAT and SAT was evaluated by computer assisted image
analysis (Optimas 6.5) on five serial sections viewed at 100X using a DIALUX 20EB Microscope (Leitz, Wetzlar,
Germany) and a Pro-Series High performance CCD Camera (Immagini e Computer, Milan, Italy). Ten random
m2 per section, automatically selected by means of a step motor, were analyzed. Data were first
fields of 0.78 m
averaged per section and then per animal.
The number of infiltrating macrophages was measured in five AT sections immunolabelled for the murine
macrophage marker F4/80; twenty random, automatically selected 0.125 mm2 fields per section were analyzed.
Perilipin-1 immunostaining was performed to identify dead/dying adipocytes in areas of accumulation of F4/80
positive cells. The antibodies used for F4/80 and perilipin-1 immunohistochemistry are reported in Supplemen-
tary Table 1.
RNA isolation and qRT‑PCR. Total RNA was extracted from SAT and VAT using an RNA purification kit
(QIAGEN, Hilden, Germany) and from BAT and cell cultures using TRIzol Reagent (Thermo Fisher Scientific).
qRT-PCR was carried out in 20 µl reactions using a StepOne RT-PCR instrument (Applied Biosystems,
Monza, Italy)37. The expression of the following genes was assessed using the TaqMan Gene Expression Assays
(Applied Biosystems) reported in Supplementary Table 2: Lgals3; the pre-adipocyte marker and adipogenesis
inhibitor Dlk1; the adipogenic transcription factors Cebpa, Cebpb and Pparg; the lipolytic enzyme Pnpla2; the
lipogenic factors Srebf1, Acaca, Fasn, and Fabp4; the adipokines Lep, Adipoq, and Cfd; the markers of browning
Cidea, Ppara and, in BAT, Ucp1; the cell cycle regulator Ccnd1; the insulin signaling mediators Insulin Recep-
tor (Irs1), Irs1, and Slc2a4; the inflammatory cytokines Tnfa, Il1b, Il6, and Ccl2; the macrophage marker Cd68;
the ER stress markers Hspa5, Ddit3, and Xbp1; and the fibrosis markers Fn1, Cola1a1, Cola4a1, and Cola6a1.
Amplifications were normalized to the β-actin gene (Actb) and quantitation was performed using the ΔΔCT
calculation, where results were expressed as arbitrary units or fold of control mean (WT mouse and untreated
WT cells) to control for unwanted sources of variation.
Euglycemic‑hyperinsulinemic clamp and IPGTT. For euglycemic-hyperinsulinemic clamp38,39, mice under-
went surgery for the positioning of catheters. Three-to-five days later, after a 6-h fast, a primed continuous
(18.0 mU·kg-1·min-1) infusion of human insulin (Actrapid, Novo Nordisk, Copenhagen, Denmark) was started
simultaneously with a variable infusion of 20% dextrose to maintain glucose concentration at 80–100 mg dL-1.
Blood samples were taken at time 0 and at 10-min intervals thereafter for at least 2 h to measure glucose concen-
tration and adjust dextrose infusion rates. Insulin sensitivity (rate of peripheral glucose uptake [mg·kg-1·min-1])
was calculated from average glucose concentrations and dextrose infusion rates during the last 30 min of the
steady-state clamp period.
For IPGTT, after a 6-h fast, blood was drawn to measure glucose levels before and 15, 30, 60, and 120 min
after intraperitoneal injection of 1 g glucose per kg body weight (Merck KGaA).
Glucose uptake. Glucose uptake was assessed in insulin- or vehicle-stimulated VAT and gastrocnemius sam-
ples using the Glucose Uptake Colorimetric Assay Kit (MAK083, Merck KGaA), following the manufacturer’s
instructions.
Western blot analysis. VAT samples stimulated with insulin or vehicle were homogenized in RIPA buffer sup-
plemented with protease and phosphatase inhibitors.
Total and phosphorylated Akt protein levels were assessed by Western blot a nalysis40 using the antibodies
reported in Supplementary Table 1. The protein bands were detected and analyzed by using the ChemiDoc
XRS + System with Image Lab image acquisition and analysis software included (Bio-Rad laboratories, Hercules,
Scientific Reports | (2020) 10:20070 | https://doi.org/10.1038/s41598-020-76952-z 13
Vol.:(0123456789)www.nature.com/scientificreports/
CA, USA). Results were normalized using the Stain-Free technology (Bio-Rad laboratories) and Akt phospho-
rylation was expressed as phosphorylated:total Akt ratio.
Statistical analysis. Results were expressed as means ± SD. Statistical significance was evaluated by Stu-
dent’s t test or the corresponding Mann–Whitney U test, for nonparametric variables.
A P-value < 0.05 was considered significant. All statistical tests were performed on raw data.
Received: 14 November 2019; Accepted: 26 October 2020
References
1. Rosen, E. D. & Spiegelman, B. M. What we talk about when we talk about fat. Cell 156, 20–44 (2014).
2. Lazar, M. A. How obesity causes diabetes: not a tall tale. Science 307, 373–3753 (2005).
3. Badoud, F., Perreault, M., Zulyniak, M. A. & Mutch, D. M. Molecular insights into the role of white adipose tissue in metabolically
unhealthy normal weight and metabolically healthy obese individuals. FASEB J. 29, 748–758 (2015).
4. Neeland, I. J., Poirier, P. & Després, J. P. Cardiovascular and metabolic heterogeneity of obesity: clinical challenges and implications
for management. Circulation 137, 1391–1406 (2018).
5. Bays, H. E. Adiposopathy: Is “sick fat” a cardiovascular disease?. J. Am. Coll. Cardiol. 57, 2461–2473 (2011).
6. Pellegrinelli, V., Carobbio, S. & Vidal-Puig, A. Adipose tissue plasticity: how fat depots respond differently to pathophysiological
cues. Diabetologia 59, 1075–1088 (2016).
7. Tang, Q. Q. & Lane, M. D. Adipogenesis: from stem cell to adipocyte. Annu. Rev. Biochem. 81, 715–736 (2012).
8. Giordano, A. et al. Obese adipocytes show ultrastructural features of stressed cells and die of pyroptosis. J. Lipid. Res. 54, 2423–2436
(2012).
9. Cinti, S. Adipose organ development and remodeling. Compr. Physiol. 8, 1357–1431 (2018).
10. Smith, U. Abdominal obesity: a marker of ectopic fat accumulation. J. Clin. Invest. 125, 1790–1792 (2015).
11. Lim, S. & Meigs, J. B. Ectopic fat and cardiometabolic and vascular risk. Int. J. Cardiol. 169, 166–176 (2013).
12. Menini, S., Iacobini, C., Blasetti Fantauzzi, C., Pesce, C. M. & Pugliese, G. Role of galectin-3 in obesity and impaired glucose
homeostasis. Oxid. Med. Cell. Longev. 2016, 9618092 (2016).
13. Iacobini, C. et al. Role of galectin-3 in diabetic nephropathy. J. Am. Soc. Nephrol. 14, S264–S270 (2003).
14. Pugliese, G., Iacobini, C., Pesce, C. M. & Menini, S. Galectin-3: an emerging all-out player in metabolic disorders and their com-
plications. Glycobiology 25, 136–150 (2015).
15. Rhodes, D. H. et al. Adipose tissue-specific modulation of galectin expression in lean and obese mice: evidence for regulatory
function. Obesity (Silver Spring) 21, 310–319 (2013).
16. Kiwaki, K., Novak, C. M., Hsu, D. K., Liu, F. T. & Levine, J. A. Galectin-3 stimulates preadipocyte proliferation and is up-regulated
in growing adipose tissue. Obesity (Silver Spring) 15, 32–39 (2007).
17. Baek, J. H. et al. Galectin-3 activates PPARγ and supports white adipose tissue formation and high-fat diet-induced obesity.
Endocrinology 156, 147–156 (2015).
18. Pejnovic, N. N. et al. Galectin-3 deficiency accelerates high-fat diet-induced obesity and amplifies inflammation in adipose tissue
and pancreatic islets. Diabetes 62, 1932–1944 (2013).
19. Pang, J. et al. Increased adiposity, dysregulated glucose metabolism and systemic inflammation in Galectin-3 KO mice. PLoS ONE
8, e57915 (2013).
20. Li, P. et al. Hematopoietic-derived galectin-3 causes cellular and systemic insulin resistance. Cell 167, 973–984 (2016).
21. Murano, I. et al. Time course of histomorphological changes in adipose tissue upon acute lipoatrophy. Nutr. Metab. Cardiovasc.
Dis. 23, 723–731 (2013).
22. Iacobini, C. et al. Galectin-3 ablation protects mice from diet-induced NASH: a major scavenging role for galectin-3 in liver. J.
Hepatol. 54, 975–983 (2011).
23. Pricola, K. L., Kuhn, N. Z., Haleem-Smith, H., Song, Y. & Tuan, R. S. Interleukin-6 maintains bone marrow-derived mesenchymal
stem cell stemness by an ERK1/2-dependent mechanism. J. Cell. Biochem. 108, 577–588 (2009).
24. Harkins, J. M. et al. Expression of interleukin-6 is greater in preadipocytes than in adipocytes of 3T3-L1 cells and C57BL/6J and
ob/ob mice. J. Nutr. 134, 2673–2677 (2004).
25. Chung, S., Lapoint, K., Martinez, K., Kennedy, A., Boysen Sandberg, M. & McIntosh, M.K. Preadipocytes mediate lipopolysaccha-
ride-induced inflammation and insulin resistance in primary cultures of newly differentiated human adipocytes. Endocrinology.
147, 5340–5351 (2006).
26. Darrow, A. L. & Shohet, R. Galectin-3 deficiency exacerbates hyperglycemia and the endothelial response to diabetes. Cardiovasc.
Diabetol. 14, 73 (2015).
27. Kim, J. H., Bachmann, R. A. & Chen, J. Interleukin-6 and insulin resistance. Vitam. Horm. 80, 613–633 (2009).
28. Hotamisligil, G. S. Inflammation, metaflammation and immunometabolic disorders. Nature 542, 177–185 (2017).
29. Nieto-Vazquez, I., Fernández-Veledo, S., de Alvaro, C. & Lorenzo, M. Dual Role of interleukin-6 in regulating insulin sensitivity
in murine skeletal muscle. Diabetes 57, 3211–3221 (2008).
30. Sano, H. et al. Critical role of galectin-3 in phagocytosis by macrophages. J. Clin. Invest. 112, 389–397 (2003).
31. Caberoy, N. B., Alvarado, G., Bigcas, J. L. & Li, W. Galectin-3 is a new MerTK-specific eat-me signal. J. Cell. Physiol. 227, 401–407
(2012).
32. McLaughlin, T. et al. Enhanced proportion of small adipose cells in insulin-resistant vs insulin-sensitive obese individuals implicates
impaired adipogenesis. Diabetologia 50, 1707–1715 (2007).
33. McLaughlin, T. et al. Inflammation in subcutaneous adipose tissue: relationship to adipose cell size. Diabetologia 53, 369–377
(2010).
34. McLaughlin, T. et al. Subcutaneous adipose cell size and distribution: relationship to insulin resistance and body fat. Obesity. 22,
673–680 (2014).
35. Pasarica, M. et al. Lower total adipocyte number, but no evidence for small adipocyte depletion in patients with type 2 diabetes.
Diabetes Care 32, 900–902 (2009).
36. Johannsen, D. L. et al. Effect of 8 weeks of overfeeding on ectopic fat deposition and insulin sensitivity: testing the “adipose tissue
expandability” hypothesis. Diabetes Care 37, 2789–2797 (2014).
37. Iacobini, C. et al. FL-926-16, a novel bioavailable carnosinase-resistant carnosine derivative, prevents onset and stops progression
of diabetic nephropathy in db/db mice. Br. J. Pharmacol. 175, 53–66 (2018).
38. Kiechl, S. et al. Blockade of receptor activator of nuclear factor-kB (RANKL) signaling improves hepatic insulin resistance and
prevents development of diabetes mellitus. Nat. Med. 19, 358–363 (2013).
Scientific Reports | (2020) 10:20070 | https://doi.org/10.1038/s41598-020-76952-z 14
Vol:.(1234567890)www.nature.com/scientificreports/
39. Giaccari, A. et al. Relative contribution of glycogenolysis and gluconeogenesis to hepatic glucose production in control and diabetic
rats. A re-examination in the presence of euglycaemia. Diabetologia 41, 307–314 (1988).
40. Menini, S. et al. The advanced glycation endproduct Nε-carboxymethyllysine promotes progression of pancreatic cancer: implica-
tions for diabetes-associated risk and its prevention. J. Pathol. 245, 197–208 (2018).
Acknowledgments
The Authors thank Cinzia Cataldo for technical assistance in in sample collection, coding and histology
processing.
Author contributions
C.B.F., C.I., S.M., and G.P. conceived and designed the study. All authors contributed to data acquisition or
analysis, and interpretation. C.B.F., C.I., S.M., and G.P. drafted the manuscript. M.V., G.S., T.M,. S.C., and A.G.
substantially revised the manuscript. S.M., A.G., and G.P. acquired funding. All authors gave final approval of
the version to be published.
Funding
This study was supported by grants from the Research Foundation of the Italian Diabetes Society (Diabete
Ricerca 2013) and the Sapienza University of Rome (Progetti di Ateneo 2013) (to SM); the Università Cattolica del
Sacro Cuore (Fondi Ateneo Linea D.3.2) and the Italian Ministry of Education, University and Research (PRIN
2015373Z39_006) (to AG); and the Diabetes, Endocrinology and Metabolism (DEM) Foundation (to GP). CBF
is recipient of a postdoctoral fellowship from the Research Foundation of the Italian Diabetes Society (Diabete
Ricerca) – Merck Sharp & Dome”, Rome, Italy; GPS is recipient of a fellowship from Fondazione Roma, Rome,
Italy; TM is recipient of European Foundation for the Study of Diabetes Awards supported by NovoNordisk,
Lilly and Astra Zeneca; and AG is recipient of a European Foundation for the Study of Diabetes award supported
by Astra Zeneca. The sponsors had no role in design and conduct of the study; collection, management, and
interpretation of the data; or preparation, review, and approval of the manuscript.
Competing interests
The authors declare no competing interests.
Additional information
Supplementary information is available for this paper at https://doi.org/10.1038/s41598-020-76952-z.
Correspondence and requests for materials should be addressed to G.P.
Reprints and permissions information is available at www.nature.com/reprints.
Publisher’s note Springer Nature remains neutral with regard to jurisdictional claims in published maps and
institutional affiliations.
Open Access This article is licensed under a Creative Commons Attribution 4.0 International
License, which permits use, sharing, adaptation, distribution and reproduction in any medium or
format, as long as you give appropriate credit to the original author(s) and the source, provide a link to the
Creative Commons licence, and indicate if changes were made. The images or other third party material in this
article are included in the article’s Creative Commons licence, unless indicated otherwise in a credit line to the
material. If material is not included in the article’s Creative Commons licence and your intended use is not
permitted by statutory regulation or exceeds the permitted use, you will need to obtain permission directly from
the copyright holder. To view a copy of this licence, visit http://creativecommons.org/licenses/by/4.0/.
© The Author(s) 2020
Scientific Reports | (2020) 10:20070 | https://doi.org/10.1038/s41598-020-76952-z 15
Vol.:(0123456789)You can also read