Transcriptome analysis of the procession from chronic pancreatitis to pancreatic cancer and metastatic pancreatic cancer - Nature
←
→
Page content transcription
If your browser does not render page correctly, please read the page content below
www.nature.com/scientificreports
OPEN Transcriptome analysis
of the procession from chronic
pancreatitis to pancreatic cancer
and metastatic pancreatic cancer
Jihao Tu1,5, Zhehao Huang2,5, Yin Wang1, Meijing Wang1, Zukun Yin3, Xianglin Mei4*,
Meiying Li1* & Lisha Li1*
Exploring the underlying mechanisms of cancer development is useful for cancer treatment. In
this paper, we analyzed the transcriptome profiles from the human normal pancreas, pancreatitis,
pancreatic cancer and metastatic pancreatic cancer to study the intricate associations among
pancreatic cancer progression. We clustered the transcriptome data, and analyzed the differential
expressed genes. WGCNA was applied to construct co-expression networks and detect important
modules. Importantly we selected the module in a different way. As the pancreatic disease
deteriorates, the number of differentially expressed genes increases. The gene networks of T cells
and interferon are upregulated in stages. In conclusion, the network-based study provides gradually
activated gene networks in the disease progression of pancreatitis, pancreatic cancer, and metastatic
pancreatic cancer. It may contribute to the rational design of anti-cancer drugs.
Abbreviations
DEGs Differentially expressed genes
EMT Epithelial-mesenchymal-transition
GO Gene ontology
IPMA Intraductal papillary-mucinous adenoma
IPMC Intraductal papillary-mucinous carcinoma
IPMN Intraductal papillary-mucinous neoplasm
MDSCs Myeloid-derived suppressor cells
PanIN Pancreatic intraepithelial neoplasia
PDAC Pancreatic ductal adenocarcinoma
SAM Significance analysis of microarrays
TME Tumor microenvironment
Tregs Regulatory T cells
WGCNA Weighted gene co-expression network analysis
Pancreatic cancer, comprising mostly pancreatic ductal adenocarcinoma (PDAC), is an extremely lethal disease.
The disease frequently causes few symptoms before it develops to the advanced stage. Those who do develop
symptoms often have non-specific complaints1,2. Multidetector CT angiography, MRI and Endoscopic ultra-
sound are the recommended initial imaging technique for accurate and timely d iagnosis3–5. CA19-9, a validated
serum biomarker, maintains a sensitivity of 79–81% and specificity of 82–90% for the diagnosis of the PDAC
in symptomatic p atients6. Patients who can undergo surgical resection had 5-year survival rates of 10–25%. For
patients who cannot be surgically removed, effective systemic treatment provides a median overall survival of
18.8 months7. The current standard of care for advanced or metastatic PDAC provides only months of overall
survival benefit8. For patients with PDAC, more effective therapy is urgently needed.
1
The Key Laboratory of Pathobiology, Ministry of Education, College of Basic Medical Sciences, Jilin University,
Changchun, China. 2Department of Neurosurgery, China-Japan Union Hospital of Jilin University, Changchun,
China. 3Department of Otorhinolaryngology‑Head and Neck Surgery, Minda Hospital of Hubei Minzu University,
Enshi, China. 4Department of Pathology, The Second Hospital of Jilin University, Changchun, China. 5These authors
contributed equally: Jihao Tu and Zhehao Huang. *email: meixianglin105@163.com; limeiying@jlu.edu.cn;
lilisha@jlu.edu.cn
Scientific Reports | (2021) 11:3409 | https://doi.org/10.1038/s41598-021-83015-4 1
Vol.:(0123456789)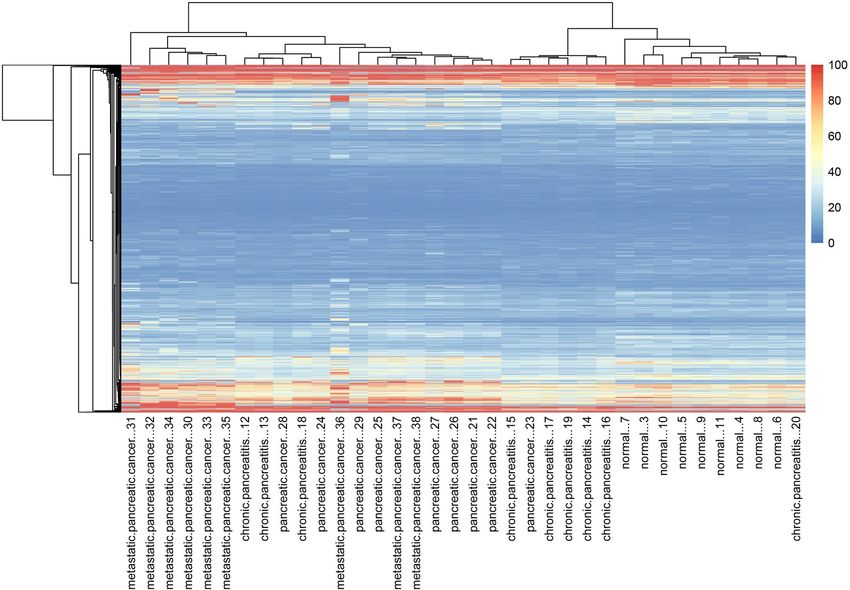
www.nature.com/scientificreports/
The gene networks of pancreatic cancer are very complex, such as KRAS and KRAS downstream effectors9,
Yap-Myc-Sox2-p53 regulatory network10, miR-665/TGFBR1-TGFBR2/SMAD2/3 pathway11, and highly dynamic
tumor microenvironment (TME)12. The non-cancer cell compartment of a tumor including a variety of resident
and infiltrating host cells, secreted factors and extracellular matrix proteins, is collectively known as the TME. In
pancreatic cancer, TME is highly immunosuppressive and fi brotic13 and composed largely of regulatory T-cells
(Tregs), myeloid-derived suppressor cells (MDSCs), and other immunosuppressive c ells8. Most cellular compo-
nents exert their functions through complicated biological networks14. The study of gene networks can give us
an understanding of complex s ystems15,16. Gene co-expression network analysis reveals the typical characteristics
of prognostic genes. Prognostic genes were enriched in m odules17.
A lot of research has analyzed the difference between pancreatic cancer and normal state, but little research
has yet shown the progress of pancreatic disease. Most work makes simple comparisons between the two groups
or picks the module with the highest correlation coefficient with cancer. Here we put the normal, chronic pan-
creatitis, PDAC and metastatic disease groups together in the WGCNA analysis. Moreover, we selected modules
with changing correlation coefficients in the four states. This is a unique aspect of this research. Here we consider
the different stages of pancreatic disease as different traits and assume that these four traits are continuous. Then
calculate the correlation between the module and these traits. If some genes are gradually upregulated among the
normal pancreas, pancreatitis, pancreatic cancer and metastatic pancreatic cancer, they are likely to be classified
in the same module. These specific modules will show a gradually increasing correlation of traits from nega-
tive to positive. Therefore, we constructed pancreatic disease progression networks at the transcriptional level.
Methods
Gene expression data and data analysis. Gene expression profiling data E-EMBL-6 were obtained
from the European Bioinformatics Institute database. We list the detailed information of the samples (www.
ebi.ac.uk/arrayexpress, Table S1). Gene expression profiling data E-EMBL-6 contains the stages of the nor-
mal state, chronic pancreatitis, pancreatic cancer, and metastatic pancreatic cancer, each with nine samples18.
Nine chronic pancreatic tissue samples were obtained from two female and seven male patients (median age
52 years; range 42–62 years). Nine pancreatic cancer tissue samples were obtained from seven male and two
female patients (median age 63 years; range 53–77 years). Nine metastatic pancreatic cancer tissue samples were
obtained from four female and five male patients (median age 58.5 years; range 58–78 years). All individuals had
histologically confirmed pancreatic ductal adenocarcinoma. In addition, normal human tissue samples were
obtained through an organ donor program from nine previously healthy individuals (five male donors, four
female donors; median age 55 years; range 21–73 years). Freshly removed tissue samples were snap-frozen in
liquid nitrogen immediately on surgical removal and maintained at − 80 °C until use. Data annotation is based
on the Unigene Build #172 (www.ncbi.nlm.nih.gov/entrez/query.fcgi?db=UniGene). To analyze the expression
signature, multiple supervised and nonsupervised clustering, as well as statistic methods, were applied by the
open-source Java-based software package Multiexperiment Viewer version 4.9.0 (MeV, https://sourceforge.net/
projects/mev-tm4/files/mev-tm4/). All clustering methods included hierarchical clustering, K-Means cluster-
ing, and Self-organizing maps. Based on these data, significance analysis of microarrays (SAM) was performed
to select the inversely regulated genes. Differentially expressed genes (DEGs) were obtained by fold change. The
|log2FoldChange| > 1 was set as the cutoff criterion.
FunRich site for expression analysis of DEGs. FunRich is stand-alone software used primarily for
functional enrichment and interaction network analysis of genes and proteins. FunRich is designed to handle a
variety of gene/protein data sets irrespective of the organism. Additionally, users have more than 13,320 differ-
ent background database options. DEGs were enriched by biological processes, cellular components, molecular
function, biological pathway and the site of expression analysis of the software, respectively. The top ten items
of DEGs were ranked according to − log10 (P-value). The comparison between total upregulated and down-
regulated DEGs was done based on the percentage of DEGs. The test P-value of less than 0.05 was considered
significant.
Weighted gene co‑expression network analysis. Weighted gene co-expression network analysis
(WGCNA) is a method to calculate correlated gene expression in the form of adjacency matrices (networks)19.
We used WGCNA to analyze a total of 9046 gene expressions from EMBL-6. The modules were detected by
hierarchical clustering. So, genes with similar expression patterns will be classified into the same module. The
first principal components of each module were summarized as the module eigengene. Then the associations
between the modules or rather the module eigengene and the pancreatic pathological process can be estimated.
In the sample phenotypic data, we set a total of four columns, which are normal tissue, chronic pancreatitis, pan-
creatic cancer, and metastatic pancreatic cancer, corresponding to four types of samples. From this, we convert
the sample phenotypic data into a 0–1 matrix. Then, calculate the correlation coefficients between the module
eigengenes and the traits. Among these modules, some showed a negative correlation with normal pancreatic
tissue and a larger and larger correlation with the three kinds of diseased tissue. Such modules are considered
closely related to pathological processes, and so do the genes in the modules. We tested these genes for enrich-
ment in Gene Ontology (GO) biological processes with functions implemented in clusterProfiler R p ackage20.
In WGCNA, the degree to which the expression of one gene change with the expression of another gene is
quantified as connectivity. It constructs a scale-free network so almost all the connectivity will be kept. The dif-
ference between the connectivity can be amplified by power operations. After multiple power operations, the
Scientific Reports | (2021) 11:3409 | https://doi.org/10.1038/s41598-021-83015-4 2
Vol:.(1234567890)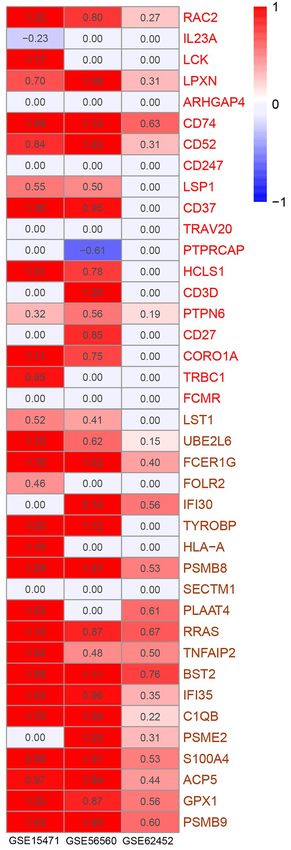
www.nature.com/scientificreports/
Figure 1. The cluster of all the genes in 36 samples including normal state, chronic pancreatitis, pancreatic
cancer, and metastatic pancreatic cancer, each with nine samples.
connectivity with a lower value will approach 0, and the connectivity with a higher value will receive less impact.
WGCNA calculate the connectivity between each gene and the module eigengenes. From each of the concerned
modules, we select twenty genes with the highest weighted-connectivity. Then we analysis them with the infor-
matic tool STRING, a database of known and predicted protein–protein interactions21 and tool COEXPEDIA
which explores biomedical hypotheses via co-expression associated with medical subject h eadings22. The result
is represented by a graph drawn by Cytoscape23. We used GSE15471, GSE62452, GSE56560, GSE42952, TCGA-
PAAD, TCGA-LUAD, The Human Protein Atlas (HPA), and R package hpar24,25 to validate our results.
Ethical approval. This article does not contain any studies with human participants or animals performed
by any of the authors.
Result
Chronic pancreatitis, pancreatic cancer, and metastatic pancreatic cancer have distinct gene
signatures. A total of 9046 gene expressions were obtained, and all the samples were clustered according
to the gene expression value (Fig. 1, Table S2). Chronic pancreatitis and pancreatic cancer could not be distin-
guished very well in the cluster map. Probably pancreatitis shares some common gene expression characteristics
with pancreatic cancer. By significance analysis of microarrays provided by MeV, 302 statistically significant
DEGs were identified (Fig. 2).
There are 965 DEGs in chronic pancreatitis (Table S3), 2060 DEGs in pancreatic cancer (Table S4) and 2517
DEGs in metastatic pancreatic cancer (Table S5) with |log2FoldChange| > 1 set as the cutoff criterion. As pan-
creatic cancer progress, more and more genes are differentially expressed. The number of DEGs was the largest
in metastatic pancreatic cancer. There are 302 DEGs by SAM method (Table S6).
GO term enrichment analysis. Cell growth and maintenance change in all the pancreatic cancer progres-
sion. Immune response changes in pancreatic cancer and metastatic cancer. The GO biological process analysis
of chronic pancreatitis DEGs was enriched in cell growth and maintenance (Fig. 3, Table S3); the pancreatic
cancer DEGs were enriched in immune response, cell growth and maintenance, protein metabolism, etc. (Fig. 3,
Scientific Reports | (2021) 11:3409 | https://doi.org/10.1038/s41598-021-83015-4 3
Vol.:(0123456789)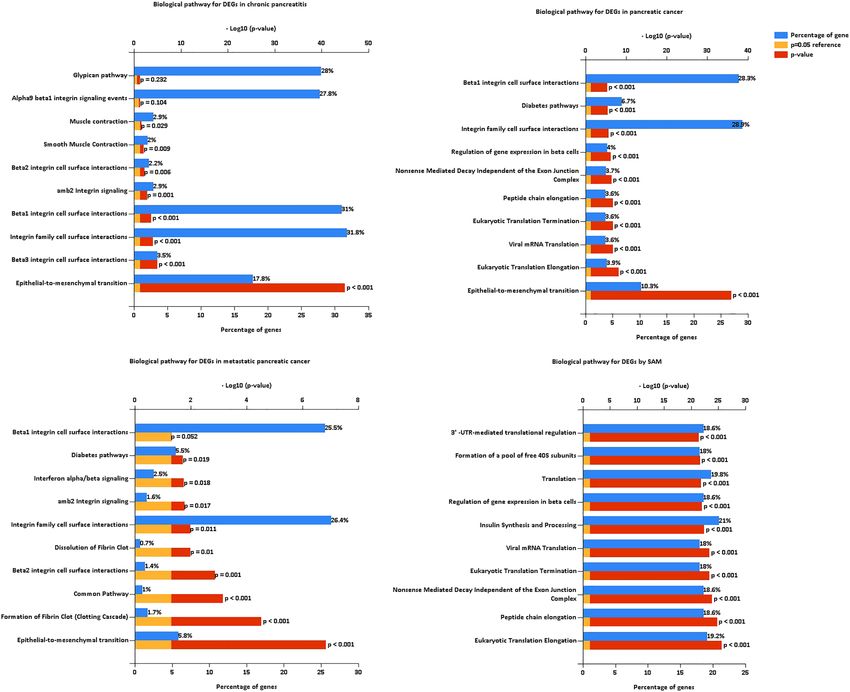
www.nature.com/scientificreports/
Figure 2. The expression graph of significant DEGs by SAM.
Table S4); the metastatic pancreatic cancer DEGs were enriched in immune response, metabolism, energy path-
way, protein metabolism and cell growth and maintenance (Fig. 3, Table S5). The SAM DEGs were enriched in
lymphocyte activation, lymphocyte proliferation, protein metabolism, energy pathway and metabolism (Fig. 3,
Table S6). The GO cellular component analysis of DEGs in all the pancreatic cancer progression was significantly
enriched in extracellular matrix/region/space, exosomes, and plasma membrane (Fig. 4, Tables S3, S4, and S5).
The SAM DEGs were enriched in ribosome, cytosol, etc. (Fig. 4, Table S6). The GO molecular function analysis
of DEGs in all the pancreatic cancer progression was significantly enriched in extracellular matrix structural
constituent, MHC class I receptor activity, and MHC class II receptor activity (Fig. 5, Tables S3, S4, and S5). The
SAM DEGs were enriched in the structural constituent of ribosome and lipase activity (Fig. 5, Table S6).
Site of expression analysis. The site of expression of DEGs in all the pancreatic cancer progression was
significantly enriched in fluid and urine (Fig. 6, Tables S3, S4, and S5). The site of expression was further ana-
lyzed in Fig. 6. We obtained the gene rankings based on the percentage of DEGs after FunRich software analysis
and exported the top ten items. The output pictures were automatically ranked according to − log10 (P-value).
Immune cells emerged in a multitude only in metastatic pancreatic cancer. The SAM DEGs were enriched in
many immune cells, including CD4 T cells, CD8 T cells, monocyte, dendritic cells, B cell, etc. (Fig. 6, Table S6).
Biological pathway analysis. The biological pathways of DEGs in all the stages of pancreatic cancer pro-
gression were significantly enriched in epithelial-to-mesenchymal transition and integrin family cell surface
interaction (Fig. 7, Tables S3, S4, and S5). The DEGs of chronic pancreatitis were enriched in integrin family
cell surface interaction (beta1, beta2, beta3) (Fig. 7, Table S3). The DEGs of pancreatic cancer were enriched in
translational elongation and termination to support new protein synthesis (Fig. 7, Table S4). The SAM DEGs
were enriched in all the levels of gene expression regulation, including mRNA, protein, etc. (Fig. 7, Table S6).
Weighted gene co‑expression network analysis. After network construction, 19 gene co-expression
modules were identified. The number of genes in the modules varies between 47 and 1233 (N = 9,046, 758 genes
were “gray” genes, not assigned to a module) (Table S7). We selected the best soft-thresholding β = 6 to ensure
a scale-free network. Other details of the WGCNA analysis were reported in the supplement (Supplementary
Figs. S1, S2, S3 and S4).
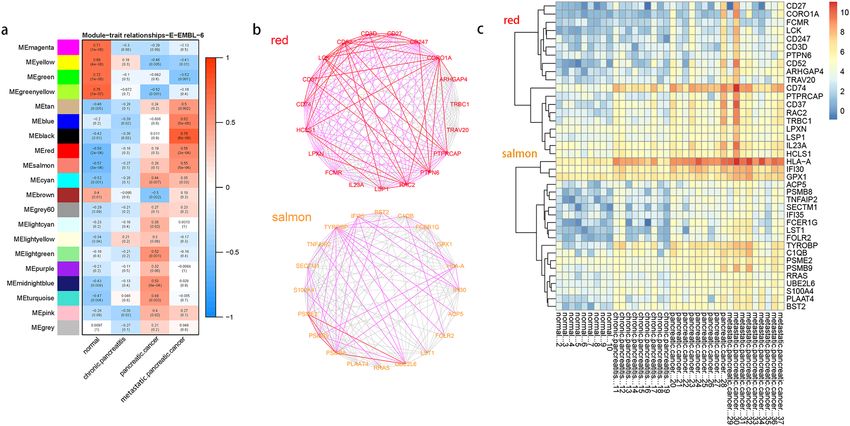
We selected modules significant for association with the pancreatic pathological process and performed
further analysis (Fig. 8). In the module-trait relationship obtained, several modules got raising correlation coef-
ficients from the normal state to metastatic pancreatic cancer (Fig. 8a). The correlation coefficients of these
modules vary from negative to positive. They are red, salmon, tan, and black modules. GO biological process
analysis shows genes in the red module most enriched in T-cell activation, in lipopolysaccharide and interferon
in the salmon module, in protein process and gene silencing in the black module, in vesicle and synaptic process
in the tan module (Table S8). We took red, salmon, tan, and black modules to further analysis, and it is worth
noticing that genes of the red module have been enriched in immune response, similar to the previous GO bio-
logical processes analysis of the DEGs of chronic pancreatitis, pancreatic cancer, and metastatic pancreatic cancer.
The top20 genes in salmon and red modules significantly overlap with DEGs. The correlation between each
gene in a module and the module eigengene defined the eigengene-based connectivity. Since genes with high
eigengene-based connectivity can be inferred as playing important roles in this module, we select respectively the
Scientific Reports | (2021) 11:3409 | https://doi.org/10.1038/s41598-021-83015-4 4
Vol:.(1234567890)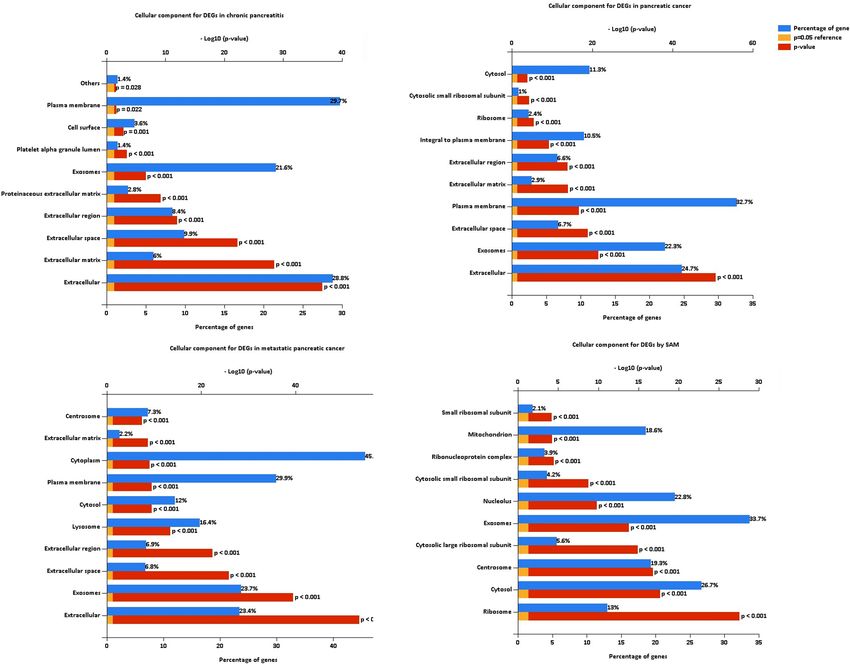
www.nature.com/scientificreports/

                                  Figure 3.  GO biological process for DEGs of chronic pancreatitis, pancreatic cancer, metastatic pancreatic
                                  cancer, and SAM, respectively.

                                  top20 genes in four concerned modules to further analysis. We screened the genes from the previous differential
                                  analysis. We found that 546 genes were differentially expressed in all three groups: normal-pancreatitis, normal-
                                  pancreatic cancer, and normal-metastatic pancreatic cancer. We found that 19 out of 80 genes in four modules
                                  overlapped with these 546 genes. There are IFI30, FCER1G, FOLR2, HLA-A, PSMB8, BST2, TNFAIP2, TYROBP,
                                  LST1 in the salmon module, CD52, HCLS1, LCK, RAC2, CD27, CD37, CD74 in the red module, HSPA1A, and
                                  CLDN5 in the tan module, and FSCN1 in the black module. The heatmap of the expression of these genes shows
                                  that their expression does indeed gradually increase in the course of the disease (Fig. 8c).
                                      Most of the top20 genes in the red module showed strong co-expression characteristics, and in the salmon
                                  module, PSMB8, PSMB9, PSME2, UBE2L6 do the same. In STRING, the top20 genes in the salmon, red, black,
                                  and tan modules respectively get a PPI enrichment P-value of 1.0e − 16, 1.0e − 16, 2.3e − 05, and 0.0494. Since
                                  the top20 genes in salmon and red modules showed more correlation than the other two, we verified their co-
                                  expression characteristics in STRING and coexpedia (Fig. 8b). The verification result is represented by a graph
                                  drawn by Cytoscape.
                                      We checked the consistency of the analysis results in other data sets. Other data sets proved that the genes
                                  in red and salmon modules are upregulated in the pancreatic disease course. We test the top20 genes in the four
                                  modules in TCGA. In project TCGA-PAAD, six genes showed survival correlation (Fig. 9a–f). They are PPP1CA
                                  and GAPDH in the black module, ATP6V0E2, RRAS, UBE2L6, and CA11 in the salmon module. We also tested
                                  our results on data sets containing normal and cancer groups. When adjust P-value of less than 0.05 was con-
                                  sidered significant, a total of 40 genes of the red and salmon module showed 29, 20, 27 upregulation, and 1, 0, 1
                                  downregulation in GSE15471, GSE62452, GSE56560, respectively (Fig. 10). It is showed as logFC. Some genes

Scientific Reports |   (2021) 11:3409 |               https://doi.org/10.1038/s41598-021-83015-4                                                 5

                                                                                                                                            Vol.:(0123456789)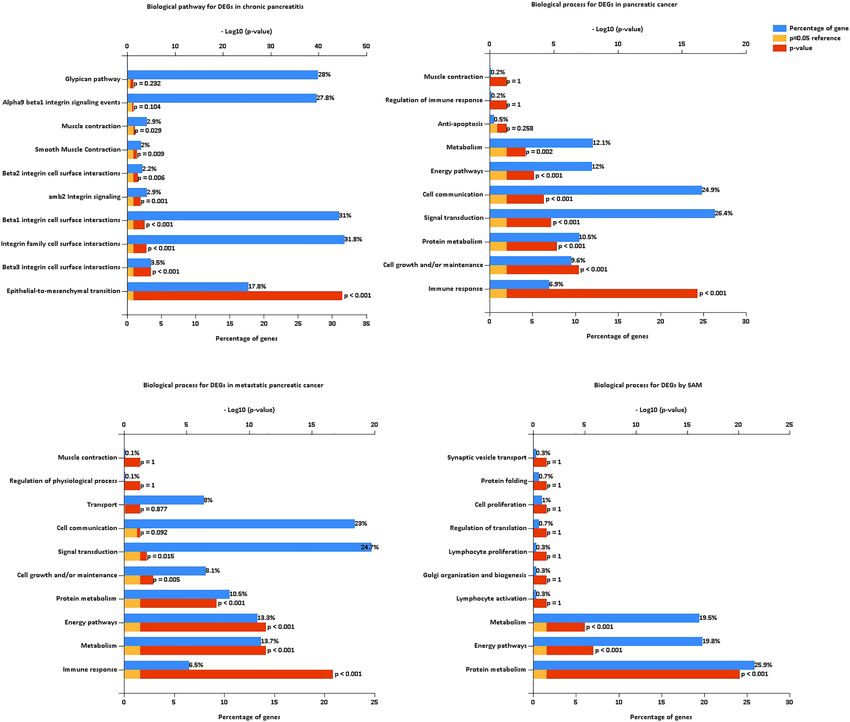
www.nature.com/scientificreports/
Figure 4. GO cell component for DEGs of chronic pancreatitis, pancreatic cancer, metastatic pancreatic cancer,
and SAM, respectively.
were not defined as differential expression genes in these data sets. Their regulation is valued as 0. Most of the
top20 genes in the salmon module showed upregulated in all three external data sets. In the red module, RAC2,
LPXN, CD74, CD52, PTPN6, these five genes showed upregulated in all three external data set. In the control of
pancreatic cancer and metastatic pancreatic cancer, we did not find a significant difference. We analyzed several
data sets GSE42952, TCGA-PAAD, TCGA-LUAD by gene expression differential analysis, and none of them
showed upregulation of the gene network. In fact, there were almost no DEGs between cancer and metastatic
cancer. We validated these genes at the protein level by HPA database and R package hpar. Expression of these
genes in normal tissues is generally lower than that in cancer tissues (Tables S9, 10).
Discussion
The data set was derived from the entire tissue rather than individual cancer cells. The gene expression of can-
cer cells and their surrounding environment are included. TME plays an important role in tumor growth and
inhibition. Here we find that the gene networks of T cells and interferon are upregulated in stages in the process
of pancreatic disease. This is reflected in the red and salmon modules (Fig. 8a, Table S8). And we identified the
hub genes of the two gene networks.
The gene network of T cells is upregulated (Fig. 8b). PDAC development is intertwined with multiple types of
immunosuppressive cells, including Tregs and MDSCs8. Also, PDAC development intertwined with biochemical
and physical barriers to T cell infiltration from the surrounding stroma. T cells can have divergent effects on
PDAC either by combating cancer growth or by promoting tumor progression via the active induction of immune
suppression26. In response to this, the red modules identified by WGCNA showed a high correlation with T cells
(Table S8). The same goes for the top20 genes in the red module (Fig. 8b). Among these top20 genes CD74, CD27,
LCK, CD3D, and CORO1A were proved T cell relatively. CD74 is known as a type II transmembrane glycoprotein
that is associated with the major histocompatibility complex class II alpha and beta chains. It is discovered to
mediate immune e scape27. The overexpression of CD74 is a key factor associated with perineural i nvasion28–30.
Scientific Reports | (2021) 11:3409 | https://doi.org/10.1038/s41598-021-83015-4 6
Vol:.(1234567890)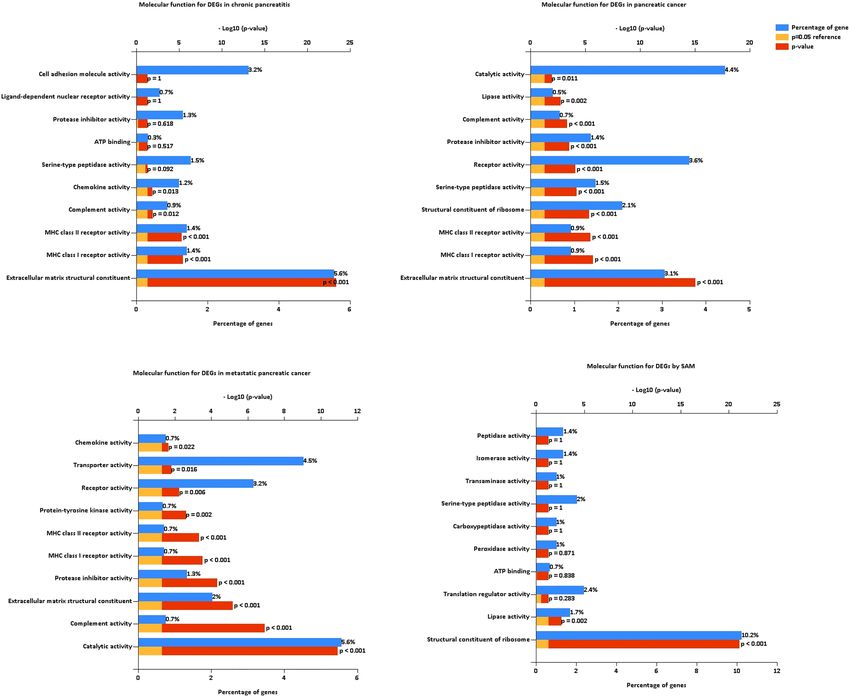
www.nature.com/scientificreports/
Figure 5. GO molecule function for DEGs of chronic pancreatitis, pancreatic cancer, metastatic pancreatic
cancer, and SAM, respectively.
Also, CD74 showed significantly increased expression in a large group of clinical pancreatic adenocarcinomas
but were negative in all normal pancreas samples27. In glioblastoma, migration inhibitory factor (MIF)-CD74
interaction inhibitor reduced MDSC function and enhanced CD8 T cell activity in the syngeneic mouse model
of glioma31. Recently antigen-delivery through CD74 was verified as boosting CD8 and CD4 T cell immunity32.
Activation of the CD27/CD70 axis might have immune suppressive effects. CD27 enhanced survival signal in
Tregs and induction of apoptosis of effector T c ells33. And other genes are thought to be closely related to pancre-
atic cancer, such as LCK34. LCK is critical for T cell development and activation, as it is the first kinase to divert
TCR signalling35. What’s more, LCK, CD247, CD27, CD3D, and CD74 were mentioned as upregulated genes in
anti-PDL1 treated mice and downregulated genes in inflammatory breast cancer with PDL1 overexpression36,37.
RAC is often referred to as the Ras proto-oncogene superfamily38. Rac1 and Rac2 control the formation of den-
drites in mature dendritic cells. Rac1 and Rac2 control dendritic cells polarized short-range migration toward
riming39. Coronin-1A (CORO1A) is a regulator of actin dynamics important for T cell
T cells, and T cell p
homeostasis40. CORO1A expression in T cells is essential for the activation of autoantigen-specific T c ells41.
The gene network of the interferon pathway is upregulated (Fig. 8b). Activation of the stimulator of interferon
within the tumor microenvironment has been shown to generate an antitumor response. The salmon modules
identified by WGCNA relative to type I interferon (Table S8). PSMB8 and PSMB9 can be the alternative subunits
to help the constructive proteasome transform to the immune proteasome induced by interferon γ42. PSMB8,
PSMB9 were identified as potential targets for the diagnosis and therapy of cutaneous squamous-cell carcinoma
and melanoma42,43.
The regulation of T cells was also detected in pancreatic intraepithelial neoplasia (PanIN), and T cells can
promote tumor development through immunosuppression and epithelial-mesenchymal-transition (EMT). In
this study, we focused on the progression of pancreatic cancer induced by chronic pancreatitis. There are other
Scientific Reports | (2021) 11:3409 | https://doi.org/10.1038/s41598-021-83015-4 7
Vol.:(0123456789)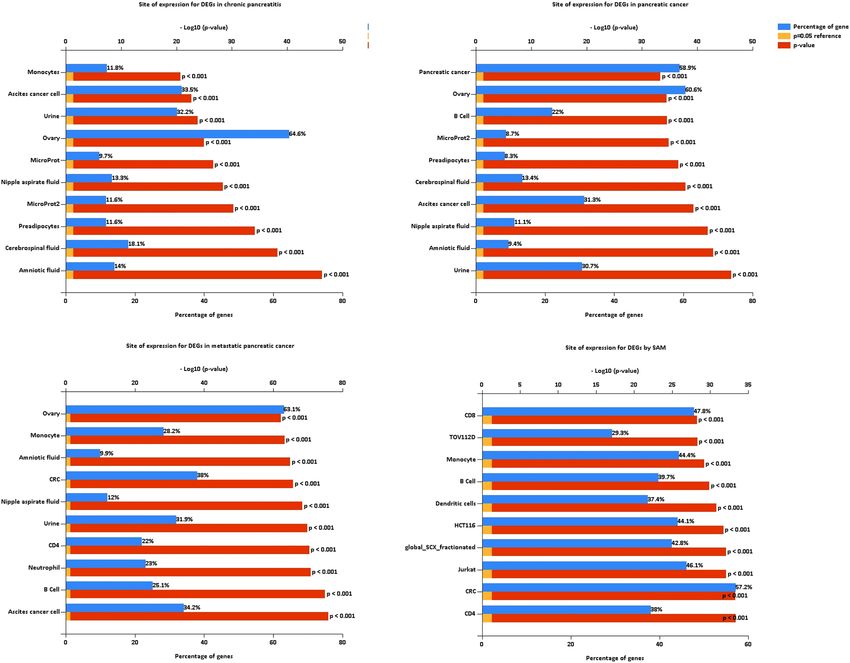
www.nature.com/scientificreports/
Figure 6. FunRich site of expression analysis for DEGs of chronic pancreatitis, pancreatic cancer, metastatic
pancreatic cancer, and SAM, respectively.
diseases that may develop into pancreatic cancer. PanIN is considered a precancerous lesion of pancreatic can-
cer. PanIN formation is accompanied by a variety of changes to the immune milieu of the pancreas, includ-
ing an influx of tumor-associated macrophages, MDSCs, and CD4+ Tregs. These changes persist and intensify
upon progression to m alignancy44,45. Chronic pancreatitis promotes induction of EMT in premalignant cells of
PanIN leading to their dissemination before the detection of a primary PDAC in endogenous mouse m odel46.
+ −
CD4 CD25 T-effector cells and Tregs also contribute to the EMT and invasive phenotype. Elevated levels of
TNF-α and IL-6 secreted by T-effector cells account for t hat47. PanIN is an important part of the malignant
transformation of pancreatic diseases. In this work, PanIN should be compared with normal state, pancrea-
titis, pancreatic cancer and metastatic cancer. However, there is no suitable data set for the time being. Data
set GSE19650 collects the mRNA expression of the epithelial cells from normal pancreatic ducts, intraductal
papillary-mucinous adenoma (IPMA), intraductal papillary-mucinous carcinoma (IPMC), and invasion cancer
originating in intraductal papillary-mucinous neoplasm (IPMN). The gene network of T cell regulation men-
tioned above did not show significant differential expression among IPMA, IPMC and IPMN in GSE19650. We
believe that different sample sources have led to this result. Because at least the upregulation of the network of
T cell regulation in pancreatic cancer tissues is proved in more other data sets and databases. This difference
suggested that the regulation of the network of T cell regulation mainly occurs in the TME and has little to do
with tumor cells.
We performed WGCNA and other analyses using relatively conventional methods. But we chose the module
from a unique perspective. We chose those modules with continuous changes in correlation coefficients, instead
of the modules with the highest correlation. This is a unique part of our research. In fact, if the four consecutive
Scientific Reports | (2021) 11:3409 | https://doi.org/10.1038/s41598-021-83015-4 8
Vol:.(1234567890)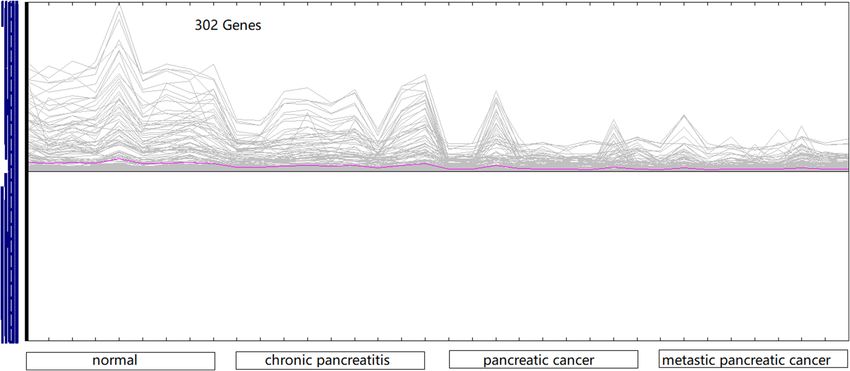
www.nature.com/scientificreports/
Figure 7. Biological pathway analysis for DEGs of chronic pancreatitis, pancreatic cancer, metastatic pancreatic
cancer, and SAM, respectively.
traits of normal, pancreatitis, pancreatic cancer, and metastatic pancreatic cancer are represented by 0, 1, 2, and
3. It is used to represent the gradual high expression of the gene network in the course of the disease. Then the
red and salmon modules also have a high correlation with the disease process (Supplementary Fig. S5).
The WGCNA analysis in other studies showed different results. The hub genes of some studies are mostly
classified as blue modules48. Some are primarily classified in blue modules49 or turquoise module18,50. And some
are scattered in different modules with no obvious slant51. This may be due to the differences in samples and
analysis focus.
We conducted external verification of our proposed gene network, including RNA level and protein level.
In normal and pancreatic cancer controls, the upregulation of our gene network was confirmed. In the control
of pancreatic cancer and metastatic pancreatic cancer, we did not find a significant difference. It is possible that
when pancreatic cancer transforms into metastatic cancer, it cannot be detected by gene expression differential
analysis. The uploaders of the data sets did not provide enough detailed information about the sampling location,
so it may also be caused by different sampling locations.
In summary, we studied the transcriptome analysis of pancreatic disease and as a subset of analyses, normal
to chronic pancreatitis to PDAC to metastatic disease. The relationship in the immune response and transcrip-
tion profiles among two different types of pancreatic disease and more specifically in a minor component of
pancreatic cancer progression was identified. The network analysis helps to find key genes in pancreatic disease,
but we still need experimentally evaluate the function of these genes.
Scientific Reports | (2021) 11:3409 | https://doi.org/10.1038/s41598-021-83015-4 9
Vol.:(0123456789)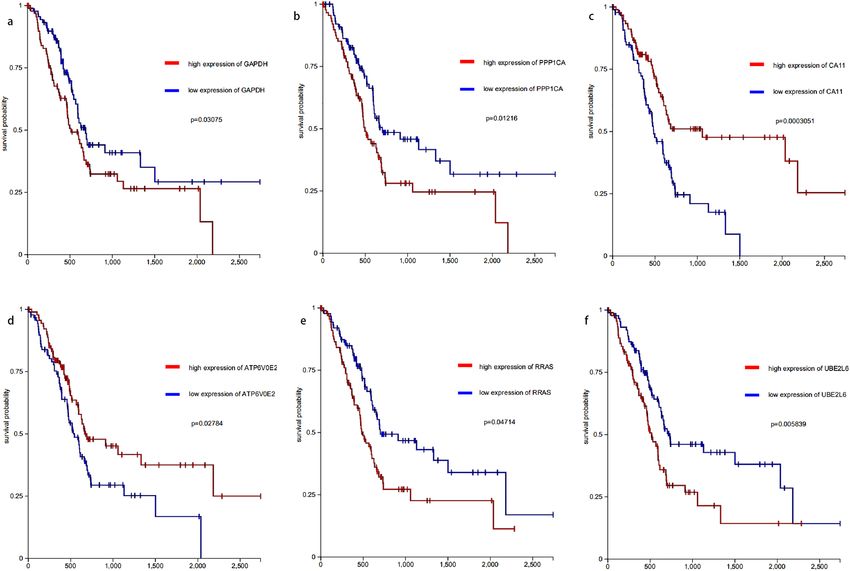
www.nature.com/scientificreports/

                                            Figure 8.  Potential pancreatic disease-related genes selected by WGCNA and further analysis. (a) Modules
                                            correlated with normal and diseased pancreatic tissue. (b) The verification of co-expression of the top20 genes in
                                            red and salmon modules in STRING and coexpedia. The verification result is represented by a graph drawn by
                                            Cytoscape. The dark lines show the co-expression in this research. The pink lines show the co-expression verified by
                                            STRING or coexpedia at the same time. The red line shows the co-expression verified by STRING and coexpedia. (c)
                                            The heatmap of top20 genes in red and salmon module. The expression has been converted by log2 (x + 1).

                                            Figure 9.  The survival correlation of predicted genes. (a) GAPDH; (b) PPP1CA; (c) CA11; (d) ATP6V0E2; (e)
                                            RRAS; (f) UBE2L6.

          Scientific Reports |   (2021) 11:3409 |                https://doi.org/10.1038/s41598-021-83015-4                                                  10

Vol:.(1234567890)
www.nature.com/scientificreports/
Figure 10. Up-regulation or down-regulation of genes in the data set GSE15471, GSE62452, GSE56560.
Upregulated was marked as red ones. Downregulated was marked as blue ones. The white ones with number
0.00 indicate that the gene is not defined as a differentially expressed gene.
Received: 7 June 2020; Accepted: 28 January 2021
References
1. Macdonald, S., Macleod, U., Campbell, N. C., Weller, D. & Mitchell, E. Systematic review of factors influencing patient and prac-
titioner delay in diagnosis of upper gastrointestinal cancer. Br. J. Cancer 94, 1272–1280 (2006).
2. Walter, F. M. et al. Symptoms and patient factors associated with diagnostic intervals for pancreatic cancer (SYMPTOM pancreatic
study): A prospective cohort study. Lancet Gastroenterol. Hepatol. 1, 298–306 (2016).
Scientific Reports | (2021) 11:3409 | https://doi.org/10.1038/s41598-021-83015-4 11
Vol.:(0123456789)www.nature.com/scientificreports/
3. Al-Hawary, M. M. et al. Pancreatic ductal adenocarcinoma radiology reporting template: consensus statement of the Society of
Abdominal Radiology and the American Pancreatic Association. Radiology 270, 248–260 (2014).
4. Vachiranubhap, B., Kim, Y. H., Balci, N. C. & Semelka, R. C. Magnetic resonance imaging of adenocarcinoma of the pancreas. Top.
Magn. Reson. Imaging 20, 3–9 (2009).
5. Puli, S. R., Singh, S., Hagedorn, C. H., Reddy, J. & Olyaee, M. Diagnostic accuracy of EUS for vascular invasion in pancreatic and
periampullary cancers: a meta-analysis and systematic review. Gastrointest. Endosc. 65, 788–797 (2007).
6. Ballehaninna, U. K. & Chamberlain, R. S. The clinical utility of serum CA 19-9 in the diagnosis, prognosis and management of
pancreatic adenocarcinoma: An evidence based appraisal. J. Gastrointest. Oncol. 3, 105 (2012).
7. Mizrahi, J. D., Surana, R., Valle, J. W. & Shroff, R. T. Pancreatic cancer. Lancet 395, 2008–2020. https://doi.org/10.1016/S0140
-6736(20)30974-0 (2020).
8. Ho, W. J., Jaffee, E. M. & Zheng, L. The tumour microenvironment in pancreatic cancer—Clinical challenges and opportunities.
Nat. Rev. Clin. Oncol. 17, 527–540. https://doi.org/10.1038/s41571-020-0363-5 (2020).
9. Eibl, G. & Rozengurt, E. KRAS, YAP, and obesity in pancreatic cancer: A signaling network with multiple loops. Semin. Cancer
Biol. 54, 50–62. https://doi.org/10.1016/j.semcancer.2017.10.007 (2019).
10. Murakami, S. et al. A Yap-Myc-Sox2-p53 regulatory network dictates metabolic homeostasis and differentiation in Kras-driven
pancreatic ductal adenocarcinomas. Dev. Cell 51, 113-128.e119. https://doi.org/10.1016/j.devcel.2019.07.022 (2019).
11. Zhou, B., Guo, W., Sun, C., Zhang, B. & Zheng, F. Linc00462 promotes pancreatic cancer invasiveness through the miR-665/
TGFBR1-TGFBR2/SMAD2/3 pathway. Cell Death Dis. 9, 706–706. https://doi.org/10.1038/s41419-018-0724-5 (2018).
12. Neesse, A. et al. Stromal biology and therapy in pancreatic cancer: Ready for clinical translation?. Gut 68, 159–171. https://doi.
org/10.1136/gutjnl-2018-316451 (2019).
13. Feig, C. et al. The pancreas cancer microenvironment. Clin. Cancer Res. Off. J. Am. Assoc. Cancer Res. 18, 4266–4276. https://doi.
org/10.1158/1078-0432.ccr-11-3114 (2012).
14. Hyduke, D. R. & Palsson, B. O. Towards genome-scale signalling-network reconstructions. Nat. Rev. Genet. 11, 297–307. https://
doi.org/10.1038/nrg2750 (2010).
15. Barabási, A.-L., Gulbahce, N. & Loscalzo, J. Network medicine: A network-based approach to human disease. Nat. Rev. Genet. 12,
56–68. https://doi.org/10.1038/nrg2918 (2011).
16. Hu, J. X., Thomas, C. E. & Brunak, S. Network biology concepts in complex disease comorbidities. Nat. Rev. Genet. 17, 615–629.
https://doi.org/10.1038/nrg.2016.87 (2016).
17. Yang, Y. et al. Gene co-expression network analysis reveals common system-level properties of prognostic genes across cancer
types. Nat. Commun. 5, 3231. https://doi.org/10.1038/ncomms4231 (2014).
18. Abdollahi, A. et al. Transcriptional network governing the angiogenic switch in human pancreatic cancer. Proc. Natl. Acad. Sci.
USA 104, 12890–12895. https://doi.org/10.1073/pnas.0705505104 (2007).
19. Langfelder, P. & Horvath, S. WGCNA: An R package for weighted correlation network analysis. BMC Bioinform. 9, 559. https://
doi.org/10.1186/1471-2105-9-559 (2008).
20. Yu, G., Wang, L. G., Han, Y. & He, Q. Y. clusterProfiler: An R package for comparing biological themes among gene clusters. OMICS
16, 284–287. https://doi.org/10.1089/omi.2011.0118 (2012).
21. Kustatscher, G. et al. Co-regulation map of the human proteome enables identification of protein functions. Nat. Biotechnol. 37,
1361–1371. https://doi.org/10.1038/s41587-019-0298-5 (2019).
22. Yang, S. et al. COEXPEDIA: Exploring biomedical hypotheses via co-expressions associated with medical subject headings (MeSH).
Nucleic Acids Res. 45, D389-d396. https://doi.org/10.1093/nar/gkw868 (2017).
23. Shannon, P. et al. Cytoscape: A software environment for integrated models of biomolecular interaction networks. Genome Res.
13, 2498–2504. https://doi.org/10.1101/gr.1239303 (2003).
24. Gatto, L. & Martin, M. hpar: Human Protein Atlas in R. https://doi.org/10.18129/B9.bioc.hpar (2020).
25. Uhlen, M. et al. A pathology atlas of the human cancer transcriptome. Science (New York, N.Y.) https://doi.org/10.1126/scien
ce.aan2507 (2017).
26. Leinwand, J. & Miller, G. Regulation and modulation of antitumor immunity in pancreatic cancer. Nat. Immunol. https://doi.
org/10.1038/s41590-020-0761-y (2020).
27. Zhu, J., Nie, S., Wu, J. & Lubman, D. M. Target proteomic profiling of frozen pancreatic CD24+ adenocarcinoma tissues by immuno-
laser capture microdissection and nano-LC-MS/MS. J. Proteome Res. 12, 2791–2804. https://doi.org/10.1021/pr400139c (2013).
28. Zhang, J. F. et al. Effect of CD74 on the prognosis of patients with resectable pancreatic cancer. Hepatobiliary Pancr. Diseases Int.
HBPD INT 13, 81–86. https://doi.org/10.1016/s1499-3872(14)60011-4 (2014).
29. Nagata, S. et al. CD74 is a novel prognostic factor for patients with pancreatic cancer receiving multimodal therapy. Ann. Surg.
Oncol. 16, 2531–2538. https://doi.org/10.1245/s10434-009-0532-3 (2009).
30. Koide, N. et al. Establishment of perineural invasion models and analysis of gene expression revealed an invariant chain (CD74)
as a possible molecule involved in perineural invasion in pancreatic cancer. Clin. Cancer Res. Off. J. Am. Assoc. Cancer Res. 12,
2419–2426. https://doi.org/10.1158/1078-0432.ccr-05-1852 (2006).
31. Alban, T. J. et al. Glioblastoma myeloid-derived suppressor cell subsets express differential macrophage migration inhibitory fac-
tor receptor profiles that can be targeted to reduce immune suppression. Front. Immunol. 11, 1191–1191. https://doi.org/10.3389/
fimmu.2020.01191 (2020).
32. Mensali, N. et al. Antigen-delivery through invariant chain (CD74) boosts CD8 and CD4 T cell immunity. Oncoimmunology 8,
1558663–1558663. https://doi.org/10.1080/2162402X.2018.1558663 (2019).
33. Starzer, A. M. & Berghoff, A. S. New emerging targets in cancer immunotherapy: CD27 (TNFRSF7). ESMO Open 4, e000629. https
://doi.org/10.1136/esmoopen-2019-000629 (2020).
34. Capurso, G. et al. Gene expression profiles of progressive pancreatic endocrine tumours and their liver metastases reveal potential
novel markers and therapeutic targets. Endocr. Relat. Cancer 13, 541–558. https://doi.org/10.1677/erc.1.01153 (2006).
35. Wei, Q. et al. Lck bound to coreceptor is less active than free Lck. Proc. Natl. Acad. Sci. USA 117, 15809–15817. https://doi.
org/10.1073/pnas.1913334117 (2020).
36. Bertucci, F. et al. PDL1 expression in inflammatory breast cancer is frequent and predicts for the pathological response to chemo-
therapy. Oncotarget 6, 13506–13519. https://doi.org/10.18632/oncotarget.3642 (2015).
37. Mony, J. T. et al. Anti-PD-L1 prolongs survival and triggers T cell but not humoral anti-tumor immune responses in a human
MUC1-expressing preclinical ovarian cancer model. Cancer Immunol. Immunother. 64, 1095–1108. https://doi.org/10.1007/s0026
2-015-1712-6 (2015).
38. Stelzer, G. et al. The GeneCards suite: From gene data mining to disease genome sequence analyses. Curr. Protocols Bioinform. 54,
1.30.31–31.30.33. https://doi.org/10.1002/cpbi.5 (2016).
39. Benvenuti, F. et al. Requirement of Rac1 and Rac2 expression by mature dendritic cells for T cell priming. Science (New York, N.Y.)
305, 1150–1153. https://doi.org/10.1126/science.1099159 (2004).
40. Yee, C. S. et al. Recurrent viral infections associated with a homozygous CORO1A mutation that disrupts oligomerization and
cytoskeletal association. J. Allergy Clin. Immunol. 137, 879-888.e872. https://doi.org/10.1016/j.jaci.2015.08.020 (2016).
41. Siegmund, K., Klepsch, V., Hermann-Kleiter, N. & Baier, G. Proof of principle for a T lymphocyte intrinsic function of coronin
1A. J. Biol. Chem. 291, 22086–22092. https://doi.org/10.1074/jbc.M116.748012 (2016).
Scientific Reports | (2021) 11:3409 | https://doi.org/10.1038/s41598-021-83015-4 12
Vol:.(1234567890)www.nature.com/scientificreports/
42. Kalaora, S. et al. Immunoproteasome expression is associated with better prognosis and response to checkpoint therapies in
melanoma. Nat. Commun. 11, 896. https://doi.org/10.1038/s41467-020-14639-9 (2020).
43. Liu, H. et al. Secondary analysis of existing microarray data reveals potential gene drivers of cutaneous squamous cell carcinoma.
J. Cell. Physiol. https://doi.org/10.1002/jcp.28172 (2019).
44. Bayne, L. J. et al. Tumor-derived granulocyte-macrophage colony-stimulating factor regulates myeloid inflammation and T cell
immunity in pancreatic cancer. Cancer Cell 21, 822–835. https://doi.org/10.1016/j.ccr.2012.04.025 (2012).
45. Chao, T., Furth, E. E. & Vonderheide, R. H. CXCR2-dependent accumulation of tumor-associated neutrophils regulates t-cell
immunity in pancreatic ductal adenocarcinoma. Cancer Immunol. Res. 4, 968–982. https: //doi.org/10.1158/2326-6066.cir-16-0188
(2016).
46. Rhim, A. D. et al. EMT and dissemination precede pancreatic tumor formation. Cell 148, 349–361. https://doi.org/10.1016/j.
cell.2011.11.025 (2012).
47. Goebel, L. et al. CD4(+) T cells potently induce epithelial-mesenchymal-transition in premalignant and malignant pancreatic
ductal epithelial cells-novel implications of CD4(+) T cells in pancreatic cancer development. Oncoimmunology 4, e1000083. https
://doi.org/10.1080/2162402X.2014.1000083 (2015).
48. Zhou, Z. et al. Ten hub genes associated with progression and prognosis of pancreatic carcinoma identified by co-expression
analysis. Int. J. Biol. Sci. 14, 124–136. https://doi.org/10.7150/ijbs.22619 (2018).
49. Giulietti, M., Occhipinti, G., Principato, G. & Piva, F. Weighted gene co-expression network analysis reveals key genes involved in
pancreatic ductal adenocarcinoma development. Cell. Oncol. (Dordrecht) 39, 379–388. https: //doi.org/10.1007/s13402 -016-0283-7
(2016).
50. Wang, D. et al. Identifying miRNA-mRNA regulation network of chronic pancreatitis based on the significant functional expres-
sion. Medicine 96, e6668. https://doi.org/10.1097/md.0000000000006668 (2017).
51. Zhang, T., Wang, X. & Yue, Z. Identification of candidate genes related to pancreatic cancer based on analysis of gene co-expression
and protein–protein interaction network. Oncotarget 8, 71105–71116. https://doi.org/10.18632/oncotarget.20537 (2017).
Acknowledgements
This study was supported by the National Natural Science Foundation of China (Grant no. 31201052), the Health
Technology Innovation Project of Jilin Province (Grant No.2018j064), the Outstanding Youth Program for Sci-
ence and Technology Development of Jilin Province (Grant no. 20190103094JH) and Graduate Innovation Fund
of Jilin University. The authors confirm independence from the sponsors; the content of the article has not been
influenced by the sponsors.
Author contributions
J.T., Z.H., M.W. and Z.Y. wrote the main manuscript text; J.T., Y.W. and Z.H. did the experiment and prepared
figures; X.M., M.L. and L.L. designed the manuscript. All authors reviewed the manuscript.
Competing interests
The authors declare no competing interests.
Additional information
Supplementary Information The online version contains supplementary material available at https://doi.
org/10.1038/s41598-021-83015-4.
Correspondence and requests for materials should be addressed to X.M., M.L. or L.L.
Reprints and permissions information is available at www.nature.com/reprints.
Publisher’s note Springer Nature remains neutral with regard to jurisdictional claims in published maps and
institutional affiliations.
Open Access This article is licensed under a Creative Commons Attribution 4.0 International
License, which permits use, sharing, adaptation, distribution and reproduction in any medium or
format, as long as you give appropriate credit to the original author(s) and the source, provide a link to the
Creative Commons licence, and indicate if changes were made. The images or other third party material in this
article are included in the article’s Creative Commons licence, unless indicated otherwise in a credit line to the
material. If material is not included in the article’s Creative Commons licence and your intended use is not
permitted by statutory regulation or exceeds the permitted use, you will need to obtain permission directly from
the copyright holder. To view a copy of this licence, visit http://creativecommons.org/licenses/by/4.0/.
© The Author(s) 2021
Scientific Reports | (2021) 11:3409 | https://doi.org/10.1038/s41598-021-83015-4 13
Vol.:(0123456789)You can also read