An experimental pig model with outer retinal degeneration induced by temporary intravitreal loading of N methyl N nitrosourea during vitrectomy ...
←
→
Page content transcription
If your browser does not render page correctly, please read the page content below
www.nature.com/scientificreports
OPEN An experimental pig model
with outer retinal degeneration
induced by temporary intravitreal
loading of N‑methyl‑N‑nitrosourea
during vitrectomy
Kwang‑Eon Choi1, Vu Thi Que Anh2, Jee Taek Kim3, Cheolmin Yun1, Seongkwang Cha4,
Jungryul Ahn4, Yong Sook Goo4* & Seong‑Woo Kim1*
We aimed to develop an outer retinal degeneration pig model induced by temporary intravitreal
loading of N-methyl-N-nitrosourea (MNU) during vitrectomy. In a preliminary experiment involving
5 mini-pig cases to determine the appropriate concentration of MNU, the vitreous cavity of each eye
was filled with 4, 8, 10, 12, or 16 mg/mL MNU for 10 min, which was then replaced with a balanced
salt solution. Multimodal examinations including spectral-domain optical coherence tomography
(OCT) images and full-field electroretinography (ffERG) were obtained at baseline and week 2, week
6, and week 12. The retinal degeneration was classified according to the amplitudes of a dark adaptive
(DA) 10.0 a-wave amplitude. The degree of moderate retinal degeneration was defined as DA 10.0
a-wave amplitude ≥ 10% and < 60% of baseline amplitude. The degree of severe degeneration was
defined as DA 10.0 a-wave amplitude < 10% of baseline amplitude, noise, or flat signal. Hematoxylin
and eosin staining and immunohistochemistry were performed at week 12. The main experiments
were conducted first with 10 cases of 5 mg/mL and later with 13 cases of 10 mg/mL. In the preliminary
experiment, degree of outer retinal degeneration increased with MNU concentration. Use of 4, 8, 10,
12, and 16 mg/mL MNU showed no, moderate, severe, severe, and atrophic changes, respectively.
In the main experiments, there were 9 cases of moderate retinal degeneration and 1 case of severe
degeneration in 5 mg/mL MNU group. Two cases of moderate degeneration and 11 of severe
degeneration were recorded in 10 mg/mL group. Mean thickness of total retina, inner nuclear layer,
and outer nuclear layer decreased at week 2 in both groups. The mean amplitudes on ffERG decreased
at week 2. The ffERG and OCT findings did not change from week 2 to week 6 or week 12. The results of
staining supported those of ffERG and OCT. Temporal MNU loading in a vitrectomized pig-eye model
induced customized outer retinal degeneration with changing the concentration of MNU.
Retinal degeneration and dry age-related macular degeneration, such as retinitis pigmentosa and geographic
atrophy, are the important causes of blindness1,2. To treat patients, retinal prosthetics such as Argus II (SECOND
SIGHT, Sylmar, CA, USA) and alpha AMS (Retina Implant AG, Reutlingen, Germany) have been implanted for
investigational or commercial purposes in many c ountries3–5. While neither Argus II nor alpha AMS are being
manufactured anymore, other retinal implants have been d eveloped6,7. To accelerate development of retinal
implants, the efficacy and safety of the retinal implants must be tested at the preclinical stage. Animal models
physiologically similar to human outer retinal degeneration are important.
Knock-out animal models offer relevant similarities to human e ye8–13. However, these models are expensive
and can require prolonged periods to manifest disease. Furthermore, there is limited ability of gene knock-out
models to control the onset of disease and determine its severity at a certain a ge10,11.
1
Department of Ophthalmology, Korea University College of Medicine, Seoul, South Korea. 2Department
of Ophthalmology, Hanoi Medical University, Hanoi, Vietnam. 3Department of Ophthalmology, Chung-Ang
University College of Medicine, Seoul, South Korea. 4Department of Physiology, Chungbuk National University
College of Medicine, Cheongju, South Korea. *email: ysgoo@chungbuk.ac.kr; ksw64723@korea.ac.kr
Scientific Reports | (2021) 11:258 | https://doi.org/10.1038/s41598-020-79437-1 1
Vol.:(0123456789)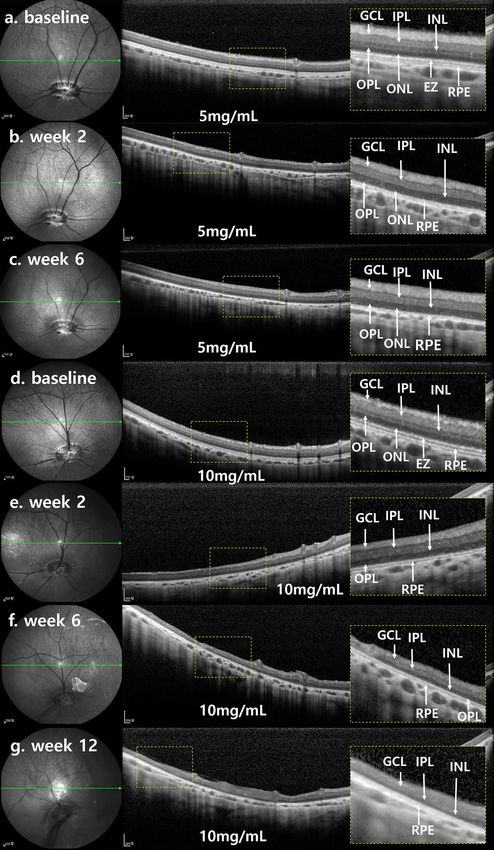
www.nature.com/scientificreports/
Pharmaceutical animal models can substitute for genetic models with respect to price and relative ease of
mass production. These models have been induced by systemic application of pharmaceuticals such as N-methyl-
N-nitrosourea (MNU), iodoacetic acid, and sodium iodate (SI)14–17. However, for a large animals, few models of
retinal degenerations have been successfully induced by systemic injection of d rugs15,18,19. Toxic pharmaceuticals
20,21
can result in systemic toxicity and deterioration of animal general h ealth . To avoid these problems, intra-
vitreal injection of small doses of pharmaceuticals has been tested, and positive results have been reported22.
In previous studies, we successfully induced outer retinal degeneration by intravitreal injection of SI or MNU
after vitrectomy in rabbit and dog23,24. While globally diffuse homogeneous outer retinal degeneration can be
acquired in a vitrectomized eye with SI, intravitreal MNU injection induced only localized homogeneous retinal
degeneration, even in a vitrectomized eye. One difficulty was that dose of intravitreally-injected drug must be
adjusted and defined according to eyeball size or lens status of each different animal. To solve this problem, the
drug administration protocol need to be changed from a volume-based method to one based on concentration.
The purpose of the present study was to induce globally homogeneous outer retinal degeneration with a tem-
porary MNU tamponade in the vitreous cavity and to correlate intravitreal MNU concentration with degree of
retinal degeneration in a large animal (mini-pig).
Results
Animals. The mean age of mini-pigs was 11.13 ± 2.31 months, and the mean body weight was 29.86 ± 2.94 kg.
The mean axial length was 20.32 ± 0.81 mm. During follow-up periods, there was no significant weight loss and
decrease of activity in all mini-pigs.
The first preliminary experiment of each dose of MNU. Full‑field electroretinography and multifocal
electroretinography. The 4 mg/mL MNU case showed no degeneration according to ffERG results. No decrease
of amplitude and no delay of implicit time was evident at week 2 in the scotopic and photopic ffERG results. No
flat or noise signals were seen in the mfERG. The 8 mg/mL MNU case showed moderate degeneration under
ffERG. The amplitude decreased after 2 weeks in the scotopic and photopic ffERG results. However, only noise
was observed at week 2 in mfERG analysis. Both the 10 mg/mL and 12 mg/mL MNU cases showed severe de-
generation under ffERG. All ffERG results showed an almost flat down signal or noise signal. Only noise was ob-
served in mfERG. Finally, the 16 mg/mL MNU case showed noise signals for both ffERG and mfERG at 12 weeks
after MNU exposure (Fig. 1, Supplementary Fig. 1).
Fundus infrared reflectance and spectral‑domain optical coherence tomography. The 4 mg/mL MNU case showed
that the 3 nuclear layers of ganglion cell layer (GCL), ONL, and INL were well maintained at week 2. The EZ and
RPE layers were also intact in the 4 mg/mL MNU case. In the 8 mg/mL MNU case, the boundary of INL and
ONL became indistinct at week 2, and the EZ became obscure. Both the 10 mg/mL and 12 mg/mL MNU cases
showed indistinguishable EZ and ONL at week 2. However, the 12 mg/mL MNU case showed a decrease of INL
thickness more than the 10 mg/mL MNU case at week 2 compared with baseline. These trends remained stable
until weeks 6 and 12 in the 4 mg/mL, 8 mg/mL, 10 mg/mL and 12 mg/mL MNU cases. In the 16 mg/mL MNU
case, the layers became atrophic and the focal retina melted, causing focal retinal detachment at week 2 (Fig. 2,
Supplementary Fig. 2).
Hematoxylin and eosin and immunohistochemistry. The 4 mg/mL MNU case showed that all INL, GCL, and
nerve fiber layer (NFL) were intact. Photoreceptors were nearly intact in H&E staining (Fig. 3). For Immunohis-
tochemistry, Rhodopsin staining, and PNA staining showed intact cone and rod cells. RPE65 staining showed
intact RPE and co-staining of photoreceptors. NeuN staining showed intact ganglion cells and co-staining of
photoreceptors. PKC-α staining showed intact bipolar cells, and GFAP staining showed nearly normal Müller
cells (Fig. 4).
The density of photoreceptors decreased in H&E staining of the 8 mg/mL MNU sample (Fig. 3). The densi-
ties of ONL and INL were also reduced, while GCL was relatively intact. Rhodopsin staining and PNA staining
showed few remnant rods and cones, respectively. RPE65 and PKC-α staining showed nearly intact RPE cells and
bipolar cells. NeuN staining showed intact GCL but co-staining of few photoreceptors. GFAP staining showed
mildly increased staining (Fig. 4).
The 10 mg/mL MNU case revealed few ONL cells among mainly INL cells in H&E staining (Fig. 3). Rhodop-
sin and PNA staining showed rare rod or cone cells with co-staining of RPE cells. RPE 65, PKC-α, and NeuN
staining showed intact RPE cells, bipolar cells, and ganglion cells, respectively. No co-staining of photoreceptors
was evident in NeuN staining. GFAP staining showed increased staining (Fig. 4).
The 12 mg/mL MNU case revealed no ONL cells among mainly INL cells in H&E staining (Fig. 3). Rhodopsin
and PNA staining showed no rod or cone cells with co-staining of RPE cells. RPE 65, PKC-α, and NeuN stain-
ing showed intact RPE cells, bipolar cells, and ganglion cells, respectively. No co-staining of photoreceptors was
evident in NeuN staining. GFAP staining showed increased staining (Fig. 4).
The 16 mg/mL MNU case revealed proliferative vitreoretinopathy and retinal detachment, and all layers
were extremely thin in H&E staining (Fig. 3). In immunohistochemistry, RPE staining showed nearly intact
RPE cells (Fig. 4).
Efficacy experiment results of the 5 mg/mL MNU group (n = 10). Full‑field electroretinography and
multifocal electroretinography. The 5 mg/mL MNU group included 9 cases of moderate degeneration and 1 case
of severe degeneration. The mfERG of moderate degeneration cases produced severely decreased amplitudes
and focal noise signals in the ffERG field. The delay of b-wave in DA 0.01 ffERG was not statistically significant
Scientific Reports | (2021) 11:258 | https://doi.org/10.1038/s41598-020-79437-1 2
Vol:.(1234567890)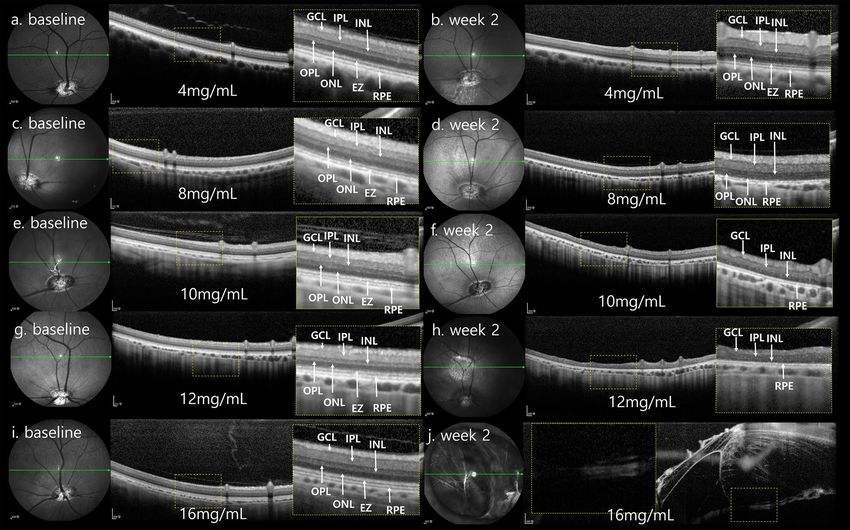
www.nature.com/scientificreports/

                                 Figure 1.  ffERG and mfERG findings of the retina in one case of each 4 mg/mL, 8 mg/mL, 10 mg/mL, 12 mg/
                                 mL, and 16 mg/mL MNU. (a) The DA 10.0 a-wave amplitude at baseline and week 2 was 25.4 µV and 26.1 µV,
                                 respectively, in the 4 mg/mL MNU case. (b) mfERG in the 4 mg/mL MNU showed no signal flattening or
                                 noise signals at week 2. (c) The DA 10.0 a-wave amplitude at baseline and week 2 was 89.3 µV and 10.1 µV,
                                 respectively, in the 8 mg/mL MNU case. The amplitudes in scotopic and photopic ffERG decreased at week 2,
                                 but no signal was flat or appeared as noise, especially in photopic ffERG. (d) mfERG in the 8 mg/mL MNU case
                                 showed focal noise signal and signal flattening at week 2. (e) The DA 10.0 a-wave amplitude at baseline and week
                                 2 was 38.6 µV and 6.21 µV, respectively, in a 10 mg/mL MNU case. All signals of ffERG showed nearly flat down
                                 signals or noise signals at week 2. (f) The mfERG in a 10 mg/mL MNU case showed only noise signals at week 2.
                                 (g) The DA 10.0 a-wave amplitude at baseline and week 2 was 61.3 µV and 5.67 µV, respectively, in a 12 mg/mL
                                 MNU case. All signals of ffERG showed nearly flat down signals or noise signals at week 2. (h) The mfERG in a
                                 12 mg/mL MNU case showed only noise signals at week 2. (i,j) Both ffERGs and mfERGs in a 16 mg/mL MNU
                                 case showed noise signals at week 2. ffERG full field electroretinogram, MNU N-methyl-N-nitrosourea, DA dark
                                 adaptive, mfERG multifocal electroretinogram.

Scientific Reports |   (2021) 11:258 |               https://doi.org/10.1038/s41598-020-79437-1                                                3

                                                                                                                                          Vol.:(0123456789)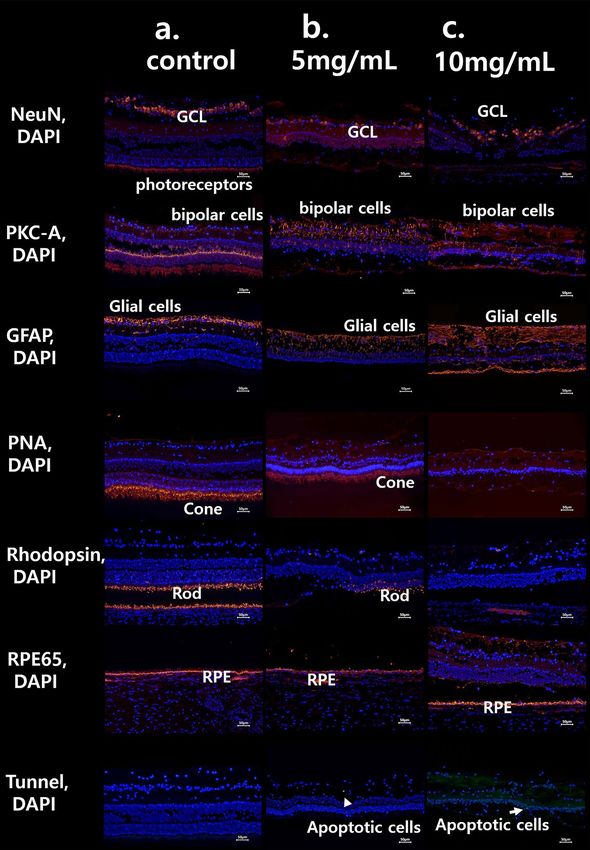
www.nature.com/scientificreports/
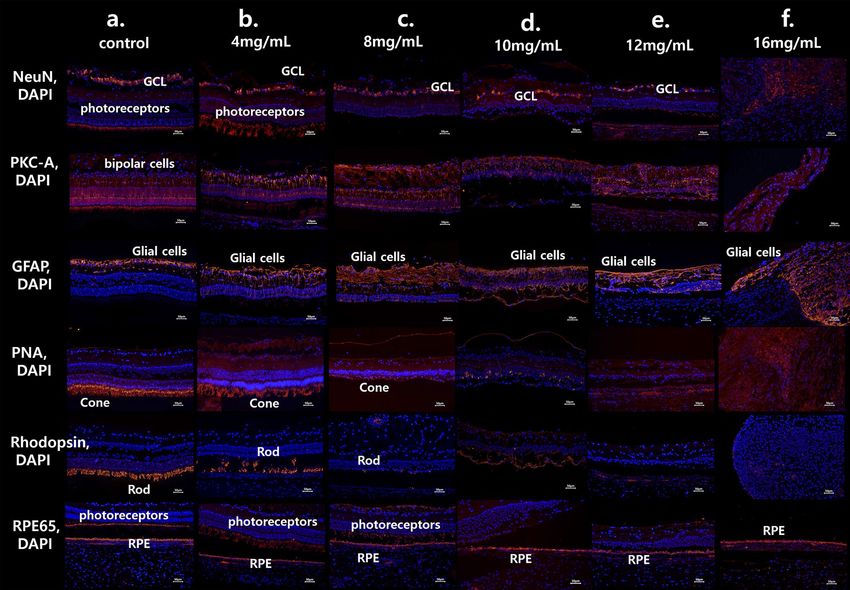
Figure 2. SD-OCT findings of the retina in one case of each 4 mg/mL, 8 mg/mL, 10 mg/mL, 12 mg/mL, and
16 mg/mL MNU at baseline and week 2. (a–j) Each magnified SD-OCT image of the case is on the right sided
and shown with a dashed-line box. (a,b) OCT image of the 4 mg/mL MNU case showed intact GCL, INL,
ONL, photoreceptor layer, and RPE at baseline and week 2. (c,d) OCT image of the 8 mg/mL MNU case at
week 2 showed an intact ganglion cell layer and retinal pigment epithelium. The boundary of the INL and ONL
became indistinct compared with the SD-OCT image at baseline (c). The EZ representing the photoreceptor
layer became obscure. OCT images of the 8 mg/mL MNU case at weeks 6 and 12 weeks showed no change
compared with that at week 2 (Supplementary Fig. 2). (e,f) On the OCT, unlike baseline, the EZ and ONL were
indistinguishable at week 2 in the 10 mg/mL MNU case. However, there was no significant decrease in INL
thickness. (g,h) On the OCT, unlike baseline, the EZ and ONL were indistinguishable at week 2 in the 12 mg/
mL MNU case. In addition, there was a decrease in INL thickness. The total retinal thickness of the 12 mg/mL
MNU case at week 6 was thinner than at week 2 (Supplementary Fig. 2). (i,j) After week 2, the retina melted and
induced retinal detachment in SD-OCT images of the 16 mg/mL MNU case. SD-OCT spectral domain optical
coherence tomography, MNU N-methyl-N-nitrosourea, GCL ganglion cell layer, IPL inner plexiform layer, INL
inner nuclear layer, OPL outer plexiform layer, ONL outer nuclear layer, EZ ellipsoid zone, RPE retinal pigment
epithelium.
at week 2 and at week 6. The mean amplitude of b-waves in the DA 0.01 ffERG showed a significant decrease at
week 2, but no difference was evident between weeks 2 and 6. The mean implicit time in DA 10.0 ffERG showed
a temporal delay at week 2. The mean amplitude in the DA 10.0 ffERG decreased at week 2 and then remained
low from week 2 to week 6. The mean implicit time in LA 3.0 ffERG was not changed at weeks 2 and 6. The mean
amplitude in LA 3.0 ffERG showed a decrease at week 2 and remained low at week 6. The mean amplitude of LA
3.0 flicker showed a decrease at week 2 and remained low at week 6 (Fig. 5, Table 1).
Fundus infrared reflectance and spectral‑domain optical coherence tomography. SD-OCT images at week 2
showed intact GCL and RPE. The ellipsoid zone on 55-degree SD-OCT fields was barely distinguishable at week
2 (Fig. 6), and outer plexiform layer thickness decreased. From week 2 to week 6, subsequent changes were mini-
mal and similar among layers. Mean thicknesses of INL, ONL, and TRL showed significant decrease at week 2.
From week 2 to week 6, changes were minimal (Fig. 7, Table 2).
Hematoxylin and eosin and immunohistochemistry. In H&E staining of moderate degeneration cases (n = 9),
the INL, GCL, and NFL were nearly intact (Fig. 8). Rhodopsin staining showed severely decreased rod cells,
and PNA staining showed focal intact cone cells. RPE65 staining showed intact RPE and rare co-staining of
photoreceptors. NeuN staining showed intact ganglion cells and co-staining of few photoreceptors. PKC-α stain-
ing showed intact bipolar cells, and GFAP staining showed nearly normal Müller cells. No apoptotic cells were
evident in Tunel staining (Fig. 9).
Scientific Reports | (2021) 11:258 | https://doi.org/10.1038/s41598-020-79437-1 4
Vol:.(1234567890)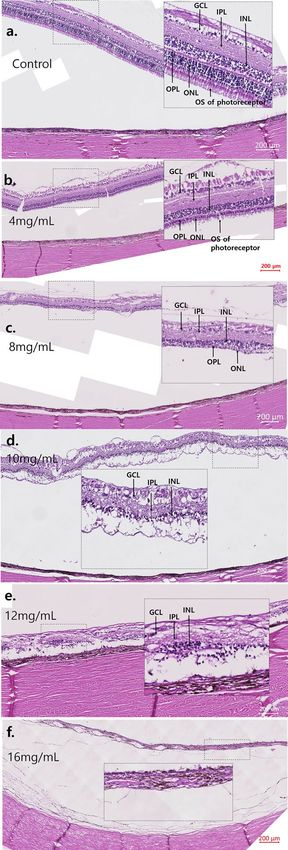
www.nature.com/scientificreports/

                                 Figure 3.  H&E staining image of the retina in cases of 4 mg/mL, 8 mg/mL, 10 mg/mL, 12 mg/mL, and 16 mg/
                                 mL MNU. (a–f) Each magnified H&E staining image of the case is on the right-side shown with a dashed-line
                                 box. (a) H&E staining of the control case. Each count number of ONL, INL, and GCL in dotted enlarged area
                                 was 586, 298, and 56, respectively. (b) In H&E staining of the 4 mg/mL MNU case, all layers including the INL,
                                 GCL, and NFL were nearly intact. However, the thickness of OPL and ONL decreased. ONL (4 nuclear layers)
                                 of the 4 mg/mL MNU case is thinner than ONL (7–8 nuclear layers) of control (a). Each count number of ONL,
                                 INL, and GCL in dotted enlarged area was 247, 285, and 50, respectively. (c) In H&E staining of the 8 mg/mL
                                 MNU case, the outermost photoreceptors remained to some degree but at severely reduced density. The density
                                 of ONL and INL also was reduced, but the GCL was relatively intact. Each count number of ONL, INL, and
                                 GCL in dotted enlarged area was 43, 216, and 40, respectively. (d) In H&E staining of the 10 mg/mL MNU case,
                                 ONL cells were rarely observed among INL or combined INL with ONL cells. Each count number of ONL,
                                 INL, and GCL in dotted enlarged area was 0, 87, and 16, respectively. (e) In H&E staining of the 12 mg/mL
                                 MNU case, ONL cells were rarely observed among INL or combined INL with ONL cells. Each count number
                                 of ONL, INL, and GCL in dotted enlarged area was 0, 74, and 15, respectively. (f) In H&E staining of the 16 mg/
                                 mL MNU case, proliferative vitreoretinopathy and retinal detachment were observed, and the entire layer was
                                 extremely thin. MNU N-methyl-N-nitrosourea, GCL ganglion cell layer, IPL inner plexiform layer, INL inner
                                 nuclear layer, OPL outer plexiform layer, ONL outer nuclear layer, OS outer segment.

Scientific Reports |   (2021) 11:258 |               https://doi.org/10.1038/s41598-020-79437-1                                                5

                                                                                                                                          Vol.:(0123456789)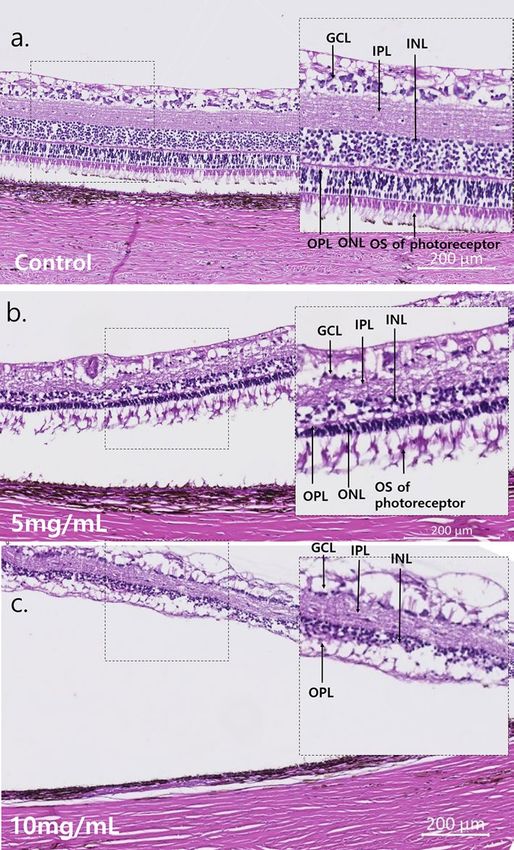
www.nature.com/scientificreports/

                                           Figure 4.  The immunohistochemistry findings of the retina in cases of 4 mg/mL, 8 mg/mL, 10 mg/mL, 12 mg/
                                           mL, and 16 mg/mL MNU. (a) The normal immunohistochemistry of a control case. Rhodopsin staining
                                           and PNA staining showed well-stained rod and cone cells (each percentage of the stained layer = 12.86%
                                           and 13.51%). (b) Immunohistochemistry of the 4 mg/mL MNU case. NeuN stain showed intact ganglion
                                           cells and co-staining of photoreceptors. PKC-α staining showed intact bipolar cells, and GFAP staining
                                           showed nearly normal muller cells. Rhodopsin staining showed intact rod cells (the percentage of the stained
                                           layer = 10.03%), and PNA staining showed intact cone cells (the percentage of the stained layer = 12.44%).
                                           RPE65 staining showed intact RPE and co-staining of photoreceptors. c. Immunohistochemistry of the 8 mg/
                                           mL MNU case. NeuN staining showed intact GCL. PKC-α staining showed nearly intact bipolar cells but
                                           co-staining of few photoreceptors. GFAP staining showed mildly increased stained cells. Rhodopsin staining
                                           and PNA staining showed few stains of rod and cone cells, respectively (each percentage of the stained
                                           layer = 0.23% and 3.22%). RPE65 showed nearly intact RPE cells with co-staining of a few photoreceptors.
                                           (d) Immunohistochemistry of the 10 mg/mL MNU case. NeuN and PKC-α stainings showed ganglion cells
                                           and bipolar cells, respectively. There was no co-staining of photoreceptors with NeuN staining. GFAP stain
                                           showed increased staining. Rhodopsin and PNA staining showed rarely stained rod and cone cells (each
                                           percentage of the stained layer = 0.43% and 2.11%).with co-staining of RPE cells. RPE 65 showed intact RPE
                                           cells. (e) Immunohistochemistry of the 12 mg/mL MNU case. NeuN and PKC-α stainings showed ganglion
                                           cells and bipolar cells, respectively. There was no co-staining of photoreceptors with NeuN staining. GFAP
                                           stain showed increased staining. Rhodopsin and PNA staining showed no stained rod and cone cells (each
                                           percentage of the stained layer = 0% and 0%) with co-staining of RPE cells. RPE 65 showed intact RPE cells. (f)
                                           Immunohistochemistry of the 16 mg/mL MNU case. RPE staining showed nearly intact RPE cells, and GFAP
                                           staining showed a marked increase in stained lesions. MNU N-methyl-N-nitrosourea, GCL ganglion cell layer,
                                           IPL inner plexiform layer. Each percentage of the stained layers was evaluated by the stained area/all layer area
                                           using ImageJ software (1.53a version, National Institutes of Health, Bethesda, MD, USA).

                                           Efficacy experiment results of the 10 mg/mL MNU group (n = 13). Full‑field electroretinography
                                           and multifocal electroretinography. The 10 mg/mL MNU group included 11 cases of severe degeneration and 2
                                           cases of moderate degeneration. A significant delay in implicit time was recorded in the DA 0.01 ffERG at week
                                           2, but the change was not statistically significant at weeks 6 or 12. The amplitude of b-waves in the DA 0.01 ffERG
                                           showed a significant decrease at week 2. In DA 10.0 ffERG, there was a delay of implicit time at week 2. The am-
                                           plitudes on DA 10.0 ffERG decreased at week 2. In the LA 3.0 ffERG, decreased amplitude was observed at week
                                           2. Above each amplitude and implicit time remained decreased and delayed from week 2 to week 12, respectiv-
                                           ley. The implicit time in LA 3.0 ffERG did not change at week 2, and there was no significant change from week

          Scientific Reports |   (2021) 11:258 |                https://doi.org/10.1038/s41598-020-79437-1                                                     6

Vol:.(1234567890)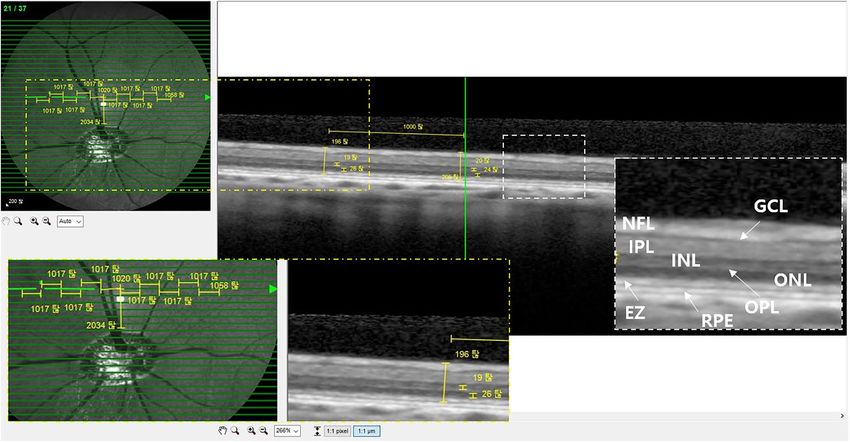
www.nature.com/scientificreports/
2 to week 12. The amplitude of LA 3.0 flicker showed a decrease at week 2 and remained decreased from week 2
to week 12. In the mfERG of all cases, only noise signals were observed at each follow-up period (Fig. 5, Table 3).
Fundus infrared reflectance and spectral‑domain optical coherence tomography. On SD-OCT, the EZ was indis-
tinguishable at week 2. The thicknesses of INL, ONL, and TRL appeared to decrease at week 2 (Fig. 6). Further
losses of INL and ONL were not detected at week 6 or 12. In addition, there was decrease in mean thicknesses
of INL, ONL, and TRL. From week 2 to week 12, each mean thickness showed no subsequent changes (Fig. 7,
Table 2).
Hematoxylin and eosin and immunohistochemistry. In H&E staining of severe degeneration cases (n = 11), ONL
cells were rarely observed among mainly INL (Fig. 8). Rhodopsin and PNA staining showed no rod or cone
cells with co-staining of RPE cells. RPE 65, PKC-α, and NeuN staining showed intact RPE cells, bipolar cells,
and ganglion cells, respectively. There was no co-staining of photoreceptors in the NeuN stain. GFAP staining
showed increased staining, especially in the outer retina, and Tunel staining showed no stained lesions (Fig. 9).
Discussion
Our study used a mini-pig model to evaluate the effect of MNU on photoreceptors because the size, vascu-
lar anatomy, vascular function, and immunology of the pig eye are comparable to those of a human eye25–28.
Although the pig retina does not have a fovea, a so-called visual streak of high cone density (rod:cone ratio = 3:1
[central], 8:1 [mean], and 16:1 [peripheral]) is located in a horizontal axis near the posterior pole of the fundus
and is similar to that of human fovea29,30. Therefore, for preclinical studies, many pig disease models have been
studied12,13,19,31–34. Noel et al. showed that concentration-dependent reduction in both ffERG b-wave and mfERG
N1–P1 amplitudes compared to baseline after intravenous Iodoacetic acid injection. The fundus of pig treated
with ≥ 10 mg/kg Iodoacetic acid was abnormal with thinner retinal vessels and pale optic discs like retinitis pig-
mentosa, but there was no extinction of photopic ffERG19. Geographic atrophy in pig was successfully induced
by subretinal 0.01 mg/mL SI injection31. Diabetic retinopathy pig models showed several similar signs of diabetic
retinopathy like those seen in h umans32,33. Kleinwort et al. showed that retinas from INS C94Y pigs exposed to
hyperglycemia for more than 2 years have intraretinal microvascular abnormalities and central retinal edema in
a cone-riched r egion33. Because of its similarity with human, the pig retina might be considered as enough model
for glaucoma studies. One study showed that chronically increased intraocular pressure could induce retinal
ganglion cell death significantly in the mid-peripheral and peripheral retina, in which the temporal quadrants
were mainly damaged34.
Although rodent eyes could serve as an alternative to pig retinas in spite of their small size because mice
experience similar retinal vascular development and retinal histological structures, the rodent retina is pre-
dominantly composed of rod cells (rod:cone ratio = approximately 98:2)35. A rabbit’s eyeball size is similar to
that of humans, but rabbit retinal vascular development differs from that of the human eye (melanotic vs. hol-
angiotic)36,37. Numerous studies have employed pigs for large-animal models in the study of retinal diseases and
therapeutic interventions38,39.
We analyzed the effectiveness of temporal MNU tamponade (exposure) with vitrectomy to induce unilateral
diffuse outer retinal degeneration in mini-pig. In a previous experiment, globally diffuse outer retinal degenera-
tion using intravitreal MNU injection was not obtained even after vitrectomy. Instead, localized outer retinal
degeneration was found in the gravitational direction after intravitreal MNU injection in vitrectomized e yes23.
The water solubility of MNU is 14.4 g/L (14.4 mg/mL) at 24 °C, but a small amount of intravitreal MNU injection
(0.05 mL) appeared to be localized on the retinal surface by gravity. Because MNU is sensitive to moisture and
light and hydrolyzes in water with a half-life of 1.2 h at pH 7 at 20 °C40–42, most effects on the retina were thought
to take place rapidly. This may explain why small intravitreal MNU injections have a spatially localized effect on
the retina. To avoid this problem, we temporarily filled a whole vitreous cavity with MNU solution diluted in
BSS. The MNU tamponade was performed for 10 min, which was sufficient for retina whitening (Supplemen-
tary Video 1). After 10 min, as much as possible of the MNU solution was removed by 2 or 3 cycles of air-fluid
exchange, and BSS tamponade was performed in the vitreous cavity at the end of surgery.
Degree of degeneration varied according to MNU concentration. In a preliminary experiment, degree of outer
retinal degeneration of the retina increased with MNU concentration. Temporal tamponade of 5 mg/mL MNU
and 10 mg/mL MNU during vitrectomy was effective to induce respective moderate and severe outer retinal
degeneration without retinal atrophic change. Zulliger et al. showed retinal changes to be MNU concentration-
dependent, a relationship that was most obvious with the O NL43. Other reports showed a dose-dependent
44,45
response over the threshold dose as a c arcinogen .
Two moderate retinal degeneration cases in the 10 mg MNU group showed severe outer retinal change in
most of the area except the far peripheral retina, where the retinal structure was intact. That may explain why
moderate retinal degeneration cases presented diminished amplitudes in ffERG despite ONL layer loss in the
55-degree SD-OCT field. Remnant peripheral vitreous fluid may block adequate exposure of MNU to the far
peripheral retina, which could be predicted after MNU solution tamponade during vitrectomy. After 10 min
of MNU solution tamponade, the color of the degenerated retina changed to white; this color change was not
evident in the non-degenerated far periphery during vitrectomy (Supplementary Video 1). This suggests that
posterior vitreous detachment at the far periphery is important to ensure sufficient application of MNU to the
whole retinal area.
Most degenerative changes were observed at week 2, and no further progress was observed during the study
period. Our immunochemistry results showed rare apoptotic cells in Tunnel stain at week 6 or week 12. One
study using intraperitoneal MNU injection reported that MNU induces peak photoreceptor cell loss 3 days
Scientific Reports | (2021) 11:258 | https://doi.org/10.1038/s41598-020-79437-1 7
Vol.:(0123456789)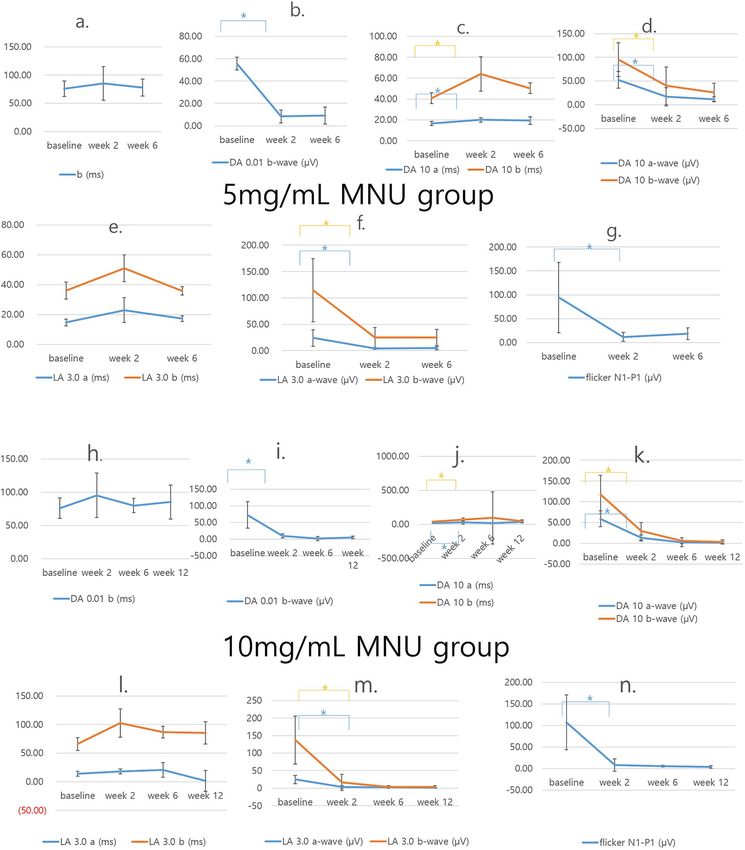
www.nature.com/scientificreports/

          Scientific Reports |   (2021) 11:258 |   https://doi.org/10.1038/s41598-020-79437-1   8

Vol:.(1234567890)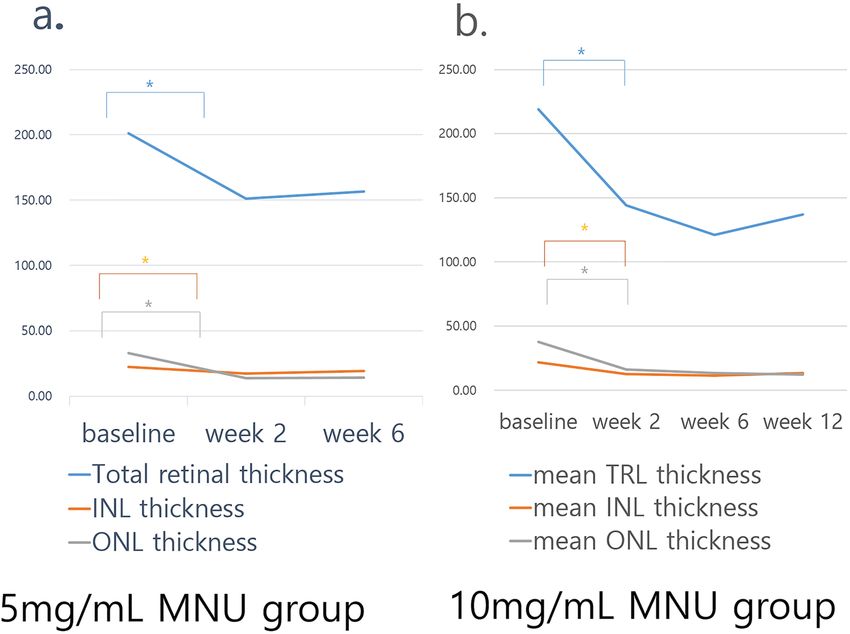
www.nature.com/scientificreports/
◂Figure 5. The ffERG results of the 5 mg/mL MNU group (n = 10) and the 10 mg/mL MNU group (n = 13).
(a–g) The ffERG of the 5 mg/mL MNU group. (a,b) The 5 mg/mL MNU group showed delayed implicit time of
b-waves in dark adaptive (DA) 0.01 ERG at weeks 2 and and 6, but the change was not statistically significant.
The 5 mg/mL MNU group showed significant decrease of b-wave in dark adaptive (DA) 0.01 ERG from baseline
to week 2 (p = 0.028). (c,d) In DA 10.0 ERG, the 5 mg/mL MNU group showed delay of a- and b-waves at week
2 (p = 0.028, 0.018, respectively) and appeared to recover somewhat at week 6, but the amplitudes of both a- and
b-waves decreased at week 2 (p = 0.005, 0.005, respectively) and remained unchanged from week 2 to week 6.
(e,f) In light adaptive (LA) 3.0 ERG, the 5 mg/mL MNU group showed decrease in a- and b-wave amplitudes
at week 2 (p = 0.018, 0.018, respectively) and remained unchanged at week 6, but the implicit time of both a-
and b-waves did not change during follow-up periods. (g) The flicker amplitude in the 5 mg/mL MNU group
showed a decrease in amplitude at week 2 (p = 0.028), but further decrease was not statistically significant. (h–n)
The ffERG results of the 10 mg/mL MNU group. (h,i) The b implicit time in the DA 0.01 ERG did not show a
significant change in the 10 mg/mL MNU group, but the amplitude was nearly flattened at week 2 (p = 0.008)
and showed no recovery or variation after. (j,k) The b implicit time in the DA 10 ERG show a significant change
in the 10 mg/mL MNU group (p = 0.008, 0.008, respectively), and the amplitude nearly flattened at week 2
(p = 0.008, 0.008, respectively) and showed no recovery or variation after that point. (l,m) In LA 3.0 ERG, the
10 mg/mL MNU group showed delay of a- and b-waves at week 2 (p = 0.008, 0.008, respectively), and showed
decreased amplitudes of the a- and b wave at week 2 (p = 0.008, 0.021, respectively), and there was no significant
change at week 6 or 12 compared with the results of week 2. (n) The flicker amplitude in the 10 mg/mL MNU
group showed a decrease in amplitude at week 2 (p = 0.008) and then remained decreased. ffERG full field
electroretinogram, MNU N-methyl-N-nitrosourea, DA dark adaptive, LA light adaptive.
post-injection during a 7-day follow-up p eriod46. Numerous bone marrow–derived cells migrated to the retina
and differentiated into immunoreactive microglia in response to photoreceptor degeneration within 7 days of
MNU injection47. In the apoptosis cascade, down-regulation of Bcl-2 and up-regulation of Bax were seen at 12 h,
and caspase-family activity peaked 72 h after MNU t reatment48.
Our study has some limitations. First, only 6 weeks of follow-up were conducted in the 5 mg/mL MNU
groups, and the degree of outer retinal degeneration could worsen after 6 weeks. There were no significant
changes from week 2 to week 6 in the 5 mg/mL MNU group. No significant changes were also observed from
week 2 to week 12 in the 10 mg/mL MNU group. Furthermore, there were rare apoptotic cells of Tunnel stain
in both groups at week 6 or 12. Because no evidence of retinal degeneration progress was observed in the pre-
liminary study, the relatively short follow-up period for the 5 mg/mL MNU group compared with the 10 mg/
mL group did not appear to affect the results significantly. Second, the unstable chemical properties of MNU in
water may have compromised the reliability and consistency of the results.
In conclusion, temporal exposure of MNU induced outer retinal degeneration in vitrectomized pig eyes. The
degree of retinal degeneration was modulated by adjusting MNU concentration. The MNU-induced pig model
used in this study is a candidate for further research.
Materials and methods
Animals. All procedures adhered to the Association for Research in Vision and Ophthalmology Statement
for the Use of Animals in Ophthalmic and Vision Research. Approval for this study was obtained from the Insti-
tutional Animal Care and Use Committee of Korea University College of Medicine (KOREA-2018-0002-C1).
In the preliminary experiment, a total of 5 eyes from 5 female mini-pigs (MICROPIG, APURES Co., Ltd,
Pyeongtaek-si, Korea) were used to determine degree of retinal change according to MNU concentration (4,
8, 10, 12, and 16 mg/mL). Each concentration was tested in 1 mini-pig. To identify morphological changes in
the retina, fundus infrared reflectance (IR) images, 55-degree spectral-domain optical coherence tomography
(OCT), full-field electroretinography (ffERG), and multifocal ERG (mfERG) were performed at baseline and 2,
6, and 12 weeks after surgery. Histological examinations using hematoxylin and eosin (H&E) and immunohis-
tochemistry staining were performed on selected mini-pig eyes 12 weeks after surgery. In the second efficacy
experiments, which were based on the first experiment, the effect of 5 mg/mL MNU (n = 10) was evaluated in the
mini-pigs following the protocol used in the preliminary experiment, with the exception of week 12 follow-up
examinations. Further study with 10 mg/mL MNU (n = 13) followed the same protocol with week 12 follow-up
examinations.
Vitrectomy with MNU loading. The mini-pigs were anesthetized by intravenous injection of alfaxalone
(1 mg/kg; Alfaxan, Vetoquinol, West Sussex, UK) into the marginal auricular vein following premedication,
which comprised a subcutaneous injection of atropine (0.05 mg/kg), intramuscular injection of xylazine (1 mg/
kg; Rompun, Bayer Corp., Shawnee Mission, KA, USA), and azaperone (4 mg/kg; Stresnil, Mallinckrodt Vet-
erinary Inc, Indianapolis, IN, USA). After general anesthesia, the eye was irrigated with 5% povidone-iodine
and draped for surgery. Three-port, 23-gauge vitrectomy (Associate; DORC, Zuidland, Netherlands) was per-
formed with an indirect lens (Oculus BIOM ready, Oculus Surgical, Inc., FL, USA). Three ports were prepared by
inserting trocar cannulas into the sclera 3 mm from the limbus at ventromedial, ventrolateral, and dorsomedial
sides. The vitreous was removed using a vitreous cutter, while continually supplying balanced salt solution (BSS;
Alcon, Fort Worth, TX). After core vitrectomy, posterior vitreous detachment was induced gently to avoid an
iatrogenic retinal break. Both peripheral vitrectomy and lensectomy were performed. Air-fluid exchange was
Scientific Reports | (2021) 11:258 | https://doi.org/10.1038/s41598-020-79437-1 9
Vol.:(0123456789)www.nature.com/scientificreports/
p-value between baseline and p-value between Week 2 and p-value between baseline
Baseline Week 2 Week 6 Week 2 Week 6 and Week 6
Mean implicit time of b-wave
75.68 ± 13.72 85.30 ± 29.64 77.50 ± 15.05 0.028a 0.866a 0.176a
in the DA 0.01 (ms)
Mean amplitude of b-wave in
55.61 ± 5.73 8.34 ± 5.73 9.19 ± 7.69 0.028a 0.575a 0.013a
the DA 0.01 (µV)
Mean implicit time of a-wave in
16.55 ± 1.98 20.05 ± 2.08 19.35 ± 3.59 0.028a 0.612a 0.086a
DA 10.0 (ms)
Mean implicit time of b-wave
40.75 ± 5.26 64.07 ± 16.44 50.36 ± 5.01 0.018a 0.018a 0.005a
in DA 10.0 (ms)
Mean amplitude of a-wave in
52.26 ± 17.57 16.78 ± 19.06 11.41 ± 5.56 0.005a 0.499a 0.005a
the DA 10.0 (µV)
Mean amplitude of b-wave in
94.94 ± 35.48 39.92 ± 39.92 26.09 ± 18.83 0.005a 0.398a 0.005a
the DA 10.0 (µV)
Mean implicit time of a-wave in
14.72 ± 2.32 23.01 ± 8.27 17.27 ± 1.93 0.062a 0.090a 0.066a
LA 3.0 (ms)
Mean implicit time of b-wave
35.98 ± 5.73 50.95 ± 9.04 35.87 ± 2.86 0.063a 0.018a 0.678a
in LA 3.0 (ms)
Mean amplitude of a-wave in
24.15 ± 15.93 4.03 ± 1.86 4.79 ± 2.95 0.018a 1a 0.005a
LA 3.0 (µV)
Mean amplitude of b-wave in
114.52 ± 59.94 24.96 ± 19.36 24.96 ± 15.57 0.018a 1a 0.007a
LA 3.0 (µV)
Mean amplitude of LA 3.0
94.16 ± 73.74 11.79 ± 9.18 18.41 ± 12.02 0.028a 0.237a 0.017a
flicker (µV)
Table 1. The ffERG findings of the 5 mg/mL MNU group (n = 10). DA dark adaptive, LA light adaptive.
a
Wilcoxon-signed ranked test.
then carried out23,24. The vitreous cavity was fully tamponaded with different concentrations of MNU solution
(Oakwood Products Inc., West Columbia, SC, USA) for 10 min, and MNU solution was removed by air-fluid
exchange. Finally, the vitreous cavity was rinsed 3 times and filled with BSS to ensure complete removal of the
MNU (Supplementary Video 2).
Full‑field electroretinography and multifocal electroretinography. The ffERG protocol was
based on the international standard for electroretinography from the International Society for Clinical Elec-
trophysiology of Vision (ISCEV)49,50. The mini-pigs were anesthetized as described above and dark-adapted for
30 min, after which the pupils were dilated. Light stimulation and ffERG signal recording were performed with
a commercial system (RETIcom; Ronald Consult, Germany), using a contact lens electrode with a built-in light
resource (Kooijman/Damhof ERG lens; Medical Workshop BV, Netherlands). The reference and ground elec-
trodes were subdermal platinum needle electrodes. Reference electrode was placed in the skin near the lateral
canthus of the eyes, and a ground electrode was placed on the forehead between the two eyes. The mfERG proto-
col was based on the ISCEV standard50,51. Light stimulation at a distance of 26 cm from a 19-inch liquid crystal
display monitor and mfERG signal recording used a commercial system (RETIpot; Ronald Consult, Germany).
The contact lens electrode used the same instruments as in ffERG.
The retinal degeneration was classified according to the amplitudes of a dark adaptive (DA) 10.0 a-wave ampli-
tude. The degree of moderate outer retinal degeneration was defined as DA 10.0 a-wave amplitude between ≥ 10%
and < 60% of baseline amplitude. The degree of severe degeneration was defined as DA 10.0 a-wave ampli-
tude < 10% of baseline amplitude including a flat signal or noise with no a or b wave on DA 0.01, 10, light adap-
tive (LA) 3.0 ffERG.
Fundus infrared reflectance and spectral‑domain optical coherence tomography. A-scan
biometry (SW-1000, Suoer, China) was obtained to measure the axial length of the eyeball at baseline. Images
were obtained with 55-degree fundus infrared reflectance (IR) and spectral-domain optical coherence tomog-
raphy (SD-OCT) images using the Spectralis OCT system (Heidelberg Engineering GmbH, Heidelberg, Ger-
many). Vertical and horizontal line scans, as well as raster scans (33 B-scans over a 16.5 × 16.5-mm area in a
55-degree image), were performed at high resolution (1536 A-scans per B-scan, lateral resolution = 10 µm/pixel
in 55-degree image). Up to 100 images were averaged in automatic real-time mode to obtain a high-quality mean
image. Total retinal layer (TRL) thickness was measured along a horizontal line perpendicular to the retinal lay-
ers in cross-sectional images. Inner nuclear layer (INL) thickness and outer nuclear layer (ONL) thickness were
measured at 10 different areas, along with a horizontal visual streak 2 mm dorsal to the optic disc (Fig. 10). TRL
thickness was defined as the distance between the inner margin of the internal limiting membrane to the inner
margin of the retinal pigment epithelium (RPE) layer. INL thickness was defined as the distance between the
outer margin of the inner plexiform layer to the inner margin of the outer plexiform layer. ONL thickness was
defined as the distance between the outer margin of the outer plexiform layer to the inner margin of the ellipsoid
zone (EZ)52.
Scientific Reports | (2021) 11:258 | https://doi.org/10.1038/s41598-020-79437-1 10
Vol:.(1234567890)www.nature.com/scientificreports/
Figure 6. SD-OCT finding of each representative case of 5 mg/mL MNU and 10 mg/mL MNU. (a–g) Each
magnified SD-OCT image of the case is from the right side and shown with a dashed-line box. (a–c). OCT
images of a representative case with moderate outer degeneration in the 5 mg/mL group. (a,b) OCT images at
week 2 showed intact GCL and RPE. The EZ was indistinguishable at week 2. In addition, there was a decrease
in OPL thickness. (c) OCT images remained stable at week 6 compared with the results of week 2. (d–g) OCT
images of a representative case with severe outer degeneration in 10 mg/mL group. (d,e) On the OCT, unlike
baseline, the ellipsoid zone was indistinguishable at week 2. In addition, there was a decrease in INL thickness
and ONL. (f,g) OCT image at weeks 6 and 12 showed no significant change compared with the results of week
2. However, the signal intensity of OCT decreased at week 12 due to anterior capsular opacity. SD-OCT spectral
domain optical coherence tomography, GCL ganglion cell layer, IPL inner plexiform layer, INL inner nuclear
layer, OPL outer plexiform layer, ONL outer nuclear layer, EZ ellipsoid zone, RPE retinal pigment epithelium.
Scientific Reports | (2021) 11:258 | https://doi.org/10.1038/s41598-020-79437-1 11
Vol.:(0123456789)www.nature.com/scientificreports/
Figure 7. Sequential changes of total retinal thickness, inner nuclear layer thickness, and outer nuclear layer
thickness. (a) In the 5 mg/mL MNU group, there was a significant decrease in INL, ONL, and total retinal
thickness in week 2. After week 2, the subsequent changes were minimal and remained so until week 6. (b) In a
10 mg/mL MNU group, there was also a significant decrease of INL, ONL, and total retinal thickness at week 2.
After week 2, the subsequent changes were minimal and remained decreased through week 12. TRL total retinal
thickness, INL inner nuclear layer, ONL outer nuclear layer, MNU N-methyl-N-nitrosourea).
p-value between baseline and p-value between Week 2 and p-value between baseline
Baseline Week 2 Week 6 (12)a Week 2 Week 6 (12)a and Week 6 (12)a
Mean INL thickness in 5 mg/
22.38 ± 4.93 17.46 ± 7.58 19.41 ± 3.89 < 0.001b 0.831b < 0.001b
mL MNU group (μm)
Mean ONL thickness in 5 mg/
32.93 ± 9.56 13.92 ± 7.31 14.44 ± 5.69 < 0.001b 0.575b < 0.001b
mL MNU group (μm)
Mean TR thickness in 5 mg/
201.10 ± 24.95 151.20 ± 38.11 156.74 ± 15.01 < 0.001b 0.136b < 0.001b
mL MNU group (μm)
Mean INL thickness in 10 mg/
21.80 ± 5.81 12.80 ± 2.78 12.34 ± 3.40 < 0.001b 0.831b < 0.001b
mL MNU group (μm)
Mean ONL thickness (μm) in
37.93 ± 6.13 16.20 ± 8.35 12.15 ± 8.97 < 0.001b 0.575b < 0.001b
10 mg/mL MNU group (μm)
Mean TR thickness in 10 mg/
201.10 ± 24.95 144.00 ± 34.88 136.77 ± 43.39 < 0.001b 0.136b < 0.001b
mL MNU group (μm)
Table 2. Optical coherence tomography findings of the 5 mg/mL MNU group (n = 10) and 10 mg/mL MNU
groups (n = 13). INL inner nuclear layer, MNU N-methyl-N-nitrosourea, ONL outer nuclear layer, POD
postoperative day, TR total retinal thickness. a At week 12 in 10 mg/mL MNU group. b Wilcoxon-signed ranked
test.
Histological examination. Immediately after euthanasia, the subject eyes were enucleated, immersion-
fixed in Davidson’s solution for 24 h, dehydrated, and embedded in paraffin. Sections 4 µm in width were cut and
stained with H&E. The slides were examined for retinal pathological changes using a light microscope (BX-53,
Olympus Corp., Tokyo, Japan) and photographed with a slide scanner (Zeiss Axio Scan. Z1, White Plains, NY,
USA).
Immunohistochemistry. Tissue sections were deparaffinized, rehydrated, and microwave-heated in anti-
gen retrieval buffer (tris-ethylenediaminetetraacetic acid solution, pH 9.0). Sections were then blocked with 4%
horse serum in phosphate-buffered saline with Tween, followed by incubation with each primary antibody at
Scientific Reports | (2021) 11:258 | https://doi.org/10.1038/s41598-020-79437-1 12
Vol:.(1234567890)www.nature.com/scientificreports/
Figure 8. H&E staining of a representative case of the 5 mg/mL MNU and 10 mg/mL MNU groups. (a–c) Each
magnified H&E staining image was from the right side and is shown with a dashed-line box. (a) H&E staining
of a control case. Each count number of ONL, INL, and GCL in dotted enlarged area was 201, 307, and 49,
respectively. (b) H&E staining of a representative case with moderate outer degeneration in the 5 mg/mL group.
In H&E staining, all the INL, GCL and NFL were intact, but the density of INL and GCL decreased. Each count
number of ONL, INL, and GCL in dotted enlarged area was 100, 91, and 16, respectively. (c) H&E staining of
a representative case with severe outer degeneration in the 10 mg/mL group. ONL cells were rarely observed
among INL or combined INL with ONL cells. Each count number of ONL, INL, and GCL in dotted enlarged
area was 0, 112, and 29, respectively. H&E hematoxylin and eosin, GCL ganglion cell layer, IPL inner plexiform
layer, INL inner nuclear layer, OPL outer plexiform layer, ONL outer nuclear layer, OS outer segment, RPE
retinal pigment epithelium.
4 °C overnight. Nuclei were counterstained with 4,6-diamidino-2-phenylindole (Sigma-Aldrich, St. Louis, MO,
USA), and Alexa Fluor 594-conjugated goat anti-mouse secondary antibody (1:300; Biogend, Taipei City, Tai-
wan) was used to perform fluorescence detection for anti-PKC-α (1:200; Invitrogen, Carlsbad, CA, USA) stain-
ing, anti-GFAP (1:300; NOVUSBIO, Centennial, CO, USA) immunostaining, anti-NeuN (1:250; Merck, Darm-
stadt, Land Hessen, Germany) immunostaining, anti–peanut agglutin (PNA) (1:300; VECTOR, Woodinville,
WA, USA) immunostaining, anti-rhodopsin (1:200; Rockland, Limerick, PA, USA) immunostaining, and anti-
RPE65 (1:200; Invitrogen, Carlsbad, CA, USA) immunostaining (Table 4). Cells stained by TUNEL were evalu-
ated using fluorescence microscopy (T2000-U; Nikon, Tokyo, Japan).
Statistical analysis. To compare the results from baseline to follow-up periods, Wilcoxon signed-rank test
was used. Statistical analyses were done using SPSS version 21.0.0.0 (IBM, Armonk, NY, USA) software. All stat-
ics were two-tailed and p-values less than 0.05 were considered to be significant.
Scientific Reports | (2021) 11:258 | https://doi.org/10.1038/s41598-020-79437-1 13
Vol.:(0123456789)www.nature.com/scientificreports/
Figure 9. The immunohistochemistry findings of each representative case of 5 mg/mL MNU group and 10 mg/
mL MNU group. (a) The normal immunohistochemistry of a control case. Rhodopsin staining and PNA
staining showed well-stained rod and cone cells (each percentage of the stained layer = 15.22% and 14.86%).
(b) The immunohistochemistry of a representative case with moderate outer degeneration in the 5 mg/mL
group. NeuN staining showed intact ganglion cells and the co-staining of photoreceptors. PKC-α staining
showed intact bipolar cells, and GFAP staining showed nearly normal muller cells. Rhodopsin staining showed
severely decreased rod cells, and PNA staining showed focal intact cone cells (each percentage of the stained
layer = 4.11% and 14.15%). RPE65 staining showed intact RPE and rare co-staining of photoreceptors. There was
no apoptotic cell in Tunnel staining. (c) The immunohistochemistry of a representative case with severe outer
degeneration in 10 mg/mL group. NeuN and PKC-α stainings showed intact ganglion cells and bipolar cells,
respectively. There was no co-staining of photoreceptors in NeuN staining. GFAP staining showed increased
staining, especially in the outer retina. Rhodopsin and PNA staining showed relatively rare stained lesions of rod
and cone cells (each percentage of the stained layer = 0% and 0%) with co-staining of RPE cells. RPE 65 staining
showed intact RPE cells and Tunnel staining showed no stained lesions. RPE retinal pigment epithelium, GCL
ganglion cell layer, IPL inner plexiform layer. Each percentage of the stained layers was evaluated by the stained
area/all layer area using ImageJ software (1.53a version, National Institutes of Health, Bethesda, MD, USA).
Scientific Reports | (2021) 11:258 | https://doi.org/10.1038/s41598-020-79437-1 14
Vol:.(1234567890)www.nature.com/scientificreports/
p-value between baseline and p-value between Week 2 and p-value between baseline
Baseline Week 2 Week 12 Week 2 Week 12 and Week 12
Mean implicit time of b wave
70.90 ± 15.34 88.21 ± 33.44 74.25 ± 25.68 0.260a 0.116a 0.241a
in the DA 0.01 (ms)
Mean amplitude of b wave in
71.24 ± 39.68 4.79 ± 6.59 3.86 ± 4.09 0.008a 0.917a 0.005a
the DA 0.01 (µV)
Mean implicit time of a wave in
16.61 ± 2.66 34.36 ± 22.01 27.09 ± 12.78 0.008a 0.293a 0.037a
In DA 10.0 (ms)
Mean implicit time of b wave
39.94 ± 4.42 71.11 ± 25.79 63.41 ± 19.83 0.008a 0.249a 0.007a
in In DA 10.0 (ms)
Mean amplitude of a wave in
54.62 ± 19.24 7.58 ± 7.53 4.69 ± 2.74 0.008a 0.917a 0.005a
the DA 10.0 (µV)
Mean amplitude of b wave in
102.89 ± 46.66 13.79 ± 20.94 4.36 ± 5.09 0.008a 0.116a 0.005a
the DA 10.0 (µV)
Mean implicit time of a wave in
12.83 ± 4.05 20.88 ± 4.33 28.76 ± 18.15 0.011a 0.345a 0.005a
LA 3.0 (ms)
Mean implicit time of b wave
65.89 ± 11.29 102.38 ± 24.70 85.38 ± 19.42 0.008a 0.249a 0.005a
in LA 3.0 (ms)
Mean amplitude of a wave in
24.89 ± 11.99 3.11 ± 4.22 1.49 ± 0.91 0.008a 0.917a 0.013a
LA 3.0 (µV)
Mean amplitude of b wave in
137.42 ± 68.11 16.65 ± 23.43 3.96 ± 3.64 0.021a 0.917a 0.017a
LA 3.0 (µV)
Mean amplitude of LA 3.0
107.14 ± 63.64 8.19 ± 14.56 4.08 ± 3.09 0.008a 0.917a 0.005a
flicker (µV)
Table 3. The ffERG findings of the 10 mg/mL MNU group (n = 13). DA dark adaptive, LA light adaptive.
a
Wilcoxon-signed ranked test.
Figure 10. Measurement of total retinal thickness, inner nuclear layer thickness, and outer retinal thickness.
Total retinal thickness, inner nuclear layer thickness, and outer retinal thickness were measured at 10 points
with 1 mm intervals on the visual streak. Magnified SD-OCT images are shown with a white or yellow dashed-
line box. Magnified SD-OCT images in yellow dashed-line boxes show estimated total retina thickness, inner
nuclear thickness, and outer retinal thickness. Magnified SD-OCT images in white dashed-line boxes show NFL,
GCL, IPL, INL, OPL, EZ, and PRE. NFL nerve fiber layer, GCL ganglion cell layer, IPL inner plexiform layer, INL
inner nuclear layer, OPL outer plexiform layer, EZ ellipsoid zone, RPE retinal pigment epithelium.
Scientific Reports | (2021) 11:258 | https://doi.org/10.1038/s41598-020-79437-1 15
Vol.:(0123456789)www.nature.com/scientificreports/
Sequence of antibody (primary/secondary) Dilution Industry Targeted cells or layers
(rod) Bipolar cells. Targeted protein kinase (PKC)-α is
Anti-PKC-α Primary 1:200 Invitrogen
abundant in retinal bipolar cells
Müller cells, astrocytes, and glical cells. Targeted GFAP
Anti-GFAP Primary 1:300 NOVUSBIO is a member of the class III intermediate filament protein
family abundant in astrocytes and glial cells
Retinal ganglion cells. Targeted NeuN is DNA-binding,
Anti-NeuN Primary 1:250 Merck
neuron-specific protein
Anti-PNA Primary 1:300 VECTOR Cone cells. Targeted S opsin exists in cone cells
Anti-rhodopsin Primary 1:200 Rockland Rod cells. Targeted retinal rhodopsin exists in rod cells
Anti-RPE65 Primary 1:200 Invitrogen RPE cells. RPE65 is a major protein of the RPE
Alexa Fluor 594-conjugated goat anti-mouse Secondary 1:300 Biogend Capture or detection of mouse IgG in ELISA
Table 4. Summary of immunohistochemistry for pig retinal degeneration model. PKC-α Protein kinase-α,
GFAP Glial fibrillary acidic protein, NeuN Neuron-specific nuclear protein, PNA peanut agglutin, RPE retinal
pigment epithelium, IgG Immunoglobulin G, ELISA Enzyme-linked immunosorbent assay.
Data availability
The datasets generated during and/or analyzed during the current study are available from the corresponding
authors on reasonable request.
Received: 8 June 2020; Accepted: 8 December 2020
References
1. Fariss, R. N., Li, Z. Y. & Milam, A. H. Abnormalities in rod photoreceptors, amacrine cells, and horizontal cells in human retinas
with retinitis pigmentosa. Am. J. Ophthalmol. 129, 215–223. https://doi.org/10.1016/s0002-9394(99)00401-8 (2000).
2. Milam, A. H., Li, Z. Y. & Fariss, R. N. Histopathology of the human retina in retinitis pigmentosa. Prog. Retin Eye Res. 17, 175–205
(1998).
3. Brandli, A., Luu, C. D., Guymer, R. H. & Ayton, L. N. Progress in the clinical development and utilization of vision prostheses: An
update. Eye Brain 8, 15–25. https://doi.org/10.2147/EB.S70822 (2016).
4. Rizzo, J. F. 3rd. Update on retinal prosthetic research: The Boston Retinal Implant Project. J. Neuroophthalmol. 31, 160–168. https
://doi.org/10.1097/WNO.0b013e31821eb79e (2011).
5. Chow, A. Y. et al. The artificial silicon retina microchip for the treatment of vision loss from retinitis pigmentosa. Arch. Ophthalmol.
122, 460–469. https://doi.org/10.1001/archopht.122.4.460 (2004).
6. Mathieson, K. et al. Photovoltaic retinal prosthesis with high pixel density. Nat. Photonics 6, 391–397. https://doi.org/10.1038/
nphoton.2012.104 (2012).
7. Flores, T. et al. Honeycomb-shaped electro-neural interface enables cellular-scale pixels in subretinal prosthesis. Sci. Rep. 9, 10657.
https://doi.org/10.1038/s41598-019-47082-y (2019).
8. Strettoi, E., Porciatti, V., Falsini, B., Pignatelli, V. & Rossi, C. Morphological and functional abnormalities in the inner retina of the
rd/rd mouse. J. Neurosci. 22, 5492–5504 (2002).
9. Gargini, C., Terzibasi, E., Mazzoni, F. & Strettoi, E. Retinal organization in the retinal degeneration 10 (rd10) mutant mouse: A
morphological and ERG study. J. Comp. Neurol. 500, 222–238. https://doi.org/10.1002/cne.21144 (2007).
10. Jones, B. W. & Marc, R. E. Retinal remodeling during retinal degeneration. Exp. Eye Res. 81, 123–137. https://doi.org/10.1016/j.
exer.2005.03.006 (2005).
11. Jones, B. W. et al. Retinal remodeling triggered by photoreceptor degenerations. J. Comp. Neurol. 464, 1–16. https: //doi.org/10.1002/
cne.10703(2003).
12. Ross, J. W. et al. Generation of an inbred miniature pig model of retinitis pigmentosa. Investig. Ophthalmol. Vis. Sci. 53, 501–507.
https://doi.org/10.1167/iovs.11-8784 (2012).
13. Scott, P. A. et al. Progression of Pro23His retinopathy in a miniature swine model of retinitis pigmentosa. Transl. Vis. Sci. Technol.
6, 4. https://doi.org/10.1167/tvst.6.2.4 (2017).
14. Nagar, S., Krishnamoorthy, V., Cherukuri, P., Jain, V. & Dhingra, N. K. Early remodeling in an inducible animal model of retinal
degeneration. Neuroscience 160, 517–529. https://doi.org/10.1016/j.neuroscience.2009.02.056 (2009).
15. Scott, P. A., Kaplan, H. J. & Sandell, J. H. Anatomical evidence of photoreceptor degeneration induced by iodoacetic acid in the
porcine eye. Exp. Eye Res. 93, 513–527. https://doi.org/10.1016/j.exer.2011.06.017 (2011).
16. Yoshizawa, K. et al. Caspase-3 inhibitor rescues N-methyl-N-nitrosourea-induced retinal degeneration in Sprague–Dawley rats.
Exp. Eye Res. 71, 629–635. https://doi.org/10.1006/exer.2000.0921 (2000).
17. Tsubura, A., Yoshizawa, K., Kuwata, M. & Uehara, N. Animal models for retinitis pigmentosa induced by MNU; disease progres-
sion, mechanisms and therapeutic trials. Histol. Histopathol. 25, 933–944. https://doi.org/10.14670/HH-25.933 (2010).
18. Tsubura, A., Yoshizawa, K., Kiuchi, K. & Moriguchi, K. N-Methyl-N-nitrosourea-induced retinal degeneration in animals. Acta
Histochem. Cytochem. 36, 263–270. https://doi.org/10.1267/ahc.36.263 (2003).
19. Noel, J. et al. Iodoacetic acid, but not sodium iodate, creates an inducible swine model of photoreceptor damage. Exp. Eye Res. 97,
137–147. https://doi.org/10.1016/j.exer.2011.12.018 (2012).
20. Schreiber, D., Janisch, W., Warzok, R. & Tausch, H. Induction of brain and spinal cord tumors in rabbits with N-methyl-N-nitro-
sourea. Z Gesamte Exp. Med. 150, 76–86 (1969).
21. Webster, S. H., Stohlman, E. F. & Highman, B. The toxicology of potassium and sodium iodates. 3. Acute and subacute oral toxicity
of potassium iodate in dogs. Toxicol. Appl. Pharmacol. 8, 185–192. https://doi.org/10.1016/s0041-008x(66)80002-9 (1966).
22. Rosch, S. et al. Selective photoreceptor degeneration by intravitreal injection of N-methyl-N-nitrosourea. Investig. Ophthalmol.
Vis. Sci. 55, 1711–1723. https://doi.org/10.1167/iovs.13-13242 (2014).
23. Ahn, S. M. et al. Development of a post-vitrectomy injection of N-methyl-N-nitrosourea as a localized retinal degeneration rabbit
model. Exp. Neurobiol. 28, 62–73. https://doi.org/10.5607/en.2019.28.1.62 (2019).
Scientific Reports | (2021) 11:258 | https://doi.org/10.1038/s41598-020-79437-1 16
Vol:.(1234567890)www.nature.com/scientificreports/
24. Ahn, S. M. et al. Morphologic and electrophysiologic findings of retinal degeneration after intravitreal sodium iodate injection
following vitrectomy in canines. Sci. Rep. 10, 3588. https://doi.org/10.1038/s41598-020-60579-1 (2020).
25. Wang, W. et al. Swine cone and rod precursors arise sequentially and display sequential and transient integration and differentiation
potential following transplantation. Investig. Ophthalmol. Vis. Sci. 55, 301–309. https://doi.org/10.1167/iovs.13-12600 (2014).
26. Sorensen, N. F. et al. The effect of subretinal viscoelastics on the porcine retinal function. Graefes Arch. Clin. Exp. Ophthalmol. 250,
79–86. https://doi.org/10.1007/s00417-011-1782-x (2012).
27. Rootman, J. Vascular system of the optic nerve head and retina in the pig. Br. J. Ophthalmol. 55, 808–819. https://doi.org/10.1136/
bjo.55.12.808 (1971).
28. Bloodworth, J. M. Jr., Gutgesell, H. P. Jr. & Engerman, R. L. Retinal vasculature of the pig. Light and electron microscope studies.
Exp. Eye Res. 4, 174–178. https://doi.org/10.1016/s0014-4835(65)80029-x (1965).
29. Hendrickson, A. & Hicks, D. Distribution and density of medium- and short-wavelength selective cones in the domestic pig retina.
Exp. Eye Res. 74, 435–444. https://doi.org/10.1006/exer.2002.1181 (2002).
30. Chandler, M. J., Smith, P. J., Samuelson, D. A. & MacKay, E. O. Photoreceptor density of the domestic pig retina. Vet. Ophthalmol.
2, 179–184. https://doi.org/10.1046/j.1463-5224.1999.00077.x (1999).
31. Mones, J. et al. A swine model of selective geographic atrophy of outer retinal layers mimicking atrophic AMD: A phase I escalating
dose of subretinal sodium iodate. Investig. Ophthalmol. Vis. Sci. 57, 3974–3983. https://doi.org/10.1167/iovs.16-19355 (2016).
32. Hainsworth, D. P. et al. Retinal capillary basement membrane thickening in a porcine model of diabetes mellitus. Comp. Med. 52,
523–529 (2002).
33. Kleinwort, K. J. H. et al. Retinopathy with central oedema in an INS (C94Y) transgenic pig model of long-term diabetes. Diabe‑
tologia 60, 1541–1549. https://doi.org/10.1007/s00125-017-4290-7 (2017).
34. Ruiz-Ederra, J. et al. The pig eye as a novel model of glaucoma. Exp. Eye Res. 81, 561–569. https: //doi.org/10.1016/j.exer.2005.03.014
(2005).
35. Jeon, C. J., Strettoi, E. & Masland, R. H. The major cell populations of the mouse retina. J. Neurosci. 18, 8936–8946 (1998).
36. Lutty, G. A., Bhutto, I. & McLeod, D. S. In Ocular Blood Flow (eds Leopold, S. & Jeffrey, K.) 3–21 (Springer, Berlin, 2012).
37. Lossi, L., D’Angelo, L., De Girolamo, P. & Merighi, A. Anatomical features for an adequate choice of experimental animal model
in biomedicine: II. Small laboratory rodents, rabbit, and pig. Ann. Anat. 204, 11–28. https://doi.org/10.1016/j.aanat.2015.10.002
(2016).
38. Lim, R. R. et al. Young Ossabaw pigs fed a western diet exhibit early signs of diabetic retinopathy. Investig. Ophthalmol. Vis. Sci.
59, 2325–2338. https://doi.org/10.1167/iovs.17-23616 (2018).
39. Hein, T. W., Potts, L. B., Xu, W., Yuen, J. Z. & Kuo, L. Temporal development of retinal arteriolar endothelial dysfunction in porcine
type 1 diabetes. Investig. Ophthalmol. Vis. Sci. 53, 7943–7949. https://doi.org/10.1167/iovs.12-11005 (2012).
40. Parkin, D. The United Kingdom chemical database service. J. Chem. Inf. Comput. Sci. 36, 746–749 (1996).
41. National Institute of Environmental Health Sciences. volumes (National Institute of Environmental Health Sciences, Durham,
N.C., 2000).
42. Hazardous substances data bank (HSDB). Choice: Current Reviews for Academic Libraries 42, 1848–1848 (2005).
43. Zulliger, R., Lecaude, S., Eigeldinger-Berthou, S., Wolf-Schnurrbusch, U. E. & Enzmann, V. Caspase-3-independent photoreceptor
degeneration by N-methyl-N-nitrosourea (MNU) induces morphological and functional changes in the mouse retina. Graefes
Arch. Clin. Exp. Ophthalmol. 249, 859–869. https://doi.org/10.1007/s00417-010-1584-6 (2011).
44. Kitamoto, S. et al. Optimal dose selection of N-methyl-N-nitrosourea for the rat comet assay to evaluate DNA damage in
organs with different susceptibility to cytotoxicity. Mutat. Res. Genet. Toxicol. Environ. Mutagen 786–788, 129–136. https://doi.
org/10.1016/j.mrgentox.2015.05.001 (2015).
45. Chapman, K. E., Hoffmann, G. R., Doak, S. H. & Jenkins, G. J. S. Investigation of J-shaped dose-responses induced by exposure
to the alkylating agent N-methyl-N-nitrosourea. Mutat. Res. 819, 38–46. https://doi.org/10.1016/j.mrgentox.2017.05.002 (2017).
46. Oka, T., Nakajima, T., Tamada, Y., Shearer, T. R. & Azuma, M. Contribution of calpains to photoreceptor cell death in N-methyl-
N-nitrosourea-treated rats. Exp. Neurol. 204, 39–48. https://doi.org/10.1016/j.expneurol.2006.09.011 (2007).
47. Kaneko, H., Nishiguchi, K. M., Nakamura, M., Kachi, S. & Terasaki, H. Characteristics of bone marrow-derived microglia in the
normal and injured retina. Investig. Ophthalmol. Vis. Sci. 49, 4162–4168. https://doi.org/10.1167/iovs.08-1738 (2008).
48. Yoshizawa, K. et al. Mechanisms of photoreceptor cell apoptosis induced by N-methyl-N-nitrosourea in Sprague–Dawley rats.
Lab. Investig. J. Tech. Methods Pathol. 79, 1359–1367 (1999).
49. McCulloch, D. L. et al. ISCEV Standard for full-field clinical electroretinography (2015 update). Doc. Ophthalmol. 130, 1–12. https
://doi.org/10.1007/s10633-014-9473-7 (2015).
50. Robson, A. G. et al. ISCEV guide to visual electrodiagnostic procedures. Doc. Ophthalmol. 136, 1–26. https://doi.org/10.1007/
s10633-017-9621-y (2018).
51. Hood, D. C. et al. ISCEV standard for clinical multifocal electroretinography (mfERG) (2011 edition). Doc. Ophthalmol. 124, 1–13.
https://doi.org/10.1007/s10633-011-9296-8 (2012).
52. Xie, W. et al. Correlation of spectral domain optical coherence tomography with histology and electron microscopy in the porcine
retina. Exp. Eye Res. 177, 181–190. https://doi.org/10.1016/j.exer.2018.08.003 (2018).
Acknowledgements
This research was supported in part by the Bio & Medical Technology Development Program of the NRF
funded in part by the Korean government, the Ministry of Science and ICT (MSIP) (NRF-2017M3A9E2056458,
2017M3A9E2056460, and 2020R1A2C1005729), and by Korea University Guro Hospital (O1905421 and
O2001171).
Author contributions
S.W.K. and Y.S.G. designed and directed the project. K.E.C. and V.T.Q.A. collected the data. K.E.C., S.C., J.A.
and C.Y. analyzed images independently. K.E.C. and J.T.K. conceived and designed statistical analysis. K.E.C.
wrote the main manuscript. Y.S.G. and S.W.K. revised the manuscript. All authors discussed the results and
contributed to the final manuscript.
Competing interests
The authors declare no competing interests.
Additional information
Supplementary Information The online version contains supplementary material available at https://doi.
org/10.1038/s41598-020-79437-1.
Scientific Reports | (2021) 11:258 | https://doi.org/10.1038/s41598-020-79437-1 17
Vol.:(0123456789)You can also read