Engineering Calcium Signaling of Astrocytes for Neural-Molecular Computing Logic Gates
←
→
Page content transcription
If your browser does not render page correctly, please read the page content below
Engineering Calcium Signaling of Astrocytes for
                                            Neural-Molecular Computing Logic Gates
                                            Michael Taynnan Barros1,2,* , Phuong Doan2 , Meenakshisundaram Kandhavelu2 ,
                                            Brendan Jennings3 , and Sasitharan Balasubramaniam3
                                            1 School   of Computer Science and Electronic Engineering, University of Essex, Colchester, UK.
                                            2 BioMediTech,   Faculty of Medicine and Health Technology, Tampere University, P.O.Box 553, 33101 Tampere,
                                            Finland.
                                            3 Telecommunication Software & Systems Group (TSSG), Waterford Institute of Technology (WIT), Ireland
arXiv:2007.06646v1 [q-bio.CB] 13 Jul 2020

                                            * m.barros@essex.ac.uk

                                            ABSTRACT

                                            The aim of molecular computing is to develop analogue and digital logic systems that are established from chemical interactions
                                            of molecules. Prokaryotic cells, and in particular bacteria, have received tremendous attention for molecular computing, mainly
                                            due to the ease of programming new functions through genetic circuits that are embedded into their DNA plasmids. This paper
                                            proposes the use of Eukaryotic cells, namely astrocytes, to develop logic gates. The logic gates are achieved by manipulating
                                            the threshold of Ca2+ ion flows between the cells, based on the input signals. Through wet-lab experiments that engineer the
                                            astrocytes cells with pcDNA3.1-hGPR17 genes, we show that both AND and OR gates can be implemented by controlling
                                            Ca2+ signals that flow through the population. A reinforced learning platform is also presented in the paper to optimize two
                                            main parameters, which are the Ca2+ activation threshold and time slot of input signals Tb into the gate. This design platform
                                            caters for any size and connectivity of the cell population, by taking into consideration the delay and noise produced from the
                                            signalling between the cells, in order to fine-tune the activation threshold and input signal time slot parameters. To validate the
                                            effectiveness of the reinforced learning platform, a Ca2+ Signaling-based Molecular Communications Simulator was used to
                                            simulate the signalling between the astrocyte cells. The results from the simulation showed that an optimum value for both the
                                            Ca2+ activation threshold and time slot of input signals Tb is required to achieve optimal computation accuracy, where up to
                                            90% accuracy for both the AND and OR gates can be achieved with the right combination of values. The reinforced learning
                                            platform for the engineered astrocytes to create digital logic gates can be used for future Neural-Molecular Computing chip,
                                            which can revolutionize brain implants that are constructed from engineered biological cells.

                                            Introduction
                                            Synthetic biology has facilitated capabilities to engineer biological cells that can lead to novel applications in medicine as
                                            well as in biotechnology1–3 . This engineering process is realized through the synthesis of genetic circuits that results in new
                                            cell functions, and an example is controlling cellular intra and inter-communications. Numerous digital-like devices have
                                            emerged from synthetic biology, and this includes toggle switches4 , oscillators5 , as well as Boolean logic gates6 . Boolean
                                            logic gates, in particular, has received considerable attention due to their ability to be assembled into logic circuits that can
                                            perform computation, which can be used to reconfigure cellular operations for therapeutic purposes, or diagnostic sensing of
                                            multiple enzymes that are indicators of diseases7, 89 . Examples of boolean logic gates that have been engineered from cells
                                            includes AND10 , OR11 , NOR12 , and XOR13 gates. An essential function in synthetic logic circuits is communication, and
                                            this can be short-range between different genes within a circuit, to communication between populations of cells that represent
                                            individual gates. Therefore, engineering molecular communication between the cells through engineered genetic circuits can
                                            not only produce logic gates with multiple computational functions but can enable reconfigurability of the logic operations14–17 .
                                            Molecular communication is an emerging paradigm that aims to characterize as well as engineer biological communication
                                            systems using communication engineering theory in conjunction with synthetic biology18–21 , and one example is calcium-based
                                            molecular communication system. Synthetic circuits to control molecular communications use ligand-responsive transgene
                                            systems that can respond to a particular stimulus2211, 23 , and this can enable reconfiguration when specific signalling molecules
                                            activate the circuit.
                                                In this paper we attempt to create Boolean logic gates from eukaryotic cells, namely astrocytes (Fig. 1 (a-c)). Astrocytes are
                                            glial cells that are found in the brain tissue and have a particular function in supporting stability for the neurons. This stability
                                            comes in the form of structural support for neurons, providing nutrients and oxygen supply, pathogen destruction, and removal
                                            of dead cells. To create logic gates from astrocytes (Fig. 1 (d)), our approach is based on engineering the Ca2+ signalling (Fig.
a) Neural-Molecular Computing on a Chip                    b) Logic gate(s) in population of astrocytes

         Digital Logic Gates

         Chip

                    Cell cultures

      c) Astrocytes Ca2+ Signalling                              d) Gap Junction
                                                                           Cytoplasm                       Cell&
                                                                                                         Membranes&

                                Ca2+Cytosol                                                   Calcium&
                                                                                               Influx/&
                                     Endoplasmic                                                Efflux&
                               σ1     reticulum
                                    σ2
                                         σ3
                                                                            Intercellular&
                                                                            8ght&junc8on&                 Cytoplasm
                                                                               (~2nm)&

       e) AND gate structure                                        f) OR gate structure
         Input distribution                        Table Truth           Input distribution                           Table Truth

Figure 1. Neural-Molecular computing on a Chip (a), is composed of digital logic gates that are implemented from
engineered astrocytes cells (b). The input 1 and 2 astrocyte cells are the incoming Ca2+ signals into the gate, which is
computed to produce an output signal. The digital gate behaviours are achieved by engineered the threshold of the intracellular
Ca2+ signalling process (c) and the gap junctions that facilitate cell-cell Ca2+ diffusion (d). Simulation illustration of Ca2+
signals through cells that represent and AND gate (e) as well as OR gate (f).

                                                                                                                                    2/15
1 (a) (b)) between the cells, and this is achieved by using synthetic genes that will set the threshold value for the sensitivity of
the intracellular Ca2+ signalling. Ca2+ signalling is a short-range inter-cellular communication process that uses ions as the
signalling molecules between the gap junction connection of the cells. In24, 25 , an engineered Ca2+ signalling-based molecular
communication system was analyzed to understand the short-range communication properties, and in particular, the behaviour
of ion propagation throughput within a tissue. The logic gate structure, depicted in Fig. 1 (f), includes three populations of
cells that each corresponds to a link with a logic gate (2 input links and 1 output link). The two input links of Ca2+ signalling
populations represents the input into the digital logic gates, which are then transmitted to the output link population with the
engineered threshold to perform the logic gate operation. The threshold control of the output link population will determine if it
is either an AND or OR gate. The logic circuits built from astrocytes will lead to a new breed of Neural-Molecular Computing
on a Chip, as illustrated in Fig. 1 (e), and will transform implantable brain chips which to date have predominately been
developed from non-biological materials. However, to fully realize the logic circuits built from astrocytes, and rely on Ca2+
signalling as part of its operation, there are many challenges due to the stochastic behaviour of the signalling nature of the cell,
and this includes:

   1. Impact from self-regulating spontaneous signalling of Ca2+ ions: The stochastic nature of Ca2+ signalling leads to
      unpredictable stimulation and propagation of Ca2+ ions that result in noise that can affect the reliability of the logic
      operation.

   2. Inter-cellular Ca2+ propagation delay: Inter-cellular signalling is prolonged compared to conventional CMOS bus lines
      found in digital logic gates. This property can lead to issues in synchronizing the communication between the cells
      during the logic operation. Therefore, modelling and characterizing the astrocyte network is critical to ensure the optimal
      population of astrocytes that will minimize false positive or negative results from the logic gate operation.

   3. Impact from uncertainty in the astrocyte cells network structure: The unknown network topology of the astrocyte cells
      can lead to different delays that can impact the logic operation reliability.

    To address the challenges described above, we developed a reinforced-learning platform that will be used to assist the
design of the logic gate from the astrocyte cells. The reinforced-learning algorithm analyses the molecular communication of
Ca2+ ions within the astrocyte network, and through a state value function learning process, adapt parameters that determine
the threshold level needed to be engineered in the cells to encode active states of Ca2+ ions in the output link. Fig. 1 (g,h)
depict the gate function for a small population of astrocytes, where we show through theoretical simulations the processing of
Ca2+ signals in the output link population, and compared it to the truth table of the respective logic gate. In the following, we
present a summary of the paper’s contribution:

    • Eukaryote cell-based synthetic logic gate: In contrast to previous approaches that use prokaryotic cells for developing
      the gates, we propose a model for developing AND and OR logic gates from astrocyte cells.

    • In-vitro experimentation: Experiments performed using hGPR-17 synthetic gene expression in astrocytes as well as
      two sets of chemical compounds (MDL29, 951 and T 0510.3657) that are used to simulate incoming Ca2+ signal inputs.
      The experiment conducted in a petri dish demonstrates an AND and OR gate operations based on threshold control of the
      Ca2+ signalling.

    • Reinforced learning platform for logic gates design: The reinforced learning algorithm uses a closed-loop feedback
      system to fine-tune the astrocyte cell-cell communication parameters including the activation Ca2+ threshold and
      communication period, that will ensure the engineered population of logic gate cells can be integrated into tissue and
      operate reliably. This will enable the platform to be used for future practical applications that require engineered
      astrocytes to perform logic operations. The adaptive process tunes the Ca2+ signalling activation threshold to determine
      the optimal control of ions flow that will result in reliable gate operation.

    • Accuracy and delay analysis: Due to the fluctuation behaviour of cell-cell communication with inter-cellular Ca2+
      signalling, we theoretically analyzed the accuracy of the logic operation, as well as the delay of input flow to the logic
      gate using the static timing analysis from conventional digital logic circuit theory.

Methodology
Our methodology involves both wet-lab experiments as well as theoretical simulations of the astrocyte-based logic gates.
Engineering logic operations in a network of astrocyte cells must consider the cell-cell Ca2+ -signalling and its impact on the
reliability of the computing functioning. This includes considering their internal signalling pathways and its relation to the

                                                                                                                               3/15
engineered threshold, gap junctions probabilities for Ca2+ ion propagation, as well as the delay of signals that is dependent on
the network connectivity. The random connectivity of the astrocyte cells network will lead to varying noise, delay and signal
fading, which impacts on the reliability performance of the logic gates. In order to ensure a high reliability of the logic operation,
we use a Reinforced Learning platform illustrated in Fig. 2, which will take in culture of astrocyte and based on end-to-end
Ca2+ signaling through the culture, will fine tune two parameters which are the the optimal Ca2+ activation threshold to be
engineered into the cells and the optimal transmission period (Tb ). In this paper, we used a Ca2+ Signaling-based Molecular
Communications simulator (bottom layer of Fig. 2) to simulate the astrocyte culture. The reinforced learning platform utilizes
functions, which are designed to adapt system state variables of the inputs by recursively averaging the configuration parameters,
and this will result in the optimal Ca2+ activation threshold and the transmission period (Tb ).
    This section will present the Reinforced Learning platform that includes the the Ca2+ Signaling-based Molecular Commu-
nications simulator, as well as the methodology for the wet lab experiments.

Synthetic Logic Gate Design Platform using Reinforced Learning
Reinforced Learning Platform: The core parts of our proposed platform illustrated in Fig. 2 are the Kernel and the Output.
While the Kernel is responsible for setting the learning rules from the state value functions, the output implements the learning
rules that set the Ca2+ signalling activation threshold values for the AND or the OR gates. The framework converges the
Ca2+ signalling activation threshold as well as Tb values based on input data of the astrocyte network to the Kernel (while this
will come from the culture directly, in our case we are using the simulator to produce the input data). The Kernel is the most
complex part, whereby the processed cellular population input data undergoes the training and the reinforced learning process.
For simplicity, we used the cellular population input values of the framework as training features directly. As illustrated in Fig.
2 the simulator of the Ca2+ signalling molecular communications in the astrocytes population will refine and converge the
values of the optimal Ca2+ activation threshold and Tb , by minimizing the noise and delay as signals are transmitted through
the population, which makes the design agnostic to any network topology of astrocytes. Once the optimal Ca2+ activation
threshold and Tb values are identified for the specific astrocyte population, a synthetic circuit is designed to stimulate Ca2+
signal in the output link once the flow of ions from the two input links reaches the threshold.
    Ca2+ Signalling-based Molecular Communications Model: The astrocyte cell communication is characterized by both the
intracellular as well as the intercellular signalling processes, and the simulator for this signaling process shown in the bottom
layer of Fig. 2) is described as follows: The intracellular Ca2+ signalling (Fig. 1 (b)) is based on the classical Goldbeter et al
model26 . The model is based on stimulating the IP3 protein, resulting in Ca2+ signals generation and release (Stimulation).
The released IP3 indirectly controls the influx of Ca2+ ions to the endoplasmic reticulum and its storage in the cytosolic area
(Storage). Besides the stimulation process, certain cellular components, such as the endoplasmic reticulum and mitochondria,
are also capable of self-generating Ca2+ ions (Amplification). Finally, the exchange of Ca2+ ions is conducted in two ways:
cell-cell communication (Diffusion) and aleatory exchange of Ca2+ to the extracellular space (Release). In inter-cellular
Ca2+ signalling, ions are propagated through the cellular tissues via a physical gate that connects the cytosolic areas of two
neighbouring cells, and these gates are called Gap Junctions. Fig.1 (a) shows how the gap junctions connect two cytosols. The
gap junctions are composed of two connexons, one in each connecting cell, which is formed by six proteins called connexins.
Inter-cellular diffusion only occurs when both connexons open at the same time. The voltage-sensitive gap junctions are
assumed to have two states of conductance for each connexin: an open state with high conductance and a closed state with low
conductance as illustrated in Fig.1 (c, d). For astrocytes, the gap junctions are closed around 18% of the time on average, which
probabilistically dictates the cell-cell propagation of Ca2+ ions that can subsequently interfere with the logic gate operation25 .
The theoretical modelling of the inter/intra Ca2+ signalling with the gap junction diffusion of astrocytes population is presented
in the Supplementary Material.

Wet-lab experimental set-up
The in-vitro experiments aims to determine the sensitivity of the astrocyte cell culture to the induced Ca2+ signals. This will
determine the validity of the engineered threshold that differentiates between the AND and OR gates. Specifically, we targeted
a population of astrocyte cells that have their thresholds controlled by the hGPR-17 gene and Ca2+ signals induced by either the
MDL29,951 or T0510.3657 chemical compounds. The two gates were programmed to induce fluorescent light with increasing
Ca2+ concentration values as the concentration of ions crosses the threshold to indicate a successful logic operation. The Ca2+
signal output of one astrocyte population is the input to a neighbouring population, and this intercellular signalling will be
defined by threshold value from the reinforced learning platform. This intercellular signalling activation process can be further
explored in future works by having a unique threshold setup for different cell types. Our experimental design is based on the
approach in27 .
    Cell Culture and hGPR-17 gene expression. Human astrocytoma cells, 1321N1, were cultured in Dulbecco’s modified
Eagle’s medium with L-glutamine (DMEM-high glucose) (Sigma-Aldrich) supplemented with 10% (v/v) fetal bovine serum
(FBS) (Sigma-Aldrich), penicillin and streptomycin (100U/ml) (Sigma-Aldrich), sodium pyruvate 1mM (Sigma-Aldrich),

                                                                                                                                4/15
mulation-based Evaluation Platform
Logic Operation Design Platform
Data Collection Framework Output
State Value Outputs
Framework Kernel
(T b, Threshold)
Logic Operation Design
Training
Reinforced
Learning Synthetic Gene Identification
Simulation Platform
Reprogramming
Outputs
Reprogramming • Noise
Input processing
Input 1 Threshold •OutputDelay
Input processing
Threshold Output
• Ca2+ Signal
Input 1
Gap s3 k f (E a - Ca )
Stimulation Amplification Storage Diffusion
Junctions
Gap s3 sa2 )
k f (E a - C Model of
Stimulation Amplification Storage Diffusions1 s0
Junctions
s2 s1 s1 Release
Known
Input 2 s0
s1
Release
Network
Input 2
Topology Controlled
Noise Single Astrocyte Model Simulated
Noise
Inferenced
Figure 2. Astrocyte-based logic gate design platform using reinforced learning. The platform is a feedback system for
reinforced learning using state value functions that fine tunes the Ca2+ activation threshold as well as time slot for input signals
Tb . The Kernel of the platform considers information such as the delay of signals between cells in the population, noise,
transmission period, required logic operation, input signal flow concentration of Ca2+ ions, which are fed into the data
collection that is used for training. In the output of the platform, synthetic gene transcription is identified for the logic operation
based on the defined values of the cellular signalling threshold the is tuned by the kernel state value functions. To validate the
platform, a Ca2+ signalling-based molecular communications simulator is integrated. The simulator includes models for
individual cell’s intra as well as intercellular signalling for a defined toplogy. The output population will produce Ca2+ signals
based on the logic computation. In blue are the controlling blocks that define the threshold for the logic gate operation. The
blocks within the ”Input Processing” are stages of the Ca2+ signalling process in each astrocyte cell.
5/15
and amphotericin B 250µg/ml (Sigma-Aldrich) and grown at 37 ◦ C in CO2 incubator. Cells were seeded in a 25 cm2 , T-25
flask (Fennokauppa) and after 24 hours of incubation, hGPR17 plasmid was transfected with Ca2+ phosphate transfection kit
(Sigma-Aldrich). The hGPR17 gene was cloned into pcDNA3.1 plasmid, which is a mammalian expression vector28 . 3µg of
pcDNA3.1-hGPR17 plasmid was used to transfect 1321N1. Post transfection of the plasmid, the media was removed, and fresh
DMEM containing 10% FBS was replaced. For the Ca2+ time-lapse analysis MMK1 cells, GBM cells derived from patient
samples which overexpressed GPR17 were plated in 96-well plates at an initial density of 1×10⁴ cells per well. The cells were
incubated overnight to reach around 70% of confluence. To measure Ca2+ level change over time, the cells were incubated with
5 µM Fura-2 AM (Sigma-Aldrich, St. Louis, MO, USA) for 30 min at 37 ◦ C. The cells were washed with PBS twice before
adding 50 µL complete medium. Then, 50 µl of PBS containing 25 µM concentration of the MDL29,951 or T0510.3657 were
added to the wells, and Ca2+ changes were measured immediately for 1.5 hours.
    Quantification of cellular Ca2+ signals. The level of cellular Ca2+ was quantified using the Fura2-AM Assay kit (Sigma-
Aldrich). 24 hours of post-transfection, transient cell line was collected on 96-well plates at a concentration of 1 ×10⁵ cells/well.
Cells were incubated with increasing concentrations of signalling molecules, MDL 29951 (Abcam), and T0510.3657 (AKos
Consulting & Solutions Deutschland GmbH) at 37o C for 2 hours. 10µM Fura 2-AM was added to the cells and then assayed
for Ca2+ accumulation after the 30 minutes of incubation at 37o C, following the manufacturer’s instructions. The difference
between the fluorescence level of the control and signalling molecule treated samples were measured using the plate reader
(Ascent). In the experimental set up following conditions were used: 1) Cells without the transfection of plasmid, 2) Cells with
the transfection of plasmid and without the compound incubation, 3) Cells without the transfection of plasmid and with the
incubation of 50 µM concentration of compounds, 4.a) Cells with the transfection of plasmid and with the incubation of 25 µM
of compound and 4.b) 50µM of the concentration of compounds. To quantify the changes in Ca2+ level, the kit protocol, as
given by the vendor, was used. Technical and biological repeats were used to measure fluorescence and were averaged. The
fluorescent signal was measured using a microplate reader (Spark R , Tecan) at two dual excitation/emission wavelengths of
340/510 nm and 380/310 nm.

Results
Wet Lab Experiments
Fig. 3 presents the wet lab experiments to demonstrate the AND and OR gates that are engineered from the astrocyte cells.
Fig. 3 (a) illustrates the engineered plasmid with the gene pcDNA3.1-hGPR17 insertions that are used to amplify the Ca2+
signals for the two gates. The OR gate is a combination of T 0510.3657 compound added to the gene pcDNA3.1-hGPR17,
while the AND gate is a combination of MDL29, 951 with the gene pcDNA3.1-hGPR17. The compounds are used to simulate
the incoming Ca2+ signals from input 1 and 2, where 25µM will represent only a single 1 input, and the 50µM will represent
two 1 inputs. In order to evaluate the effectiveness of the logic operation, Fig. 3 (b) illustrates the different quantity of Ca2+
produced with respect to the different amounts of compounds added. The cases of non-engineered cells with no compounds (no
incoming Ca2+ signal inputs), only engineered cells, and non-engineered cells with only compounds produces a small quantity
of Ca2+ signals. However, the combinations of engineered cells with compounds (both 25 and 50 µM) presents high levels
of Ca2+ signals for both the AND and OR gates. The threshold determines if a 1 output will be produced depending on the
type of gates as well as input. In the case of 25µM, which is a single 1 input, the AND gate will produce Ca2+ signals that
don’t reach the threshold, while in the case of the OR gate the output will surpass the threshold. However, in the case of 50µM,
where there are two input 1, we can observe that the quantity of Ca2+ ions produced are above the threshold. Fig. 3 (c) presents
the changes in overall stability and fluctuations of the Ca2+ signals with respect to time and shows that the AND gate will
have a more stable production of the signals compared to an OR gate that will result in signals that fade after a certain period.
The fluctuation of Ca2+ signals is found throughout all configurations and logic operations, producing an average variation of
2.7% of internal signalling capacity, with a peak at pcDNA3.1-hGPR17 with compounds of 25µM with 6% fluctuation for both
compounds. The regulatory Ca2+ intracellular mechanisms associated with the cell-cell communication can produce random
fluctuations. Fig. 3 (d) presents the fluorescent output of the cells based on the input signals (xx/y refers to the x being the input
and y being the output). The result shows that the 25 µM produces a certain level of output, but this is lower than in the case of
50 µM when the two input 1 are applied to the gate. Finally, Fig. 3 (e) presents the response of the logic gates with random
signals as inputs with concentrations below 1µM and with 1µM. The random signals appear to cause no effects in the logic
gates operations.

Simulation Experiments
Fig. 4 presents results on the logic computing simulation accuracy for the astrocyte cells AND as well as OR gates. The
accuracy analysis of a small population of astrocytes AND logic gate is shown in the top row of Fig 4. The aim of our
analyses is to understand the impact that variation of Ca2+ activation threshold and the Tb of input signals will have on the
gate’s computing reliability under low noise effects. Fig 4(a) shows directly increasing Tb benefits the accuracy, giving peak

                                                                                                                                6/15
Figure 3. Wet lab experiments of the logic gate input control for an astrocyte population in-vitro. (a) The pcDNA3.1-hGPR17
plasmid used to engineer the threshold of the astrocytes in the experiments. In (b) the percentage of intracellular Ca2+
concentration over five in-vitro setups: no pcDNA3.1-hGPR17 (no gene), pcDNA3.1-hGPR17 (genes only), no
pcDNA3.1-hGPR17 with compounds (compounds only), pcDNA3.1-hGPR17 with compounds at 25µM (genes and
compounds) and pcDNA3.1-hGPR17 with compounds at 50µM (genes and compounds). Based on these results, we observe
the levels of fluctuation of the Ca2+ signals that affect the performance of the logic operations. In (c) we show the intracellular
Ca2+ variation over time for both compounds. In (d) we show the increasing Ca2+ concentration observed by the fluorescent
light effect of in-vitro astrocyte cultures with compound concentrations of 25µM and 50µM for the AND gate with the
MDL29, 951 compound and the OR gate with the T 0510.3657. Finally, in (e), we show the response of the logic gates with
random signals as inputs, to demonstrate that low Ca2+ signals will not produce sufficient signals to activate the gate response.
performance around 90% for the AND logic operation. This is due to the impact of longer duration of Ca2+ signals that can
exist in the cell population, as shown in Fig. 3 (c), especially for AND gate, resulting in improved results when higher values
of Tb are used. Ca2+ signalling fluctuations are represented as the statistical errors of the temporal series shown in Fig 4 (b),
which a simple regression curve shows have an inverse relationship with the Tb . Fig 4 (c) shows the accuracy, false positive and
false negative results for variations in the threshold values for a low level of Tb . As shown in the results, the accuracy is not
affected by the threshold variation for low Tb , and stabilizes around 55 − 60%, while false positive has an average of 8% and
false negatives has an average of 16%. Low values of Tb results in high fluctuation, as can be seen in Fig 4 (b), which even
with different thresholds does not affect the logic operation accuracy. This is contrary to Fig 4 (c) and (d), which presents the
accuracy, false positive and false negative results for variations in the threshold values for high values of Tb . An optimal point is
observed when the threshold value is around 30% of the intracellular signalling capacity, with accuracy at 80%, false-positive at
15% and false-negative at 2%. Higher thresholds values are likely due to the interference error in the output due to the increase
in false negatives effects that are caused by Ca2+ concentration fluctuations. The data from all the results presented in Fig 4 (a)
(b) (c) and (d) that was input into the reinforced learning algorithm, resulted in the optimum value of Tb = 30s and optimal
Ca2+ activation threshold of 0.3µM, which resulted in an accuracy of 90% with a minimum percentage of false positives and
false negatives.
The accuracy analysis of a small population of astrocyte OR logic operation is presented in the bottom row of Fig. 4. The
results show that higher levels of fluctuations in Fig. 4 (e) and (f), does not inhibit the OR logic operation from reaching 95% of
peak accuracy. However, the high level of fluctuations impacts on the results in Fig. 4 (g) and (h), where higher false negatives
are found (average of 75% for Fig. 4 (g) and 41.4% for (h)). At the same time, the increase in the threshold values appears to
impact on the overall gate performance. Higher levels of fluctuations in low values of Tb s are responsible for this effect due
to the increase in the false negatives that results from high values of Tb . When this data is input into the reinforced learning
7/15a) 100 b) 0.8
Points
c) 100
False Positive
d) 100
0.7 Fitted Curve False Negative
80 Accuracy
80 80
0.6
60 0.5 60 60
False Positive
0.4 False Negative
40 Accuracy
0.3 40 40
20 0.2
20 20
0.1
0
5 10 15 20 25 30 40 50 0 0 0
5 10 15 20 25 0.1 0.2 0.3 0.4 0.5 0.1 0.2 0.3 0.4 0.5
e) 100
f) 0.8
g) 100
h) 100
Points False Positive
0.7 Fitted Curve False Negative
Accuracy
80 80 80
0.6
60 0.5
60 60 False Positive
0.4 False Negative
Accuracy
40 0.3 40 40
0.2
20 20
0.1 20
0 0
5 10 15 20 25 30 40 50 5 10 15 20 25 0 0
0.1 0.2 0.3 0.4 0.5 0.1 0.2 0.3 0.4 0.5
Figure 4. Accuracy analysis of a small astrocyte population with AND (top row) and OR (bottom rows) logic gate operation.
The accuracy of the AND (a) and OR (e) logic gate operation over the pulse period Tb . Fluctuation levels of Ca2+ versus the Tb
variation and the obtained regression model curve for AND (b) and OR (f) gates. Accuracy, false positive and false negative
results with respect to varying the threshold values for low values of Tb for AND (c) and OR (g) gates. Accuracy, false positive
and false negative results with respect to varying the threshold values for high values of Tb for AND (d) and OR (h) gates.
platform, the optimum value outputs are Tb = 50s, and optimal Ca2+ activation threshold of 0.1µM, and this results in an
accuracy of 98% with a minimum percentage of false positives and negatives.
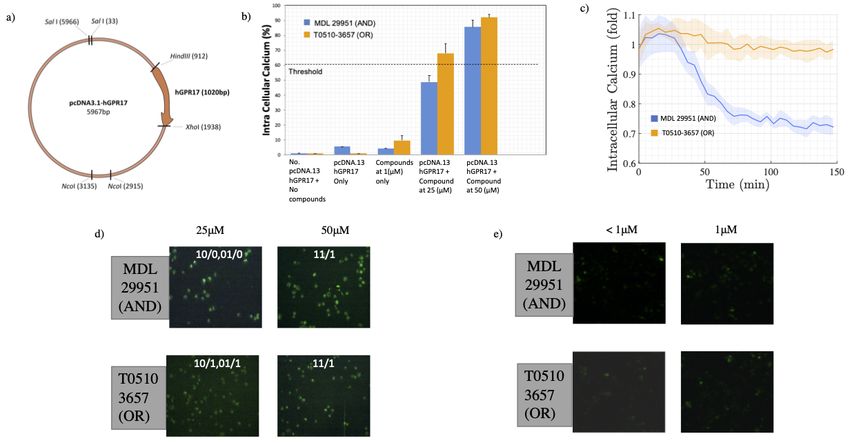
Our simulations also include the static timing analysis to determine the Ca2+ signal propagation delay through the astrocyte
population and its impact on the logic gate operation. The simulation considers the data from the wet lab experiments. Fig.
5 illustrates the topology of astrocytes population that is used for simulating the signal propagation through the output link.
As shown in the figure, the topology is based on varying radius r of the astrocyte population for the input link. Fig. 5 (b)
presents the delay results for the non-engineered cell and shows that as the number of operations increase, this also increases
the delay with an increase in population radius r. Fig. 5 (c) presents the delay results for the cells that are engineered with
the pcDNA3.1-hGPR17 genes with no compounds applied, while Fig. 5 (d) presents the delay results for non-engineered
cells but with the compounds applied. Fig. 5 (e) presents the delay results for the engineered cells with pcDNA3.1-hGPR17
applied with compounds at 25µM, and Fig. 5 (f) with compounds at 50µM. The high delay as signals propagate through the
population in Fig. 5 (b) (c) and (d) is due to the propagation of normal levels of Ca2+ ions that are in each cells. However, in
the case of Fig. 5 (e) and (f), the Ca2+ ions are amplified, and this leads to a larger quantity of concentration that is pushed
from cell to cell, resulting in a higher speed of propagation, leading to lower end-to-end delay. Based on fast increase response
of many compounds, the results show that the delay has decreased by 90%, compared to the natural Ca2+ signalling. While
our wet-lab experiments have used the compounds to simulate and induce Ca2+ signalling, the delay analysis has shown that
the compounds can be used in conjunction with the cell culture to improve the performance of the logic operations for the
astrocyte-based logic gates.
Discussion
Our study has found that Ca2+ fluctuations are the main source of noise in the astrocyte-based logic gates, as observed in both
the wet lab experiments (Fig. 3 b and c) and simulations (Fig. 4 b). These fluctuations are caused by both the Ca2+ intra
and intercellular signalling. In the case of intercellular signalling, the noise is dependent on the topology of the astrocyte cell
population as Ca2+ ions can randomly propagate between the cells in the population. We also know from multiscale analysis29
that even single-cell irregularities can result in random fluctuations of Ca2+ propagation. These noise and random fluctuations
can result in unreliable logic operation. Moreover, as shown in both Fig. 3 (b) and Fig. 4 (a) and (e), the relationship between
the threshold as well as the Tb can lead to false results in the logic gate computation. Accuracy can go up to above 90% levels
when Tb is higher than 30s for the AND gate, and for 25s in the OR gate. This is because a fluctuation is shown to decrease
when increasing the Tb as shown in Fig. 4 (b) and (f). However, as shown in Fig. 4 (c) and (d), the decision of a threshold is
dependent on the impact of the output accuracy, false positive and false negatives results, topology structure, the position where
the logic gates are placed as well as the system dynamics. The usage of a reinforced-learning approach to decide parameters
such as the threshold and Tb can lead the system to optimum results when information about the network topology is not
8/15No. pcDNA.13 hGPR17 +
a) b)
No. pcDNA.13 hGPR17 +
No compounds c)
pcDNA.13 hGPR17 +
No compounds d) Compounds (1µM)
No pcDNA3.13 hGPR17+ Compounds
No. pcDNA3.13 hGPR17 (000) [And] pcDNA3.13 hGPR173-Compound
8 108
r=3
10 8
10
3 3
3
2 2
2
r=2 1 1
1
0 0 0
8
r=1
8 8
6 3 3 6 3
6
4 2 4 2 4 2
2 1 2 1 2 1
Radius (# of cells) Radius (# of cells) Radius (# of cells)
e) pcDNA.13 hGPR17 + f) pcDNA.13 hGPR17 +
Compounds (25 µM)
pcDNA3.13 hGPR17+ Compounds (25uM)
Compounds (50 µM)
pcDNA3.13 hGPR17+ Compounds (50uM)
108
108
3
3
2 2
1 1
0 0
8 8
6 3 6 3
4 2 4 2
2 1 2 1
Radius (# of cells) Radius (# of cells)
Figure 5. Static timing analysis for delay performance of the input population. (a) The static timing analysis of the input
population with different reach radius r. (b) Delay in seconds for eight different values of r over 0 to 100 logical operations for
no pcDNA3.1-hGPR17. (c) Delay results for pcDNA3.1-hGPR17 only. (d) Delay results for no pcDNA3.1-hGPR17 but with
compounds. (e) Delay results for pcDNA3.1-hGPR17 with compounds at 25µM. (f) Delay results for pcDNA3.1-hGPR17 with
compounds at 50µM.
available. This is where the benefits of the reinforced-learning platform comes in, where it determines the optimum Tb , by
analyzing the propagation noise that is transmitted through the molecular communication simulator until it converges to a value
resulting in the least amount of noise, irrespective of the topology. Our experiments in Fig. 3 shows that different compounds
amplify the Ca2+ signalling for the output of the logic gate, allowing us to set different thresholds for the AND and OR gates.
This also means that the topology of the input links plays a role in ensuring that the optimum Ca2+ signals should flow into
the output population in order to obtain accurate results from the logic computation. The results from the experiments that
used the compounds for simulating the Ca2+ signals of the input links was used in the simulations to determine the impact
of Ca2+ ion concentration propagation on the static delay analysis of the logic operation (Fig. 5). The simulation has shown
that higher concentration of Ca2+ propagated between the cells, leads to faster diffusion, which lowers the delay that can lead
to higher iterative numbers of logic computations. Therefore, the design for Neural-molecular computing chips can include
substrates with the compound mixed with the engineered astrocyte culture, to further amplify the Ca2+ ion production as well
as propagation.
Majority of biomolecular computing techniques9, 30, 31 developed to date rely on the DNA transcription and translation
processes, which limits their operation for future in-vivo applications. This is because it will require insertion of complex
genetic circuits into the cells that can result in gene expressions that can be damaging to its biological environment, possibly
affecting the tissue homoeostasis32 . While there are benefits through the use of cell-free expression techniques, where the
machinery are not required to be embedded in a living cell, the operation can be unreliable when all components are required
to work together within a liquid environment. Our approach can partially eliminate these issues with 1) embedding simpler
synthetic gene into the cell’s genome, and 2) provide a new approach for brain bio-electronics that utilizes engineered astrocytes,
which is only based on manipulating the flow of Ca2+ ions and thresholds to achieve gate behaviours. The benefit of using
astrocytes for the Neural-molecular computing is the ease of integrating it into the brain tissue, where they can easily connect
with natural neurons in order to receive incoming signals as well as produce output signals. Our work lays the foundation for
Neural-molecular computing chips that can embed logic circuits built from gates of engineered astrocytes. Therefore, future
work will need to investigate how the astrocyte-based logic gates can be connected into a circuit33 . The Neural-molecular
computing on a chip that houses the engineered astrocytes can be designed and constructed from biocompatible material (e.g.,
polymers), avoiding the need for silicon technology to perform the computing.
Conclusion
The vision of molecular computing is to perform unconventional computing using biological systems, and in particular through
the interaction of molecules produced by cell machinery. Over the years, many molecular computing approaches have been
developed, using DNA, where computing functions is achieved through multiple DNA molecules interacting, as well as using
cells, such as bacteria. In this paper, we take an alternative approach where molecular computing is achieved through the
engineering of Eurokaryotic cells, and in particular, astrocytes. By engineering the threshold of Ca2+ ions that flow between
9/15the cells, AND and OR gates can be developed. The paper first demonstrated through wet lab experiments AND and OR
gates that can be developed using hGPR-17 synthetic gene expression, with incoming Ca2+ signals simulated from chemical
compounds (MDL29, 951 and T 0510.3657) added to the culture. The results showed that AND and OR gate behaviour can
be achieved, provided that the threshold is set accordingly, and this threshold should produce an output Ca2+ signal. The
paper also presented a reinforced learning platform for logic gate design that is agnostic to any cell culture and can be used
to determine the optimum Ca2+ activation threshold and input transmission period Tb . The validation was performed using
a Ca2+ -signalling based molecular communication simulator. The simulation showed that for any type of input topology of
astrocyte network, there is an optimum value for the Ca2+ activation threshold and input transmission period Tb , and this was
validated through the reinforced learning platform. The future work can use the reinfoced learning platform to design the timing
of the input signals as well as the activation threshold for any type of cell culture. The work presented in this paper lays the
foundation for future Neural-Molecular Computing on a chip that is constructed from biological cells that perform computing
functions, minimizing the need for silicon technology. This, in turn, can result in a game-changer for future brain implants that
are controlled and operated from molecular computing logic circuits.
Acknowledgements
We are grateful to thank Prof. Dr Evi Kostenis, Institute for Pharmaceutical Biology, the University of Bonn for the kind gift
of the pcDNA3.1-hGPR17 plasmid. M. T. Barros is funded by the European Union’s Horizon 2020 research and innovation
programme under the Marie Skłodowska-Curie grant agreement No 839553.
Appendix
Here we present the mathematical framework used in the paper. The code of the simulations described here can be found in
https://github.com/michaelbarros/astrocytes_population_sim
Computational model of astrocytes intracellular signalling
In this section we introduce a model describing Ca2+ oscillations in astrocytes that was proposed by Lavrentovich and Hemkin34 .
The model is in accordance with experimental observation34 . We have Ca2+ pool storage models, which includes: Ca2+
concentration in the cytosol (Ca ) (Eq. 1); Ca2+ concentration in the endoplasmic reticulum (Ea ) (Eq. 2); and IP3 concentration
(Ia ) (Eq. 3). They are represented by the following equations:
dCa
= σ0 − κoCa + σ1 − σ2 + κ f (Ea −Ca ) (1)
dt
dEa
= σ2 − σ1 − κ f (Ea −Ca ) (2)
dt
dIa
= σ3 − κd Ia (3)
dt
where σ0 is the flow of Ca2+ from the extracellular space into the cytosol 1 , κoCa is the rate of Ca2+ efflux from the cytosol to
the extracellular space, κ f (Ea −Ca ) is the leak flux from the endoplasmic reticulum into the cytosol and κd Ia is the degradation
of IP3 .
The σ1 term (Eq. 4), models the Ca2+ flux from the endoplasmic reticulum to the cytosol via IP3 stimulation. In common
with excitable and non-excitable cells, this mechanism directly affects the cytosolic concentration of Ca2+ . It is represented as:
n Cn
κC1 a
σ1 = 4ΣM3 n )(Cn + κ n )
(Can + κC1 a C2
Iam
. (Ea −Ca ) (4)
κIm + Iam
where Σm3 is the maximum flux value of Ca2+ into the cytosol, κC1
n and κ n are the activating and inhibiting variables for the
C2
IP3 and the m and n are the Hill coefficients.
The efflux of Ca2+ from the sarco(endo)plasmic reticulum to the endoplasmic reticulum is modelled as σ2 :
Ca2
σ2 = ΣM2 (5)
κ22 +Ca2
1 This term can be extended into a voltage dependent term, called voltage-gated Ca2+ channels, which was further studied in35 .
10/15Table 1. Experimental variable values for Cx43 of astrocytes36394041 .
Variable Value
λ 0.37
ϑ j mV 90
ϑ0 mV 60
Aα (mV)−1 0.008
Aβ (mV)−1 0.67
where ΣM2 is the maximum flux of Ca2+ in this process. Finally, σ3 describes IP3 generation by the Phosphoinositide
phospholipase C (PLC) protein:
C2
σ3 = Σ p 2 a 2 (6)
κ p +Ca
where Σ p is the maximum flux of Ca2+ in this process, and p is the Hill coefficient.
Gap Junctions Model
A stochastic model of gap junction behaviour was introduced by Baigent et al.36 and first studied for molecular communication
by Kilinc and Akan37 . The model considers voltage-sensitive gap junctions which are assumed to have two states of conductance
for each connexin: an open state with high conductance and a closed state with low conductance. Based on this, we consider
four basic combinations of states from each connexin of the connexon:
• State HH: Both gates are in a high conductance state. This probability is denoted by pHH ;
• State HL: One gate is in a high conductance state, and the other is in a low conductance state. This probability is denoted
by pHL ;
• State LH: One gate is in a low conductance state, and the other is in a high conductance state. This probability is denoted
by pLH ;
• State LL: Both gates are in a low conductance state. This probability is denoted by pLL .
Experimental validation of the model indicated that the LL state appears to present very low occurrence rates38 , thus we
neglect that state here. Thus, the probabilities should follow:
pHH + pHL + pLH = 1 (7)
Moreover, pHH , pHL and pLH are interrelated as follows:
d pHL
= β1 (ϑ j ) × pHH − α1 (ϑ j ) × pLH (8)
dt
d pLH
= β2 (ϑ j ) × pHH − α2 (ϑ j ) × pHL (9)
dt
where the control of the gap junctions permeability is mediated through the potential difference of the membrane of two
adjacent cells (ϑ j ), the gate opening rate is α and gate closing rate is β . The terms α1 (ϑ j ), α2 (ϑ j ), β1 (ϑ j ) and β2 (ϑ j ) are
defined as:
α1 (ϑ j ) = λ e−Aα (ϑ j −ϑ0 ) (10)
Aα (ϑ j +ϑ0 )
α2 (ϑ j ) = λ e (11)
Aβ (ϑ j −ϑ0 )
β1 (ϑ j ) = λ e (12)
−Aβ (ϑ j +ϑ0 )
β2 (ϑ j ) = λ e (13)
where ϑ0 is the junctional voltage at which the opening and closing rates of the gap junctions have the same common value λ ,
and Aα and Aβ are constants that indicate the sensitivity of a gap junction to the junctional voltage.
11/15Simulation
We consider a cellular tissue space (S) composed of I × J × K cells (c), where ci, j,k (i = 1 . . . I; j = 1, . . . J and k = 1, . . . K)
denotes an arbitrary cell in the tissue. The cells are connected with a maximum of six neighbouring cells. In the case of the
excitable and non-excitable cells, the organisation of the cells is assumed to be a layered lattice. However, for astrocytes, the
organisation is going to depend on the type of topology connection. We use a simple regular connection to perfectly match our
lattice model, that is based on the study of astrocytes topologies42 .
Consider that each cell contains a set of internal reactions of P1 and P2 pools. Each reaction and pool for a specific cell type
were defined in the previous section. The stochastic solver computes the values of each pool over time, selecting and executing
scheduled reactions. The pool will be negatively or positively affected by a constant α when a specific reaction is executed.
Modelling diffusion in a cellular tissue area captures the temporal-spatial dynamics of intercellular Ca2+ signaling. We use
Ca concentration difference to model this temporal-spatial characteristic, as follows43 :
2+
D
Z∆ (i, j, k, n, m, l) = (|Zn,m,l − Zi, j,k |) × p(.) (14)
v
where n ∈ (i − 1, i + 1), m ∈ ( j − 1, j + 1), l ∈ (k − 1, k + 1), D is the diffusion coefficient, v is the volume of the cell, and Z∆ is
the difference in Ca2+ concentration between the cells. p(.) is the probability of the gap junction opening and closing. Based on
the gap junction probabilities, we define three different diffusion reactions for each cellular connection. Such reactions are the
multiplication of the probabilities (pHH , pHL and pLH ) with the regular cell-to-cell diffusion probability.
Stochastic solver
We present in this section a stochastic solver, which determines the quantity of each pool over time. At each time step, the
Gillespie algorithm44 is executed to select a random cell and a random internal reaction of that cell, also scheduling a time step
(t) to each one of them.
The process of executing one of the distinct reactions in R requires a scheduling process divided in two phases—selecting a
reaction and selecting a time step. Each reaction is allocated a reaction constant (ar ). Considering that α0 is the summation of
all ar in R, the next reaction chosen ru will be:
ar j ar j
ru = MAX = , u ∈ N, u ∈ R (15)
|R|
α0
∑ ar j
j=1
which follows the roulette wheel selection process, which selects the events based on their probability values. However, u must
satisfy the following restriction:
u−1 α u α
rj rj
∑ α0 < ρ 2 ≤ ∑ α0 (16)
j=1 j=1
in which ρ2 is a uniform random variable with values in the range (0, 1).
At each time step (t), a time lapse (τt ) is derived based on α0 , and is represented as:
1
α0 · τt = ln (17)
ρ1
|T |
in which ρ1 is a uniform random variable with values in the range (0, 1). This process ends when ∑ τi < tθ , where T is the set
i=0
of t and tθ is the maximum simulation time.
Logic gate model
The synthetic logic gates programming is made on the reaction-diffusion process that governs the Ca2+ signalling-based
molecular communications model. We basically analyse the molecular concentration of the cell in order to defined the Ca2+
concentration threshold that triggers the output of the logic gate. This approach is inspired by11, 23 , where a recurrent biophysical
signalling pathway model was used for the logic gate design. The stages for logic gate operation are as follows: First, the
Ca2+ concentration threshold is defined for a specific logic operation function followed by the synthetic gene implementation.
Secondly, the upcoming Ca2+ from neighbouring cells through intercellular signalling are considered as inputs. In our case, we
have two inputs from two different cells. All inputs are being transmitted to the logic gate cell during the signalling period (Tb ).
The inputs interfere with the concentration in the cell cytosol [Ca ] alongside with the existing intracellular Ca2+ signalling.
Logic gates have two known states, an ”OFF” state or ”0” and an ”ON” state or ”1”. The transition between states is performed
when [Ca ] > Ca2+ concentration threshold for the ”ON” state and [Ca ] ≤ Ca2+ concentration threshold for the ”OFF” state.
12/15Table 2. Simulation parameters for astrocytes34 .
Variable Value
Ca 0.1µM
Ea 1.5µM
Ia 0.1µM
σ0 0.05 µM
κo 0.5 s−1
κf 0.5 s−1
κd 0.08 s−1
ΣM2 15µM/s
κ2 0.1µM
Σp 0.05µM/s
κp 0.3µM
n 2.02
κC1 0.15µM
κC2 0.15µM
κI 0.1µM
ΣM3 40.0s−1
m 2.2
D 350µm2 /s
Static Timing Analysis
Our analysis on the delay is based on conventional digital circuit static timing analysis. Based on a value of delay that refers to
the time a logic gate gives a complete output, d, and a number of operations that is established, n, our total delay of operation
time D is the linear progression of the given initial delay value, which equals to
n
D = ∑d = d ∗n (18)
0
References
1. Hansen, J. & Benenson, Y. Synthetic biology of cell signaling. Natural Computing 15, 5–13 (2016).
2. Lapique, N. & Benenson, Y. Genetic programs can be compressed and autonomously decompressed in live cells. Nature
Nanotechnology 1 (2017).
3. Weinberg, B. H. et al. Large-scale design of robust genetic circuits with multiple inputs and outputs for mammalian cells.
Nature Biotechnology 35, 453–462 (2017).
4. Gardner, T. S., Cantor, C. R. & Collins, J. J. Construction of a genetic toggle switch in escherichia coli. Nature 403, 339
(2000).
5. Elowitz, M. B. & Leibler, S. A synthetic oscillatory network of transcriptional regulators. Nature 403, 335 (2000).
6. Goni-Moreno, A. & Nikel, P. I. High-performance biocomputing in synthetic biology–integrated transcriptional and
metabolic circuits. Frontiers in bioengineering and biotechnology 7 (2019).
7. Siuti, P., Yazbek, J. & Lu, T. K. Synthetic circuits integrating logic and memory in living cells. Nature Biotechnology 31,
448–452 (2013).
8. Lienert, F., Lohmueller, J. J., Garg, A. & Silver, P. A. Synthetic biology in mammalian cells: next generation research tools
and therapeutics. Nature Review Molecular Cell Biology 15, 95–107 (2014).
9. Bacchus, W. & Fussenegger, M. Engineering of synthetic intercellular communication systems. Metab Eng 16 (2013).
10. Anderson, J. C., Voigt, C. A. & Arkin, A. P. Environmental signal integration by a modular and gate. Mol Syst Biol 3
(2007).
11. Stetter, M., Schurmann, B. & Hofstetter, M. Logical nano-computation in enzymatic reaction networks. In 2006 1st
Bio-Inspired Models of Network, Information and Computing Systems, 1–7 (2006).
13/1512. Tamsir, A., Tabor, J. J. & Voigt, C. A. Robust multicellular computing using genetically encoded nor gates and chemical
‘wires’. Nature 469 (2011).
13. Gong, X. et al. Programmable intracellular dna biocomputing circuits for reliable cell recognitions. Chemical science 10,
2989–2997 (2019).
14. Akyildiz, I., Pierobon, M., Balasubramaniam, S. & Koucheryavy, Y. The internet of bio-nano things. IEEE Communications
Magazine 53, 32–40 (2015).
15. Abbasi, N. A., Lafci, D. & Akan, O. B. Controlled information transfer through an in vivo nervous system. Scientific
reports 8, 2298 (2018).
16. Kuscu, M., Kiraz, A. & Akan, O. B. Fluorescent molecules as transceiver nanoantennas: The first practical and high-rate
information transfer over a nanoscale communication channel based on fret. Scientific reports 5, 7831 (2015).
17. Martins, D., Barros, M. T. & Balasubramaniam, S. Quality and capacity analysis of molecular communications in bacterial
synthetic logic circuits. IEEE Transactions on Nanobioscience (2019).
18. Akyildiz, I. F., Brunetti, F. & Bl‡zquez, C. Nanonetworks: A new communication paradigm. Computer Networks 52,
2260–2279 (2008).
19. Akyildiz, I. F., Pierobon, M. & Balasubramaniam, S. Moving forward with molecular communication: From theory to
human health applications [point of view]. Proceedings of the IEEE 107, 858–865 (2019).
20. Galluccio, L., Palazzo, S. & Santagati, G. E. Characterization of molecular communications among implantable biomedical
neuro-inspired nanodevices. Nano Communication Networks 4, 53 – 64 (2013).
21. Barros, M. & Dey, S. Feed-forward and feedback control in astrocytes for ca2+-based molecular communications
nanonetworks. IEEE/ACM transactions on computational biology and bioinformatics (2018).
22. Ma, K. C., Perli, S. D. & Lu, T. K. Foundations and emerging paradigms for computing in living cells. Journal of molecular
biology 428, 893–915 (2016).
23. Hiratsuka, M., Aoki, T. & Higuchi, T. Enzyme transistor circuits for reaction-diffusion computing. IEEE Transactions on
Circuits and Systems I: Fundamental Theory and Applications 46, 294–303 (1999).
24. Barros, M. T. Ca2+-signaling-based molecular communication systems: Design and future research directions. Nano
Communication Networks – (2017).
25. Barros, M. T., Balasubramaniam, S. & Jennings, B. Comparative end-to-end analysis of ca2+-signaling-based molecular
communication in biological tissues. IEEE Transactions on Communications 63, 5128–5142 (2015).
26. Goldbeter, A., Dupont, G. & Berridge, M. J. Minimal model for signal-induced ca2+ oscillations and for their frequency
encoding through protein phosphorylation. Proceedings of the Natinoal Academy of Science USA 87, 1461–1465 (1990).
27. Saravanan, K. M., Palanivel, S., Yli-Harja, O. & Kandhavelu, M. Identification of novel gpr17-agonists by structural
bioinformatics and signaling activation. International journal of biological macromolecules 106, 901–907 (2018).
28. Hennen, S. et al. Decoding signaling and function of the orphan g protein–coupled receptor gpr17 with a small-molecule
agonist. Sci. Signal. 6, ra93–ra93 (2013).
29. Barros, M. T., Silva, W. & Regis, C. D. M. The multi-scale impact of the alzheimer’s disease on the topology diversity of
astrocytes molecular communications nanonetworks. IEEE Access 6, 78904–78917 (2018).
30. Ausländer, S., Ausländer, D., Müller, M., Wieland, M. & Fussenegger, M. Programmable single-cell mammalian
biocomputers. Nature 487 (2012).
31. Ye, H., Aubel, D. & Fussenegger, M. Synthetic mammalian gene circuits for biomedical applications. Curr Opin Chem
Biol 17 (2013).
32. Pucci, B., Kasten, M. & Giordano, A. Cell Cycle and Apoptosis. Neoplasia (New York, N.Y.) 2, 291–299 (2000).
33. Menolascina, F., Siciliano, V. & di Bernardo, D. Engineering and control of biological systems: A new way to tackle
complex diseases. {FEBS} Letters 586, 2122 – 2128 (2012). Synthetic Biology.
34. Lavrentovich, M. & Hemkin, S. A mathematical model of spontaneous calcium(ii) oscillations in astrocytes. Journal of
Theoretical Biology 251, 553–560 (2008).
35. Zeng, S., Li, B., Zend, S. & Chen, S. Simulation of spontaneous ca2+ oscillations in astrocytes mediated by voltage-gated
calcium channels. Biophysical Journal 97, 2429–2437 (2009).
14/1536. Baigent, S., Stark, J. & Warner, A. Modelling the effect of gap junction nonlinearities in systems of coupled cells. Journal
of Theoretical Biology 186, 223–239 (1997).
37. Kilinc, D. & Akan, O. B. An information theoretical analysis of nanoscale molecular gap junction communication channel
between cardiomyocytes. IEEE Transactions on Nanotechnology 12, 129–136 (2013).
38. Bukaukas, F. F., Bukauskiene, A., Bennett, M. V. L. & Verselis, V. K. Gating properties of gap junction channels assembled
from connexin43 and connexin 43 fused with green fluorescent protein. Biophysics Journal 81, 137–152 (2013).
39. Viliunas, V., Weingart, R. & Brink, P. R. Formation of heterotypic gap junction channels by connexins 40 and 43. Cirulation
Research 86, E42–E49 (2000).
40. Moreno, A. P., Laing, J. G., Beyer, E. C. & Spray, D. C. Properties of gap junction channels formed of connexin 45
endogenously expressed in human hepatoma (skhep1) cells. The American Journal of Physiology 268, 356–365 (2000).
41. Viliunas, V. Biophysical properties of connexin-45 gap junction hemichannels studied in vertebrate cells. The journal of
general physiology 119, 147–164 (2002).
42. Lallouette, J., Pitta, M. D., Ben-Jacob, E. & Berry, H. Sparse short-distance connection enhace calcium wave propagation
in a 3d model of astrocytes networks. Frontiers in Computation Neuroscience 8, 1–18 (2014).
43. Nakano, T. & Liu, J.-Q. Design and analysis of molecular relay channels: An information theoretic approach. IEEE
Transactions on NanoBioscience 9, 213–221 (2010).
44. Gillespie, D. T. Exact stochastic simulation of coupled chemical reactions. Journal of Physical Chemistry 81, 2340–2361
(1977).
15/15You can also read