Single shot multispectral multidimensional imaging using chaotic waves - Nature
←
→
Page content transcription
If your browser does not render page correctly, please read the page content below
www.nature.com/scientificreports
OPEN Single shot multispectral
multidimensional imaging using
chaotic waves
Vijayakumar Anand1*, Soon Hock Ng1, Jovan Maksimovic1, Denver Linklater2,
Tomas Katkus1, Elena P. Ivanova2 & Saulius Juodkazis1,3,4*
Multispectral imaging technology is a valuable scientific tool for various applications in astronomy,
remote sensing, molecular fingerprinting, and fluorescence imaging. In this study, we demonstrate
a single camera shot, lensless, interferenceless, motionless, non-scanning, space, spectrum, and
time resolved five-dimensional incoherent imaging technique using tailored chaotic waves with
quasi-random intensity and phase distributions. Chaotic waves can distinctly encode spatial and
spectral information of an object in single self-interference intensity distribution. In this study, a
tailored chaotic wave with a nearly pure phase function and lowest correlation noise is generated
using a quasi-random array of pinholes. A unique sequence of signal processing techniques is applied
to extract all possible spatial and spectral channels with the least entropy. The depth-wavelength
reciprocity is exploited to see colour from depth and depth from colour and the physics of beam
propagation is exploited to see at one depth by calibrating at another.
Hyperspectral and multispectral imaging technologies offer the capability to extract spectral information for
every pixel of an image and are useful for a wide range of applications ranging from a stronomy1, biology2,
fluorescence imaging3, infrared imaging4, and industrial a pplications5,6. The experimental and computational
footprint of the above hyperspectral imagers are enormous owing to the principle of direct imaging. Pinhole
imaging is one of the oldest direct imaging technologies developed several centuries ago with the first published
report in 1545 showing a drawing in Gemma Frisius’ De Radio Astronomica et Geometrica7. Pinhole imaging
continues to be one of the attractive areas of research as the technique is easier to implement in almost any band
of the electromagnetic spectrum8,9 and exhibits distortion, astigmatism free and infinite depth of field imaging
capabilities10. Pinhole imaging systems have been proven useful in a stronomical11, biomedical a pplications12,
and holography13. One of the main drawbacks of pinhole imaging is that most of the incoming light is blocked
resulting in a low intense image with a poor SNR. Substitutions to pinhole such Fresnel zone plate14, photon
sieves15, random array of pinholes (RAP)16, coded apertures17, etc., have proven to overcome the above problem.
Indirect imaging techniques such as imaging with RAP and coded apertures were born on occasions when the
capabilities of direct imagers were not sufficient to achieve a particular task. For instance, when the pinhole was
replaced by a RAP, direct imaging became indirect as what was recorded or observed is not the image of a scene
but a random like intensity distribution. Computational processes were often needed to reconstruct the image
from the random like intensity distribution. A direct imager has a direct object-image relationship, whereas,
indirect imagers have an object-intermediate complex amplitude–image relationship. The existing intermediate
step is what makes indirect imagers possess capabilities that are not present in direct imagers. Indirect imaging
techniques such as holography in which instead of the image of an object, a hologram of a scene is recorded, offers
ample opportunities to extract additional information of a scene than direct i maging18,19. However, holography
techniques often suffer from penalties paid in the form of many number of camera recordings, and the need for
infrastructure for two beam interference such as vibration isolation, coherent light source, many optical ele-
ments, etc. which precludes its’ application in industry and extreme environments. The latest advancements in
1
Center for Micro‑Photonics, Faculty of Science, Engineering and Technology, Swinburne University of
Technology, Hawthorn, VIC 3122, Australia. 2Department of Physics, RMIT, GPO Box 2476, Melbourne, VIC 3001,
Australia. 3Melbourne Centre for Nanofabrication, ANFF, 151 Wellington Road, Clayton, VIC 3168, Australia. 4Tokyo
Tech World Research Hub Initiative (WRHI), School of Materials and Chemical Technology, Tokyo Institute of
Technology, 2‑12‑1, Ookayama, Meguro‑ku, Tokyo 152‑8550, Japan. *email: vanand@swin.edu.au; sjuodkazis@
swin.edu.au
Scientific Reports | (2020) 10:13902 | https://doi.org/10.1038/s41598-020-70849-7 1
Vol.:(0123456789)
www.nature.com/scientificreports/
holography technology assisted by computational optical m ethods20 and deep learning modules have enriched
the area of research and simplified the imaging p rocesses21 by transferring the experimental requirement load
partly to signal processing, computational and machine learning domains. This resulted in compact, lensless,
multidimensional imaging tools with advanced imaging capabilities on par with or better than expensive direct
imaging counterparts.
The complex amplitude generated by a RAP has a random intensity and phase distribution resulting in a
chaotic wave. Chaotic waves have been shown recently to possess the capability to encode three-dimensional
location information of an object into a random intensity p attern22 without the need for two beam interference
and spatial scanning like holography and direct imaging respectively. With an appropriate signal processing tool,
it is possible to decode depth specific information from one or few intensity patterns. In this study, we synthesize
tailored incoherent chaotic waves using a quasi-random array of pinholes (QRAP) to encode spatial as well as
spectral information of an object into a single monochrome intensity pattern and decode that intensity pattern
into multiple spatial and spectral image channels using unique spatio-spectral library functions. The above pro-
cess increases the information bandwidth of imaging and videography incredibly. This is in contrast to direct
imaging modules, where every spatio-spectral channel is recorded by a scanning procedure. There are certain
phase retrieval techniques developed which do not require the spatio-spectral library to extract information
from a chaotic wave, but the main problem was that all the spatial and spectral channels were superposed during
image reconstruction into a single i mage23.
Unlike direct imaging methods, where any object under observation is spatially and spectrally scanned,
the proposed method requires only a one time manual-cum-computer training procedure during which all
possible spatio-spectral signatures are synthesized and stored. When a multispectral, thick object is observed
using the QRAP, only a single monochrome intensity pattern is needed to decode all the spatio-spectral chan-
nels. In the previous studies on diffuser based spatial and spectral cameras, it is necessary to scan over all the
spectrum and space24,25. Besides, the chaotic waves could not be engineered resulting in a lower field of view of
imaging and higher reconstruction noise demanding complicated computational reconstruction mechanisms.
Multispectral imaging techniques such as coded aperture snap shot spectral imaging (CASSI) and compressive
spectral imaging techniques have been useful for reconstructing 3D information of a scene in 2D space and
spectrum but requires multiple optical components and could not be used to simultaneously extract depth as
well as spectral information26–29. Four dimensional imaging in 3D space and spectrum with coded aperture cor-
relation holography had been demonstrated earlier but requires at least 40 camera shots per image30. Another
incoherent holography technique called Fresnel incoherent correlation h olography3,31–33 has been extended for
4D imaging using multiplexing method but the method requires 2 N + 1 camera shots, where N is the number
of wavelength channels. Besides, i n31–33, a holographic optical set up is required with polarization multiplexing
and phase shifting. Recently, a modified Fresnel incoherent correlation holography has been demonstrated for
4D imaging with a single camera shot34 but requires extensive training in the beginning.
In this study, we propose a unique combination of optical and computational techniques to employ only
a single element: an amplitude mask containing a QRAP between the object and the sensor for multispectral,
multidimensional imaging with a wide field of view and high information bandwidth with a single camera shot.
The method can utilize depth-wavelength reciprocity to employ only a single wavelength to synthesize the entire
spectral signatures or a single depth and multiple wavelengths to synthesize the entire spatial signatures or syn-
thesize the entire signatures from a couple of signatures recorded at the axial and spectral limits. The proposed
method can perform 5D imaging in space, spectrum and time from a single camera shot after pre-training with
only a total of four camera shots recorded at the axial and spectral boundaries of the system.
Results
Two‑dimensional spatial imaging with chaotic waves. The spatial lateral resolution limit of imaging
with chaotic waves is like those of direct imaging with 1.22λu/D constrained further by the autocorrelation func-
tion, where D is the diameter of the RAP mask35. A detailed study of the theory and the variation of autocorrela-
tion function with the diameter of the pinholes of the RAP is given in the supplementary materials (Sections S1
and S2). The field of view of imaging using a RAP mask can be twice as much as a lens due to the indirect mode of
imaging as even a partial random intensity distribution can reconstruct the complete information of the object.
More details on the intrinsic enhanced wide field of view with RAP is given in the supplementary materials (Sec-
tion S3). The light efficiency has been calculated for the RAP mask and compared with a direct imaging system
under identical imaging conditions and the former being an indirect imaging method has a higher photon
budget requirement as shown in supplementary materials (Section S4). Consequently, the proposed method
is susceptible to noise and lower temporal resolution owing to the need for a higher exposure time. While the
principles described above apply to any chaotic wave and it should be possible to image an object with any cha-
otic wave, the imaging characteristics and performances are dependent upon the nature of chaotic waves. A two
layer optimization procedure has been developed to find the optimal locations of the pinholes that will yield a
higher signal to noise ratio (SNR). In the first layer, a two-dimensional random variable is iterated several times
and the random locations of the pinholes that yielded the maximum SNR is given as input to the second layer.
In the second layer, the location of every pinhole was shifted along the x and y directions by a certain number
of pixels and the SNR is calculated for every iteration. The process is repeated for every pinhole and the pinhole
locations for the maximum SNR is determined. A detailed optimization procedure to tailoring a chaotic wave by
modifying a RAP to a QRAP is given in the supplementary materials (Section S5). In addition to the optimiza-
tion of the location of pinholes, an adaptive computer processing technique called as non-linear correlation was
implemented instead of the conventional correlation methods such as a matched filter or a phase-only filter36
to improve the signal to noise ratio along with a median filter and a correlation filter in the spectrum domain.
Scientific Reports | (2020) 10:13902 | https://doi.org/10.1038/s41598-020-70849-7 2
Vol:.(1234567890)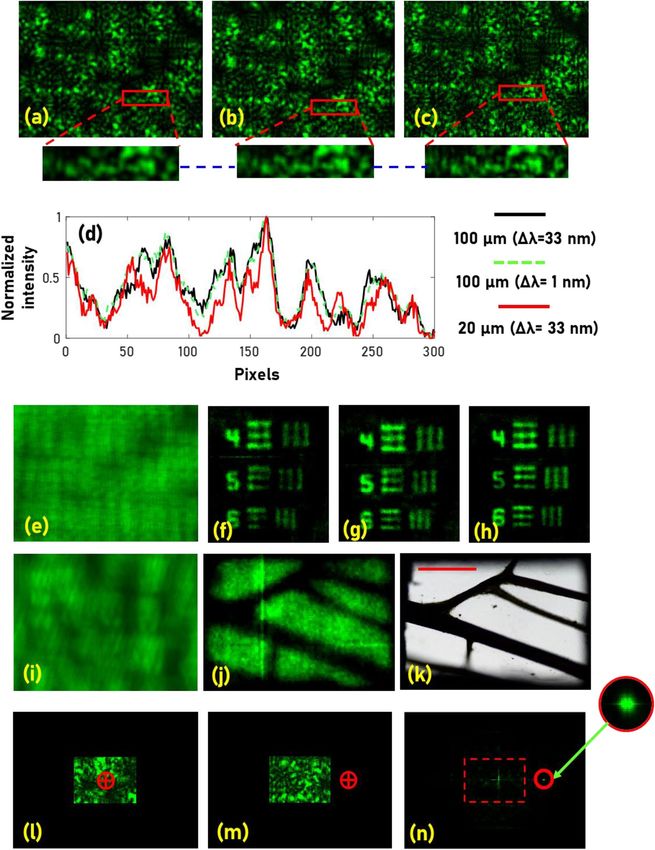
www.nature.com/scientificreports/

                            Additional information about the non-linear correlation and adaptability evaluations are given in the supple-
                            mentary materials (Section S6).
                                The experiment was carried out using a green LED (λc = 530 nm, FWHM = 33 nm), pinholes with diam-
                            eters 100 μm and 20 μm, USAF object (Group 2, Elements 4, 5 and 6), a 1 nm bandpass filter at 532 nm and a
                            monochrome image sensor. The random intensity distributions for a pinhole with a diameter of 100 μm with a
                            broadband illumination (33 nm), narrow illumination (1 nm) and a pinhole with a diameter of 20 μm without a
                            chromatic filter, for magnification of 0.5 are shown in Fig. 1a–c, respectively. The plots of line data extracted from
                            the random intensity distributions for the above three cases are shown in Fig. 1d. From the plot, it is observed
                            that additional features were visible with 20 μm with higher visibility in comparison to 100 μm pinhole with
                            and without a chromatic filter. The intensity distribution of the USAF object with a chromatic filter is shown in
                            Fig. 1e. The reconstruction results of USAF object for pinholes with 100 μm without and with filter and 20 μm
                            without a filter are shown in Fig. 1f–h respectively. An area of a wing of an insect was imaged using the proposed
                            method. The intensity distribution recorded by the camera, reconstructed image and the same area recorded by
                            a microscope (5×) is shown in Fig. 1i–k, respectively. The wide field of view capability is demonstrated by the
                            following experiment. The image sensor’s central area (~ 1/3rd) was only used for imaging while the rest of the
                            sensor plane was blocked and the pinhole in the object plane was shifted laterally until the direct image is formed
                            beyond the sensor area. The random intensity distributions at the initial and final position of the pinhole are
                            shown in Fig. 1l,m. The reconstruction result beyond the field of view limit of direct imaging is shown in Fig. 1n.

                            Three‑dimensional spatial imaging with chaotic waves. Chaotic waves have axial resolution limit
                            like that of direct imaging given by 8λ(u/D)2. A detailed analysis of the variation of axial resolving power with the
                            diameter of the pinholes is given in the supplementary materials (Section S7). The axial resolution of the system
                            was studied by cross-correlating the IPSF(u = 10 cm, λ1 = 530 nm) with IPSF(Δu = − 3.5 cm to + 3.5 cm, λ1 = 530 nm)
                            and the plot of the normalized IR(x = 0, y = 0) for different values of Δu is shown in Fig. 2a. Different thick objects
                            were constructed using different thin objects: Number ‘8’ of element (8 lp/mm) of NBS target and USAF object
                            (Group 2, Element 2) (Fig. 2b), wings of an insect and USAF object (Group 2, Element 3 and 4) (Fig. 2c) with a
                            spacing of 6 mm and 4 mm respectively. A metallic strip shown in Fig. 2d is the third thick object with a thick-
                            ness of 2 mm. The IPSFs for u = 9.6–10.2 cm in steps of 0.2 cm are shown in Fig. 2e–h, respectively. The IOs of the
                            thick objects Fig. 2b–d, were recorded as shown in Fig. 2i,n,s, respectively. The images of the depth channels
                            extracted from the intensity distributions of the above thick objects using the IPSFs are shown in Fig. 2j–m,o–r,t–
                            w, respectively. The thick object shown in Fig. 2d was illuminated in reflection mode while the other objects were
                            illuminated in transmission mode.

                            Three‑dimensional spatial and spectral imaging with chaotic waves. The IPSFs recorded using a
                            pinhole with a diameter of 20 µm for λ = 617 nm, 530 nm, and 488 nm are shown in Fig. 3a–c, respectively. Three
                            thin objects namely NBS (6.3 lp/mm), USAF (Group 2, Element 1) and a negative cross hair located at the same
                            axial distance from the QRAP mask were illuminated by red (617 nm), green (530 nm) and blue (488 nm) inco-
                            herent light sources respectively. The recorded monochrome random intensity distribution is shown in Fig. 3d.
                            The three spectral channels were extracted from the monochrome intensity distribution by computer processing
                            of the monochrome intensity pattern by the IPSFs. The spectral resolution analysis is presented in the supplemen-
                            tary materials (Section S8). Three matrices were synthesized with a size four times as that of the reconstructed
                            matrix to allow a synthetic Bayer filter mosaic and the extracted three spectral channels were introduced at the
                            appropriate pixels respectively as shown in Fig. 3e–g. The three spectral channels were combined into a single
                            synthetic multicolour image as shown in Fig. 3h. The experiment is repeated to demonstrate five-dimensional
                            imaging using three objects: Fungi sample, USAF and NBS objects. The Fungi sample and USAF object were
                            illuminated by green light while the NBS object was illuminated using red light. The USAF object and Fungi
                            sample was separated by 10 mm from one another and the Fungi sample is located at a distance of 3 mm from
                            the NBS object. The image of the monochrome intensity distribution recorded for the three objects is shown
                            in Fig. 3i. The optical microscope image of the Fungi sample is shown in Fig. 3j. The green and red channels
                            in the synthetic Bayer mosaic extracted at the depth of the USAF object and NBS object are shown in Fig. 3k,l,
                            respectively. The synthetic multicolour image is shown in Fig. 3m. The green and red channels in the synthetic
                            Bayer mosaic extracted at the depth of the Fungi sample and NBS object are shown in Fig. 3n,o, respectively. The
                            synthetic multicolour image is shown in Fig. 3p.

                            Depth‑wavelength reciprocity.             The depth-wavelength relationship is evaluated by the following experi-
                            ment to see colour from depth and depth from colour (Supplementary section S9). The point spread intensity
                            distribution and object intensity distribution were recorded for the initial values (u = v = 10 cm) using the red
                            LED (λ = 617 nm) first and the green LED (λ = 530 nm) next. Then in the alternative channels, the u and v
                            values were adjusted to ≈ (617/530)u and (617/530)v, and (530/617)u and (530/617)v and the point spread
                            intensity distributions were recorded using the green LED (λ = 530 nm) and red LED (λ = 617 nm), respec-
                            tively. As expected, the point spread intensity distribution of the green LED recovered the object information
                            recorded using the red LED and vice versa. The images of the IPSFs (λ = 617 nm, u = v = 10 cm) and (λ = 530 nm,
                            u = v ≈ 12 cm) are shown in Fig. 4a,b, respectively. The images of the object intensity distributions (Number 8.0 of
                            the element 8 lp/mm of the NBS object and element 6 of group 2 of USAF object) IO(λ = 617 nm, u = v = 10 cm)
                            and IO(λ = 530 nm, u = v ≈ 12 cm) are shown in Fig. 4c,d, respectively. The results of cross-correlation between
                            IPSF(λ = 617 nm, u = v = 10 cm) and IPSF(λ = 530 nm, u = v ≈ 12 cm) and between IPSF(λ = 617 nm, u = v ≈ 9 cm)
                            and IPSF(λ = 530 nm, u = v = 10 cm) are shown in Fig. 4e,f, respectively. By comparing Fig. 4a,b, it is possible to
                            even say that both patterns are identical except for a shift. The intensity signatures in different areas denoted by

Scientific Reports |   (2020) 10:13902 |                https://doi.org/10.1038/s41598-020-70849-7                                               3

                                                                                                                                            Vol.:(0123456789)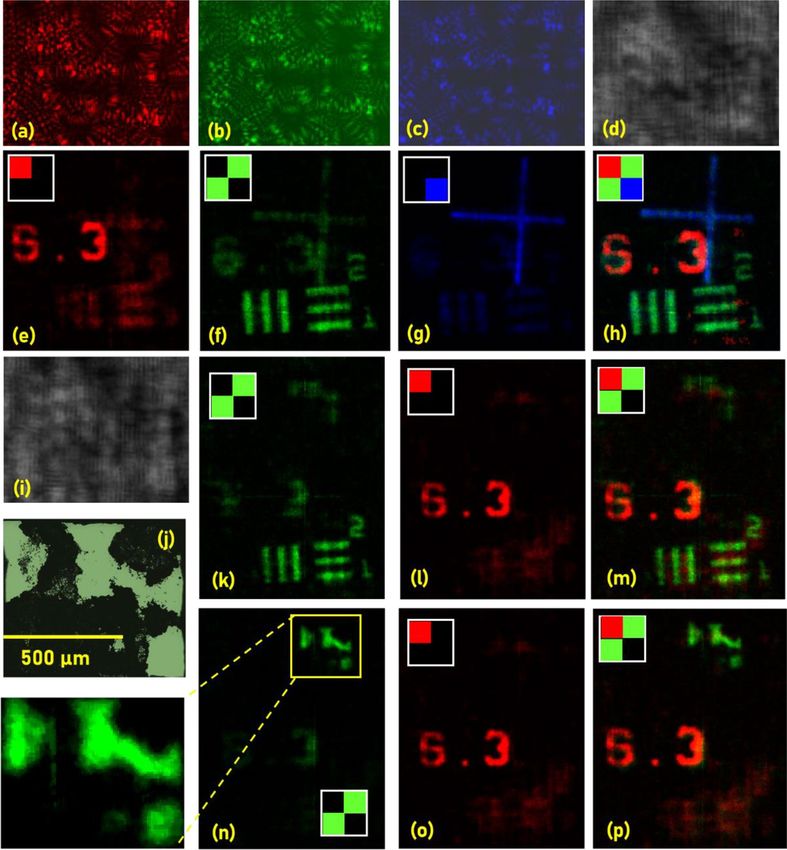
www.nature.com/scientificreports/

                                      Figure 1.  Two-dimensional imaging results. IPSFs for pinholes and spectrum (a) 100 μm (Δλ = 33 nm), (b)
                                      100 μm (Δλ = 1 nm), (c) 20 μm (Δλ = 33 nm). (d) Identical signatures in (a–c) in a line is plotted in black, dotted
                                      green and red lines respectively. (e) IO recorded for the USAF object with spectral filter. The results of non-
                                      linear correlation (α = 0, β = 0.6) (f) between (e) and (a), (g) between (e) and (b) and, (h) between (e) and (c).
                                      (i) IO recorded for an area of insect wing and (j) reconstruction result. (k) The image of a wing from a regular
                                      microscope with ×5 magnification. (l) IPSF recorded only by the central area (1/3rd) of the image sensor, (m)
                                      random intensity distribution recorded after the pinhole is shifted in the object plane to move the direct image
                                      beyond the field of view limit of direct imaging. (n) Reconstruction result of the non-linear correlation between
                                      (i) and (j). The red dotted lines in (n) indicates the boundary of the field of view. The red marker in (l) and (m)
                                      indicates the location of the direct image. The blue dotted line indicates the line data region used for comparison
                                      in (d).

          Scientific Reports |   (2020) 10:13902 |               https://doi.org/10.1038/s41598-020-70849-7                                             4

Vol:.(1234567890)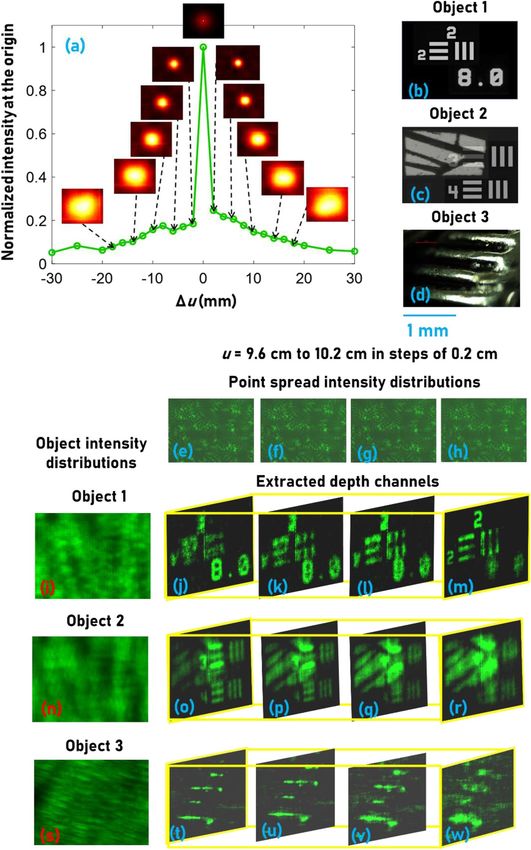
www.nature.com/scientificreports/

                            Figure 2.  Three-dimensional spatial imaging results. (a) Plot of cross-correlation intensity values at the origin
                            with the variation in the axial location of the pinhole. Thick objects composed of (b) NBS (8 lp/mm) and USAF
                            (Group 2, Element 2) resolution targets, (c) USAF resolution target (Group 2, Elements 3 and 4) and wing of an
                            insect, (d) reflective metal strip. Images of the IPSFs recorded for (e) u = 9.6 cm, (f) u = 9.8 cm, (g) u = 10 cm, and
                            (h) u = 10.2 cm. (i) IO for the thick object (b) with a thickness of 6 mm. (j–m) Depth channels extracted from (i)
                            using the IPSF library (e–h) respectively. (n) IO recorded for the thick object (c) with a thickness of 4 mm. (o–r)
                            Depth channels extracted from (n) using the IPSF library (e–h) respectively. (s) IO recorded for the thick object
                            (d) with a thickness of 1 mm. (t–w) Depth channels extracted from (s) using the IPSF library (e–h), respectively.

Scientific Reports |   (2020) 10:13902 |                https://doi.org/10.1038/s41598-020-70849-7                                                5

                                                                                                                                            Vol.:(0123456789)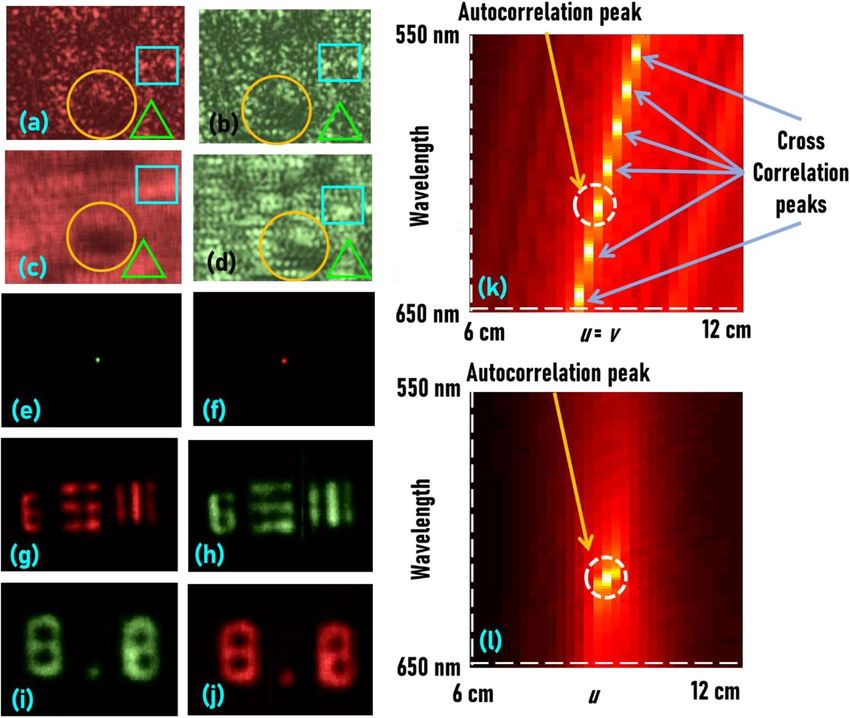
www.nature.com/scientificreports/

                                      Figure 3.  Two-dimensional spatial and spectral imaging results. IPSFs recorded for (a) λ = 617 nm, (b) 530 nm
                                      and (c) 488 nm. (d) IO recorded when three thin objects namely NBS (6.3 lp/mm), USAF (Group 2, Element
                                      1) and a negative cross hair located at the same axial distance from the QRAP mask were simultaneously
                                      illuminated by red (617 nm), green (530 nm) and blue (488 nm) incoherent light sources respectively.
                                      Images of the extracted (e) red channel, (f) green channel and (g) blue channel with a synthetic Bayer mosaic
                                      configuration. (h) The synthetic multicolour image of the three objects. (i) IO for USAF object and Fungi
                                      sample separated by 10 mm illuminated by λ = 530 nm and NBS object located at 3 mm from the Fungi sample
                                      illuminated by λ = 617 nm. (j) Optical microscope image of the Fungi sample. (k) Green channel extracted at the
                                      depth of USAF object. (l) Red channel extracted at the depth of NBS object. (m) Synthetic multicolour image of
                                      NBS and USAF object. (n) Green channel extracted at the depth of Fungi sample. (o) Red channel extracted at
                                      the depth of NBS object. (p) Synthetic multicolour of Fungi sample and NBS object.

                                      a square, circle and triangle match with one another. Some of the distinct areas are visible in the object inten-
                                      sity pattern as well. The cross-correlation result yields a sharp peak indicating that both Fig. 4a,b are identi-
                                      cal. Reconstruction results by cross-correlating Fig. 4c with 4a, and Fig. 4c with 4b, and reconstruction results
                                      by cross-correlating Fig. 4d with 4b, and Fig. 4d with 4a are shown in Fig. 4g–j, respectively. The reconstruc-
                                      tion results using different wavelength’s point spread functions matches with the reconstruction results with
                                      the same wavelength except for some additional background noise and blur. A simulation was carried out with
                                      the experimental values of the optical configuration. There are three main parameters namely u, v and λ. The
                                      random intensity distribution is calculated for λ = 550–650 nm and u = v = 6–12 cm and cross-correlated for
                                      the case with λ = 617 nm and u = v = 10 cm. The plot in Fig. 4k shows the variation of the cross-correlation with

          Scientific Reports |   (2020) 10:13902 |              https://doi.org/10.1038/s41598-020-70849-7                                           6

Vol:.(1234567890)
www.nature.com/scientificreports/
Figure 4. Reconstruction results using depth-wavelength relationship. (a) IPSF(λ = 617 nm, u = v = 10 cm), (b)
IPSF(λ = 530 nm, u = v ≈ 12 cm). (c) IO(λ = 617 nm, u = v = 10 cm), (d) IO(λ = 530 nm, u = v ≈ 12 cm). (e) Cross-
correlation between (a) and (b). (f) Cross-correlation between IPSF(λ = 617 nm, u = v ≈ 9 cm) and IPSF(λ = 530 nm,
u = v = 10 cm). Reconstruction results by cross-correlating (g) (c) with (a), and (h) (c) with (b), (i) (d) with
(b), and (j) (d) with (a). The square, circle and triangle represent similar intensity signatures. (k) The object
and image distances are varied from 6 to 12 cm and the wavelength was varied from 550 to 650 nm and the
corresponding spatio-spectral signatures are cross-correlated with IPSF(λ = 617 nm, u = v = 10 cm). (l) The object
distance is varied from 6 to 12 cm and the wavelength was varied from 550 to 650 nm and the corresponding
spatio-spectral signature is cross-correlated with IPSF(λ = 617 nm, u = v = 10 cm) resulting in a single maxima.
respect to change in wavelength and distances. The appearance of multiple peaks with same value indicates that
it is possible to generate the same random intensity distribution using different values of u, v and λ due to the
depth-wavelength reciprocity given by the equation λnum = λnvm = constant. In Fig. 4l, the same simulation has
been carried out by keeping v as a constant and varying only u and λ. In this case, there is only one peak which
is the autocorrelation peak. This indicates that it is not possible to exploit depth-wavelength reciprocity without
changing both u and v simultaneously. This difference in behaviour reassures that the imaging system is not vul-
nerable to depth-wavelength ambiguity. The object and image distances and the wavelength are varied and the
IPSF is simulated and cross-correlated with IPSF(λ = 617 nm, u = v = 10 cm) resulting in a generation of a comb of
maxima forming at λnum = λnvm = constant as shown in Fig. 4k. However, when only the object distance is varied,
the comb could not be achieved as shown in Fig. 4l.
Synthesis of point spread functions. The IPSFs are recorded at axial locations Δu = − 5 mm, 0 and 5 mm,
and λ = 530 nm as shown in Fig. 5a–c respectively and the magnification factor γ is measured using the two
extreme points as γ = 0.975 and from a linear fit, γ was estimated 0.9875 for the third case (Δu = 0). The image
of the synthesized IPSF for (Δu = 0) is shown in Fig. 5d. The reconstruction results of a USAF object (Group 2,
Element 2) using the measured IPSF for (Δu = 0) and the synthesized IPSF using the IPSF recording at Δu = − 5 mm
(scaled by 0.9875) are shown in Fig. 5e,f, respectively. The plot of the cross-correlation of the measured IPSF
at Δu = 0 and the calculated scaled intensity distribution at Δu = − 5 mm with the measured IPSF at Δu = 5 mm
are shown in Fig. 5g. The experiment was repeated by recording the IPSF at Δu = 0 and λ = 488 nm, 530 nm and
617 nm as shown in Fig. 5h–j, respectively. The image of the synthesized IPSF for the third case λ = 530 nm is
shown in Fig. 5k. The magnification factor γ was estimated as 0.96. The plot of the cross-correlation of the
Scientific Reports | (2020) 10:13902 | https://doi.org/10.1038/s41598-020-70849-7 7
Vol.:(0123456789)www.nature.com/scientificreports/
Figure 5. Reconstruction results using synthetic point spread functions. Images of the IPSFs recorded at axial
locations (a) Δu = − 5 mm, (b) Δu = 0 and (c) Δu = 5 mm, for λ = 530 nm. (d) Image of the IPSF for Δu = 0,
synthesized from Δu = − 5 mm with a magnification factor of 0.9875. Reconstruction results of a USAF object
using (e) experimentally recorded and (f) synthesized point spread function. (g) Plots of the cross-correlation
functions of the measured IPSF at Δu = 0 (Red) and the calculated scaled intensity distribution at Δu = -5 mm
(Blue) with the measured IPSF at Δu = 5 mm. Images of the IPSFs recorded at Δu = 0, for (h) λ = 488 nm,
(i) λ = 617 nm and (j) λ = 530 nm. (k) Image of the IPSF for λ = 530 nm, synthesized from λ = 488 with a
magnification factor of 0.986. (l) Plots of the cross-correlation functions of the measured point spread intensity
distribution for λ = 530 nm (Red) and the synthesized scaled intensity distribution for λ = 488 nm (Blue) with the
measured IPSF for λ = 617 nm. Reconstruction results of wings of an insect using (m) experimentally recorded
and (n) synthesized IPSFs.
measured IPSF for λ = 530 nm and the synthesized scaled intensity distribution for λ = 488 nm with the measured
IPSF for λ = 617 nm are shown in Fig. 5l. The reconstruction results of the wings of an insect using the measured
IPSF for λ = 530 nm and the synthesized intensity distribution using λ = 488 nm (scaled by 0.9860) are shown in
Fig. 5m,n, respectively.
Scientific Reports | (2020) 10:13902 | https://doi.org/10.1038/s41598-020-70849-7 8
Vol:.(1234567890)www.nature.com/scientificreports/
Discussion
We have proposed and demonstrated a multispectral multidimensional imaging technique using tailored chaotic
waves generated by a QRAP. An important property of chaotic waves is the uniformity of the random intensity
distribution generated at the sensor plane which in turn controls the background noise during cross-correlation.
By tailoring the locations of the pinholes in a mask, it is possible to force a chaotic wave to generate a uniform
intensity distribution in the sensor plane. It is well-known that cross-correlation between two positive functions
yields higher background noise. Instead of positive functions, if bipolar functions were used, the background
noise can be substantially decreased. Intensity patterns recorded by image sensor cannot have negative values
and so in practice, two different intensity distributions with cross-correlation value negligible in comparison to
autocorrelation were selected and subtracted from one another to generate bipolar intensity patterns. The need
for two intensity recordings reduces the temporal resolution of imaging. In this study, a non-linear correlation
is applied which tunes the relative magnitudes of the spectrum of the two intensities to produce an effect like
that of correlation between two bipolar functions. A sequence of signal processing techniques such as low pass
filtering, median filtering, correlation in spectrum domain with optimized values is applied in addition to the
non-linear correlation and pinhole array optimization (QRAP) to enhance the signal to noise ratio to the level of
direct imaging. The entropy was measured after the above sequence of optical and signal processing techniques
to find the recipe for obtaining the highest signal to noise ratio possible.
An important and unidentified property of imaging with a chaotic wave is the possibility of imaging with
a wide field of view. While a field of view of about twice as that of a direct imager has been demonstrated in
this study (Fig. 1n), in principle, the limit of the field of view can be pushed further by spatial multiplexing
schemes37,38. In general, the imaging characteristics can be improved by choosing a smaller diameter of pinholes
and a narrow spectral width.
The imaging system shown in Fig. 1 can be simulated using mathematical Fresnel propagators which can be
decomposed into linear and quadratic phase factors. A closer look into the above forms reveals the intertwined
wavelength and depth parameters in the scaling factor λu responsible for varying the intensity distributions
when the depth or the wavelength is varied. Consequently, the image sensor sees the same change irrespective of
whether λ is increased or u is decreased by the same factor and vice versa. Therefore, to record a random intensity
distribution for a different wavelength, it is sufficient to record for a different depth using the same wavelength
and vice versa. This property opens numerous possibilities. In other words, by training an imaging system to
discriminate information in four dimensions, it can distinctly see information in five dimensions. This is a useful
concept as according to the previous studies, to enable spectral sensing in a monochrome camera, a multispectral
source is needed, and the recording can be spectrally resolved at those wavelengths only. In the proposed method,
the spectrum can be resolved using a monochrome camera and with a single wavelength source for recording
the library functions. Alternatively, the advantage can be understood from a different perspective. In the previ-
ous studies, to extract information channels from different depths, the library must be recorded at those depths.
This is a problem when it comes to imaging through scattering layers. But with the depth-wavelength relation-
ship, a single recording is sufficient at only one plane while the information from other depth channels can be
extracted by a mere spectral scanning. We believe that this will be useful to see through scattering layers at dif-
ferent depths. A capability to synthesize the complete library will reduce time and resources during the one-time
training procedure. There are some discrepancies in the reconstruction with the synthetic intensity distributions
which are partly due to the differences in the spectral widths between the recordings and experimental errors.
There are some challenges associated with the proposed technique. For instance, in a direct imaging system, it
is possible to observe an even real-time which is not possible in the proposed technique as only a caustic intensity
pattern is observed in this case. A computational assistive module has been provided using open source software
(Octave) and operating system (Ubuntu) for real-time observation of events in the supplementary materials
(Sections S10 and S11). The lateral, axial and spectral resolutions of indirect imaging with QRAP is governed
not only by the numerical aperture but also by other parameters such as the diameter of pinholes in QRAP and
the diameter of pinhole used for recording the point spread functions (Supplementary sections S2, S7 and S8).
The photon budget calculations indicate that the indirect imaging method has lower light efficiency of about
two orders than direct imaging systems (Supplementary section S4) for a typical imaging scenario and can be
four orders while recording the point spread functions. One of the problems arising from the depth-wavelength
reciprocity is that it is difficult to understand the source of a blur, whether it is due to a change in wavelength or
depth. Therefore, the depth-wavelength reciprocity leads to depth-wavelength ambiguity i.e., a blur in a recon-
struction can be considered as a superposed state made up of two equally likely events of change of wavelength
or depth. The superposed state can be reduced to one of the two states by prior knowledge of the system. While
recording the PSFs, there are three degrees of freedom (u, v, λ) but while observing an event there are only two
degrees of freedom (u, λ) and so the probability of generating a change in wavelength by changing only u with
v fixed is quite low. However, further studies are needed to eliminate this ambiguity. Furthermore, it is must be
noted that the depth-wavelength reciprocity is valid only for single scattering and within the paraxial region of
Fresnel approximation. Meta optics and machine learning modules can be incorporated into the technique in the
future for precise engineering of wavefronts to improve the signal to noise ratio and resolution of the technique39.
In this study, an indirect imaging technique using chaotic waves have been proposed and demonstrated with
advanced capabilities beyond what is possible with direct imagers. The capability to record a scene or event
without a lens and decode that into multiple spatial and spectral channels will greatly benefit many research areas
and industrial imaging applications. Some key areas are listed below: (a) Ultrafast imaging: Most of the ultrafast
cameras available in the market are monochrome. It is almost impossible to record multispectral videos and at
depths simultaneously at ultrafast timescales. If a conventional in-line holography technique was implemented,
then multiple camera shots are needed with relative phase shifts which expands the time scale. The developed
Scientific Reports | (2020) 10:13902 | https://doi.org/10.1038/s41598-020-70849-7 9
Vol.:(0123456789)www.nature.com/scientificreports/
technique can revolutionize the area of ultrafast imaging by rendering hundreds or thousands of spatial and
spectral channels from a single ultrafast video. This will enhance the understanding of the phenomenon occur-
ring at ultrafast timescales. (b) Applicability range: The technique can be implemented using a quasi-random
array of pinholes which is easy to create for any band of the electromagnetic spectrum and therefore the tech-
nique can be extended easily to other non-visible bands of the electromagnetic spectrum such as Terahertz and
Infrared radiations for industrial applications. (c) Calibration time: The method requires lesser calibration time
compared to the earlier s tudies30,34 as it is sufficient to record the point spread functions only at the axial and
spectral boundaries involving four camera shots and all other point spread functions can be synthesized40. (d)
Hyperspectral imaging and spectrometry: The technique is a natural spectrometer as it is possible to get the
spectrum for every pixel of an image. (e) Fluorescence microscopy: The technique uses only incoherent illu-
mination with source characteristics like that of fluorescence emission and so fluorescence microscopes can be
built on the developed concept. (f) Experimental requirements: The technique is a lensless, intereferenceless,
motionless, non-scanning, single camera shot, 5D imaging technique. Therefore, the technique is much simpler
to implement without the cumbersome requirements of any other existing inline holography techniques. (g)
Aberration: The technique has self-aberration correction capabilities due to the indirect mode of imaging. (h)
Field of view: The technique possesses at least twice the field of view of any equivalent direct imaging system.
(i) Cost: Above all, the technique requires only a few low-cost components such as a web camera, computer, a
LED and a pinhole array (with holes tens-of-micrometers in diameter for most of the practical imaging tasks).
Materials and methods
Theory of multispectral and spatial imaging with a chaotic wave. First, we present the fundamen-
tal differences between incoherent imaging using a single pinhole or a lens and a RAP. Imaging an object using
a pinhole or lens creates an image of the object on the image sensor. When imaging an object using a RAP, a
random array of images is generated in the image plane. The recorded intensity pattern is the sum of the ran-
domly located replica of the image of the object. This is true whether the object is a point object or a more com-
plicated two-dimensional object. For a spatially incoherent illumination, an object can be considered as a collec-
tion of uncorrelated point objects. If IPSF is the point spread function, then the object intensity pattern IO of an
object O can be expressed as a convolution of the object with the IPSF i.e., IO = O ⊗ IPSF , where ‘⊗’ is the 2D
convolutional operator. Therefore, the image O’ of object O can be reconstructed by IO*IPSF, where ‘*’ is a 2D
correlation operator. For a 3D object illuminated by many wavelengths, IO can be considered as a sum of shifted
p,q
and scaled IPSFs corresponding to different depths z and wavelengths λ expressed as IO = O i , zj ⊗ IPSF i , zj ,
i,j
where p and
q are the number of wavelengths and depths and i = 1,2,3…p and j = 1,2,3…q. If a library of
IPSF i , zj was pre-recorded for different values of z and λ, then IO can be reconstructed into wavelength and
depth specific images of the object. A detailed theoretical analysis is presented in the Supplementary Materials
(Section S1). A pinhole camera is not highly sensitive to changes in axial distance or wavelength. Spectral
changes are often not detected due to the larger spectral bandwidth of the focus of refractive lenses. In contrast,
when an object is imaged using a RAP, unique random spatio-spectral intensity signatures are obtained for dif-
ferent values of depth and wavelength. The extracted multispectral and spatial channels can be computationally
uniquely stained and combined to generate a multispectral 3D image.
A schematic of the multispectral and spatial imaging system, optical and computational processes are pre-
sented in Fig. 6. Light from an incoherent source illuminates a pinhole and the diffracted light is modulated by
a quasi-random array of pinholes (QRAP) and the intensity pattern is recorded by a monochrome camera. A
library of spatio-spectral intensity signatures is recorded, catalogued and stored as a library function IPSF(z,λ). The
above process is done only once. An object is placed within the axial boundaries of the library and illuminated
by wavelengths within the spectral limits of the library and the object intensity pattern IO is recorded. The IO
is recorded under identical conditions and distances as IPSF(z,λ). The spatially and spectrally resolved image is
reconstructed using a cross-correlation between the IO and IPSF.
The indirect imaging technique using QRAP can be considered as a pattern recognition problem. In the
first step, the point spread functions which are the unique spatial and spectral signatures are recorded. These
signatures are the reference patterns catalogued in wavelength and depth. The intensity pattern generated for
any complicated object is the summation of the shifted and scaled reference patterns. Therefore, when the object
intensity pattern is cross-correlated with the reference patterns, a peak is obtained wherever there is a match.
In this way, the spatial and spectral composition of the object can be known without any external validation.
One of the characters of the chaotic waves studied above is the scattering ratio. Smaller is the diameter of the
pinholes, larger is the scattering angles of the chaotic wave and higher is the lateral, axial and spectral resolving
powers. With higher values of scattering angles, it is possible to reach the resolution limits of direct imaging. A
secondary constraint on imaging is the size of the pinhole used to record the point spread function libraries. The
Rayleigh resolution limits are applicable only when the sampling point object is a real point object. However,
in the experiment, the pinholes have diameters of few tens of micrometres and therefore imposes limits on the
resolutions resulting in a lower value than the theoretical ones. The reconstructed image, O′ = O ⊗ IPSF ∗ IPSF
which reduces to, O′ = O ⊗ ∧, where Λ is a delta-like function obtained by the autocorrelation of IPSF which can-
not be below the size of the smallest speckle created by the self-interference of the chaotic waves. In other words,
the spatial frequency at which the object gets sampled in an imaging system depends upon the autocorrelation
function which is dependent upon the size of the pinholes in the QRAP and the pinhole used for recording the
point spread intensity distributions.
Scientific Reports | (2020) 10:13902 | https://doi.org/10.1038/s41598-020-70849-7 10
Vol:.(1234567890)www.nature.com/scientificreports/
Figure 6. Optical configuration of imaging using a RAP mask. (a) Manual training process involving axially
scanning a pinhole and changing the illumination wavelength at every location and recording the spatio-
spectral library using a monochrome camera for a QRAP. (b) The recorded library is catalogued for different
wavelength and depth parameters. (c) A thick multispectral object is placed within the calibrated space and
a single camera shot is recorded for the object under identical experimental conditions. (d) The image of the
object in five dimensions is reconstructed by a computational correlation of the object intensity pattern with the
library, ‘∗’ is a 2D correlator.
Scientific Reports | (2020) 10:13902 | https://doi.org/10.1038/s41598-020-70849-7 11
Vol.:(0123456789)www.nature.com/scientificreports/
Complex field simulations. The complex field simulations were carried out using scalar diffraction for-
mulations with Fresnel approximation. All objects were assumed to be made up of many number of independent
point sources emitting light with no mutual coherence resulting in intensity addition in the sensor. The simula-
tion studies and calculations were processed by cross-correlating them with the spatio-spectral library using the
most recently developed non-linear filter and the optimal reconstruction parameters were obtained. In addition
to the non-linear filter, a low-pass filter, median filter and a cross-correlation at the spectrum domain were car-
ried out in sequence to obtain the reconstruction with the highest signal to noise ratio. The beam propagation
studies and calculations were carried out using MATLAB and Octave.
Optimization of the pinhole array. A random array of pinholes was synthesized using two random
number generators. The synthesis is iterated 1,000 times and every time, the pinhole array was implemented in
the complex field simulations and the background noise was estimated. The best arrangement of pinholes with
the highest SNR was selected for the second round of optimization. In the second step, a search algorithm was
implemented by shifting the location of every pinhole around its’ initial location by a predefined step size and the
pinhole locations for the highest SNR was selected by simulating the respective complex fields every time. The
second optimization involved about 10,000 iterations. The optimization was carried out in MATLAB.
Fabrication of the pinhole array. The CAD design for the pinhole array was made from the image files
from MATLAB and converted into DXF using the trial version of the LinkCAD software. The final mask design
was transferred to the resist coated chromium mask plates using Intelligent micropatterning SF100 XPRESS. The
pinholes were transferred to the chromium layer using a chrome etchant. The size of the QRAP was 8 mm × 8 mm,
the diameter of the pinholes was 80 μm after fabrication and consisted of a total of approximately 2,000 pinholes.
Experiments, data acquisition and reconstruction. The experiment was carried out using three light
sources: Thorlabs (M617L3, λc = 617 nm, FWHM = 18 nm), (M530L3, λc = 530 nm, FWHM = 33 nm) and a white
light source (Fiber-Lite, DC-950, Dolan-Jenner Industries) with a 488 nm chromatic filter. For reflection mode
illumination, the white light source with flexible fibre output was used with a filter in the image sensor. The
USAF and NBS resolution targets used for the experiments are R1DS1N (Thorlabs) and R2L2S1N (Thorlabs)
respectively. The intensity patterns were recorded using Thorlabs camera (DCU223M, 1,024 × 768 pixels, pixel
size = 4.65 μm) and the images were grabbed using Thorlabs software. The reconstruction was carried out in
MATLAB and Octave.
Received: 14 February 2020; Accepted: 24 July 2020
References
1. Carlson, R. W. et al. Galileo infrared imaging spectroscopy measurements at Venus. Science 253, 1541–1548 (1991).
2. Wilson, J. W., Robles, F. E., Deb, S., Warren, W. S. & Fischer, M. C. Comparison of pump-probe and hyperspectral imaging in
unstained histology sections of pigmented lesions. Biomed. Opt. Express 8, 3882–3890 (2017).
3. Rosen, J. & Brooker, G. Non-scanning motionless fluorescence three-dimensional holographic microscopy. Nat. Photonics 2,
190–195 (2008).
4. Palukuru, U. P. et al. Near infrared spectroscopic imaging assessment of cartilage composition: Validation with mid infrared imag-
ing spectroscopy. Anal. Chim. Acta 926, 79–87 (2016).
5. Plaza, A., Plaza, J., Paz, A. & Sanchez, S. Parallel hyperspectral image and signal processing [applications corner]. IEEE Signal
Process. Mag. 28, 119–126 (2011).
6. Khan, M. J., Khan, H. S., Yousaf, A., Khurshid, K. & Abbas, A. Modern trends in hyperspectral image analysis: A review. IEEE
Access 6, 14118–14129 (2018).
7. Renner, E. Pinhole Photography From Historic Technique to Digital Application (Elsevier Inc., Burlington, 2009).
8. Kirkpatrick, P. & Baez, A. V. Formation of optical images by X-rays. J. Opt. Soc. Am. 38, 766–774 (1948).
9. Paix, D. Pinhole imaging of gamma rays. Phys. Med. Biol. 12, 489–500 (1967).
10. Young, M. Pinhole optics. Appl. Opt. 10, 2763–2767 (1971).
11. Holt, S. S. Temporal X-ray astronomy with a pinhole camera. Astrophys. Space Sci. 42, 123–141 (1976).
12. Duan, J., Macey, D. J., Pareek, P. N. & Brezovich, I. A. Real-time monitoring and verification of in vivo high dose rate brachytherapy
using a pinhole camera. Med. Phys. 28, 167–173 (2001).
13. Eisebitt, S. et al. Lensless imaging of magnetic nanostructures by X-ray spectro-holography. Nature 432, 885–888 (2004).
14. Serre, D., Deba, P. & Koechlin, L. Fresnel Interferometric Imager: Ground-based prototype. Appl. Opt. 48, 2811–2820 (2009).
15. Kipp, L. et al. Sharper images by focusing soft X-rays with photon sieve. Nature 414, 184–188 (2001).
16. Dicke, R. H. Scatter-hole cameras for X-rays and gamma rays. Astrophys. J. 153, L101–L106 (1968).
17. Trussell, H. J. Processing of X-ray images. Proc. IEEE 69, 615–627 (1981).
18. Kalenkov, S. G., Kalenkov, G. S. & Shtanko, A. E. Hyperspectral holography: An alternative application of the Fourier transform
spectrometer. J. Opt. Soc. Am. B 34, B49–B55 (2017).
19. Tan, J., Ma, Y., Rueda, H., Baron, D. & Arce, G. R. Compressive hyperspectral imaging via approximate message passing. IEEE J.
Sel. Top. Signal Process. 10, 389–401 (2016).
20. Greenbaum, A. et al. Imaging without lenses: Achievements and remaining challenges of wide-field on-chip microscopy. Nat.
Methods 9, 889–895 (2012).
21. Lin, X. et al. All-optical machine learning using diffractive deep neural networks. Science 361, 1004–1008 (2018).
22. Vijayakumar, A. & Rosen, J. Interferenceless coded aperture correlation holography—A new technique for recording incoherent
digital holograms without two-wave interference. Opt. Express 25, 13883–13896 (2017).
23. Katz, O., Heidmann, P., Fink, M. & Gigan, S. Non-invasive single-shot imaging through scattering layers and around corners via
speckle correlations. Nat. Photonics 8, 784–790 (2014).
24. Antipa, N. et al. DiffuserCam: Lensless single-exposure 3D imaging. Optica 5, 1–9 (2018).
Scientific Reports | (2020) 10:13902 | https://doi.org/10.1038/s41598-020-70849-7 12
Vol:.(1234567890)www.nature.com/scientificreports/
25. Sahoo, S. K., Tang, D. & Dang, C. Single-shot multispectral imaging with a monochromatic camera. Optica 4, 1209–1213 (2017).
26. Wagadarikar, A., John, R., Willett, R. & Brady, D. Single disperser design for coded aperture snapshot spectral imaging. Appl. Opt.
47, B44–B51 (2008).
27. Cao, X. et al. Computational snapshot multispectral cameras: toward dynamic capture of the spectral world. IEEE Signal Process.
Mag. 33, 95–108 (2016).
28. Correa, C. V., Arguello, H. & Arce, G. R. Spatiotemporal blue noise coded aperture design for multi-shot compressive spectral
imaging. J. Opt. Soc. Am. A 33, 2312–2322 (2016).
29. Gehm, M. E., John, R., Brady, D. J., Willett, R. M. & Schulz, T. J. Single-shot compressive spectral imaging with a dual-disperser
architecture. Opt. Express 15, 14013–14027 (2007).
30. Vijayakumar, A. & Rosen, J. Spectrum and space resolved 4D imaging by coded aperture correlation holography (COACH) with
diffractive objective lens. Opt. Lett. 42, 947–950 (2017).
31. Hara, T., Tahara, T., Ichihashi, Y., Oi, R. & Ito, T. Multiwavelength-multiplexed phase-shifting incoherent color digital holography.
Opt. Express 28, 10078–10089 (2020).
32. Tahara, T., Mori, R., Kikunaga, S., Arai, Y. & Takaki, Y. Dual-wavelength phase-shifting digital holography selectively extracting
wavelength information from wavelength-multiplexed holograms. Opt. Lett. 40, 2810–2813 (2015).
33. Tahara, T., Mori, R., Arai, Y. & Takaki, Y. Four-step phase-shifting digital holography simultaneously sensing dual-wavelength
information using a monochromatic image sensor. J. Opt. 17, 125707 (2015).
34. Anand, V., Katkus, T. & Juodkazis, S. Randomly multiplexed diffractive lens and axicon for spatial and spectral imaging. Microma-
chines 11, 437 (2020).
35. Dainty, J. C. Laser Speckle and Related Phenomena Vol. 9 (Springer Science & Business Media, New York, 2013).
36. Rai, M. R., Vijayakumar, A. & Rosen, J. Non-linear Adaptive Three-Dimensional Imaging with interferenceless coded aperture
correlation holography (I-COACH). Opt. Express 26, 18143–18154 (2018).
37. Anand, V., Bhattacharya, S. & Rosen, J. Spatial multiplexing technique for improving dynamic range of speckle correlation based
optical lever. Sci. Rep. 9, 16035 (2020).
38. Rai, M. R., Vijayakumar, A. & Rosen, J. Extending the field of view by a scattering window in an I-COACH system. Opt. Lett. 43,
1043–1046 (2018).
39. Jang, M., Horie, Y., Shibukawa, A., Brake, J., Liu, Y., Kamali, S. M., Arbabi, A., Ruan, H., Faraon, A. & Yang, C. Wavefront shaping
with disorder-engineered metasurfaces. Nat. Photon. 12(2), 84–90 (2018).
40. Kumar, M., Vijayakumar, A., Rosen, J. & Matoba, O. Interferenceless coded aperture correlation holography with synthetic point
spread holograms. Appl. Opt. 59 (2020) (Accepted).
Acknowledgements
The authors thank John Paul Teodosio, Melbourne Center for Microfabrication for the useful discussions. This
work was performed in part at the Melbourne Centre for Nanofabrication (MCN) in the Victorian Node of the
Australian National Fabrication Facility (ANFF). NATO Grant no. SPS-985048.
Author contributions
V.A. developed the idea and carried out the theoretical analysis and simulation for the research which was veri-
fied by S.J. The design of the RAP was carried out by V.A., J.M., and S.H.N. The designs were fabricated, and
the experiments were carried out by V.A. The biological samples were prepared by D.L., and E.I. The optical
experiments were assisted by T.K. The manuscript was written by V.A., S.J., S.H.N., and J.M. and proof read by
the other authors. All the authors discussed the results and contributed to the manuscript. The entire research
work was supervised by S.J.
Competing interests
The authors declare no competing interests.
Additional information
Supplementary information is available for this paper at https://doi.org/10.1038/s41598-020-70849-7.
Correspondence and requests for materials should be addressed to V.A. or S.J.
Reprints and permissions information is available at www.nature.com/reprints.
Publisher’s note Springer Nature remains neutral with regard to jurisdictional claims in published maps and
institutional affiliations.
Open Access This article is licensed under a Creative Commons Attribution 4.0 International
License, which permits use, sharing, adaptation, distribution and reproduction in any medium or
format, as long as you give appropriate credit to the original author(s) and the source, provide a link to the
Creative Commons license, and indicate if changes were made. The images or other third party material in this
article are included in the article’s Creative Commons license, unless indicated otherwise in a credit line to the
material. If material is not included in the article’s Creative Commons license and your intended use is not
permitted by statutory regulation or exceeds the permitted use, you will need to obtain permission directly from
the copyright holder. To view a copy of this license, visit http://creativecommons.org/licenses/by/4.0/.
© The Author(s) 2020
Scientific Reports | (2020) 10:13902 | https://doi.org/10.1038/s41598-020-70849-7 13
Vol.:(0123456789)You can also read