Wing damage affects flight kinematics but not flower tracking performance in hummingbird hawkmoths.
←
→
Page content transcription
If your browser does not render page correctly, please read the page content below
First posted online on 27 January 2021 as 10.1242/jeb.236240
 Access the most recent version at http://jeb.biologists.org/lookup/doi/10.1242/jeb.236240

Wing damage affects flight kinematics but not flower tracking
performance in hummingbird hawkmoths.
Klara Kihlström1, Brett Aiello2,3, Eric Warrant1, Simon Sponberg2,3, Anna Stöckl*1,4
1
 Lund Vision Group, Department of Biology, Lund University, Lund, Sweden
2
 School of Physics, and 3School of Biological Sciences, Georgia Institute of Technology, Atlanta, GA, USA
4
 Behavioral Physiology and Sociobiology (Zoology II), University of Würzburg, Würzburg, Germany
correspondence: anna.stoeckl@uni-wuerzburg.de

Wing integrity is crucial to the many insect species that spend distinct portions of their life in flight.
How insects cope with the consequences of wing damage is therefore a central question when
studying how robust flight performance is possible with such fragile chitinous wings. It has been shown
in a variety of insect species that the loss in lift-force production resulting from wing damage is
generally compensated by an increase in wing beat frequency rather than amplitude. The
consequences of wing damage for flight performance, however, are less well understood, and vary
considerably between species and behavioural tasks. One hypothesis reconciling the varying results is
that wing damage might affect fast flight manoeuvres with high acceleration, but not slower ones. To
test this hypothesis, we investigated the effect of wing damage on the manoeuvrability of
hummingbird hawkmoths (Macroglossum stellatarum) tracking a motorised flower. This assay
allowed us to sample a range of movements at different temporal frequencies, and thus assess
whether wing damage affected faster or slower flight manoeuvres. We show that hummingbird
hawkmoths compensate for the loss in lift force mainly by increasing wing beat amplitude, yet with a
significant contribution of wing beat frequency. We did not observe any effects of wing damage on
flight manoeuvrability at either high or low temporal frequencies.

 Journal of Experimental Biology • Accepted manuscript

 © 2021. Published by The Company of Biologists Ltd.
Introduction
Insects are masters of flight – with their fragile chitinous wings they perform impressive aerobatic
manoeuvres, such as a dragonfly catching its prey in the air, or a hawkmoth hover-feeding from a
flower which is moving in the wind. Yet, wing wear caused by collisions or predation is almost
unavoidable for most insect species. The consequences of wing damage on flight kinematics have been
investigated in variety of insect species. A general trend across different insect groups is that a
reduction in wing area, and consequently in lift force (Ellington 1984a), is compensated for by an
increase in wing beat frequency (bumblebees: (Hedenström et al. 2001, Haas & Cartar 2008),
hawkmoths: (Fernández et al. 2012, Fernández et al. 2017) and butterflies (Kingsolver 1999)). Force
production also scales with increased wing beat amplitude, which might therefore also compensate
the loss in lift force (Ellington 1984c). However, wing beat amplitude does not change in bumblebees
with either symmetric or asymmetric wing damage (Hedenström et al. 2001), and only marginally
upon asymmetric wing damage in the hawkmoth Manduca sexta (Fernández et al. 2012, Fernández
et al. 2017). While these kinematic changes upon wing damage increase the metabolic cost of
hovering in hawkmoths (Fernández et al. 2017), they did not affect it in bumblebees (Hedenström
et al. 2001). The increased mortality of bumblebees with damaged wings (Cartar 1992) was therefore
hypothesised to impair flight performance caused by wing damage.

The effects of wing damage on flight performance across different insect species have been shown to
vary considerably, depending on the species and flight task. No effects of wing damage on free flight
activity or initial dispersal rates were observed in the Wester white butterfly (Kingsolver 1999). Also
in bumblebees, no significant changes in foraging performance, flight speed, acceleration or distance
to the ground were observed upon artificially inflicted wing damage in a simple foraging task in
bumblebees (Haas & Cartar 2008). However, in a more complex foraging task, the bumblebee’s peak
acceleration during lateral manoeuvres was reduced, though their obstacle avoidance success
remained intact (Mountcastle et al. 2016). A much more distinct impairment of manoeuvrability was
found in wing-damaged dragonflies, where a clear decrease in vertical acceleration and average

 Journal of Experimental Biology • Accepted manuscript
velocity was documented, in addition to a reduction in prey capture success, for which complex aerial
manoeuvres are required (Combes et al. 2010). Thus, one might hypothesise that wing damage affects
aerial manoeuvres with high-acceleration components stronger than steady flight or take-off and
landing. This hypothesis is further supported by studies in vertebrate flyers: in two species of bat
(Myotis albescens and M. nigricans), individuals with damaged wing membranes were able to
maintain flight speed, but performed fewer manoeuvres in comparison to conspecifics with intact
wings (Voigt 2013). In line with these results, a comparative study on hummingbird wing shape found
that species with lower wing load have enhanced manoeuvrability, in particular greater rotational
speeds during manoeuvres (Dakin et al. 2018). Since insect wing damage will cause an increase in wing
loading as well, and might therefore predict a reduced degree of manoeuvrability.

We therefore decided to investigate the effect of wing damage on the manoeuvrability of a hawkmoth
in a naturalistic foraging task. Hawkmoths provide a suitable study system, as their hovering
kinematics (including energy requirements with intact and damaged wings (Fernández et al. 2017))
have been well described (Ellington & Lighthill 1984a, Ellington 1984a, Ellington 1984b, Ellington &
Lighthill 1984b, Ellington 1984c, Willmott & Ellington 1997a, Willmott & Ellington 1997b), and their
natural foraging mode of extracting nectar while hovering in front of flowers can be exploited to
directly study the effects of changes in sensory inputs or kinematic parameters on their fast corrective
lateral flight manoeuvres (Farina et al. 1994, Sprayberry & Daniel 2007, Sponberg et al. 2015, Stöckl
et al. 2017, Dahake et al. 2018). We focused our study on the diurnal hummingbird hawkmoth,
Macroglossum stellatarum, which hibernates as adult moths and therefore have lifespans of several
months (Pittaway 1993), during which the risk of wing damage is not negligible. Using an artificial
flower that was moved at a combination of different temporal frequencies (Fig. 1A), resulting in flower
movements of a range of accelerations (Fig. 1C), we could directly probe whether wing damage
affected flower tracking manoeuvres at any of these temporal frequencies. We expected effects of
wing damage on flower tracking performance specifically at the higher temporal frequencies of flower
movement that require rapid turning manoeuvres on the scale of a few wingstrokes, and
correspondingly higher peak accelerations. Furthermore, comparing potential changes in flight
kinematics upon wing damage in this small hawkmoth species with very high wingbeat frequencies
reveals kinematic compensation strategies for wing damage across hawkmoths of different sizes and
wing beat parameters.

Methods
Animals

Wild adult Macroglossum stellatarum L. (Sphingidae), were caught in Sorède, France. Eggs were
collected and the caterpillars raised on their native host plant Gallium sp.. The eclosed adults were
allowed to fly and feed from artificial flowers similar to the experimental flowers, in flight cages (70 cm
length, 60 cm width, 50 cm height) in a 14:10 h light:dark cycle for at least one day before experiments.

Experimental groups

Three different experimental groups were tested: control animals with intact wings, animals with
natural wing damage which was caused by flying in their holding cages, and artificial wing damage
(Fig. 1D, Tables 1 and 2) induced by cutting the distal tip of the forewing of the hawkmoths, following

 Journal of Experimental Biology • Accepted manuscript
the shape of their hindwing for consistency to reach an average reduction of 19% in wing area and
25% in forewing length – the maximum amount of wing damage that would still allow the hawkmoths
to take off . Since the natural wing damage was inflicted over time, the hawkmoths in this condition
were a week older on average than hawkmoths in the other two conditions. Different hawkmoth
individuals were tested in the three conditions. In total, we tested 17 animals in the control condition,
10 in the natural damage condition and 15 in the artificial damage condition. However, we only
obtained body and wing morphology for 11 animals in the control condition, 8 in the natural damage
condition and 15 in the artificial damage condition and analysed only this subset of animals for
questions relating to body and wing morphology specifically.

We photographed every animal after the experiment and determined their body and wing size using
Fiji software (Schindelin et al. 2012). Their total body length was measured along their anterior to
posterior extent, the total wing length was measured for both wings, from the wing joint to the tip of
their forewing, and the area of both wings was quantified by tracing with the polygon tool in Fiji. The
data from the left and right wing was averaged for further analysis.

When reporting wing damage, we accounted for the individual size of the animals – and thus the
individual size of their intact wings - by normalising the measured wing morphology of the three
treatment groups with respect to the intact wing morphology expected for an animal of this size. This
was possible because wing length and wing area scaled tightly with animal length (Pearson correlation
coefficient r=0.94, r=0.95, and p
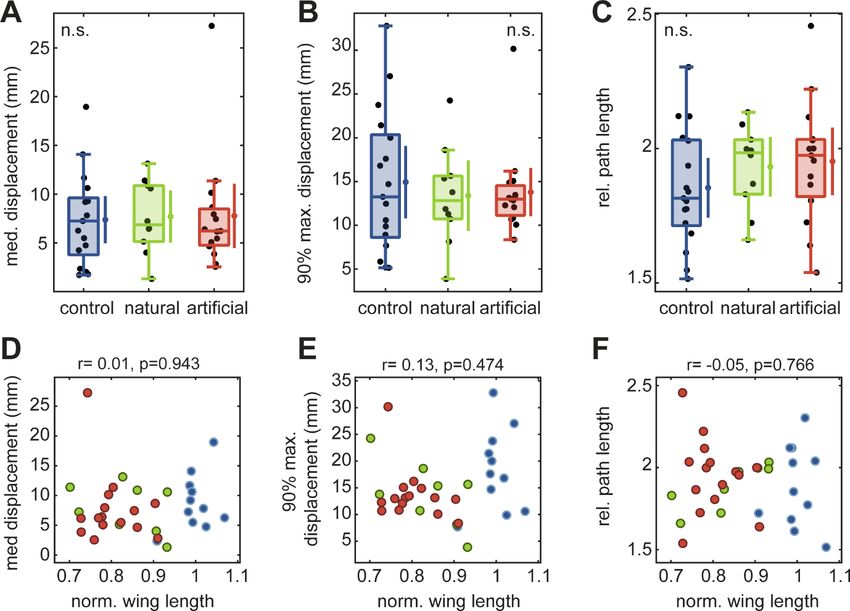
5 minutes to warm up their flight muscles and take flight. Most hawkmoths would approach the
artificial flower within a few minutes after taking off. When their proboscis contacted the nectary, we
started moving the artificial flower. If the animals did not take flight, or did not feed from the flower
within 10 minutes of taking off, we aborted the experiment and tested them again the next day. This
way, we collected one complete 20 s flight-track from one individual per condition. To move the
artificial flower, we used a “sum-of-sines” stimulus of 20 s duration comprising a pseudo-random sum-
of-sine stimulus composed of 20 temporal frequencies, which were prime multiples of each other to
avoid harmonic overlap: 0.2, 0.3, 0.5, 0.7, 1.1, 1.3, 1.7, 1.9, 2.3, 2.9, 3.7, 4.3, 5.3, 6.1, 7.9, 8.9, 11.3,
13.7, 16.7, 19.9 Hz. High frequencies had lower amplitudes and vice-versa, to assure equal peak
velocities at all frequencies and avoid saturation due to power limitations (Roth et al. 2014) (Fig.1C).
This resulted in a range of movement distances from 11 mm at 0.2 Hz to 0.07 mm at 19.9 Hz, while
the movement speed of the flower remained constant at around 13 mm/s up to 8.9 Hz, and dropped
to 9 mm/s at the highest frequency due to constraints of the motor. The acceleration of the stimulus
scaled with the increase in temporal frequency, beginning at 16.5 mm/s2 at 0.2 Hz and rising up to
1000 mm/s2 for the three highest temporal frequencies.

Flower tracking analysis

The positions of the flower and the hawkmoth were digitised from the videos using the DLTdv5
software for Matlab (Hedrick 2008) as described in (Sponberg et al. 2015, Stöckl et al. 2017). In brief,
a marker on top of the flower and a reliably identifiable point on the thorax of the moth were used
for reference for semi-automatic tracking. Tracking results were corrected manually using the same
software where necessary. We only analysed sequences where the hawkmoth’s proboscis was in
contact with the nectary. To analyse changes in body pitch angle, we also tracked the tip of the
abdomen for the first 200 frames of the stimulus, using manual tracking because the abdomen did not
provide any reliable landmarks for automatic tracking. In the dorsal camera view, an increase in body
pitch angle should manifest as a decrease in the distance between the thorax and abdomen tip (Fig. 2-
S2). We could not track the tip of the abdomen reliably in all videos, thus the number of individuals

 Journal of Experimental Biology • Accepted manuscript
for this analysis was 14 in the control condition, 9 in the natural damage condition and 10 in the
artificial damage condition

To analyse the tracking performance across the entire stimulus, we extracted the absolute Euclidian
distance between the hawkmoth’s thorax and the nectary of the flower to obtain a measure for the
displacement of hawkmoth and nectary. We calculated both the average displacement (as the median
of distances across the entire stimulus duration), and the peak displacement (the 90% quantile of
distances across the stimulus), to assess whether hawkmoths differ in their average tracking
performance, or whether wing damage might produce specific tracking impairments that are not
visible across the average (Fig. 5A, B). Moreover, we calculated the absolute length of the path the
hawkmoth’s thorax travelled, relative to the path length of the flower (Fig. 5B). To analyse the tracking
performance at each temporal frequency of the stimulus, we extracted the amplitude and phase
components in the corresponding power spectra at the stimulus frequencies. As in previous studies
with the same stimulus (Sponberg et al. 2015, Stöckl et al. 2017), we did not analyse data at the
highest two temporal frequencies (16.7, 19.9 Hz), moths did not reliably track these frequencies. We
used a system identification analysis (Cowan et al. 2014) to characterise the flower tracking
performance of the hawkmoths as described previously (Sponberg et al. 2015, Stöckl et al. 2017). In
brief, the tracking performance can be described by two components: gain and phase (Farina et al.
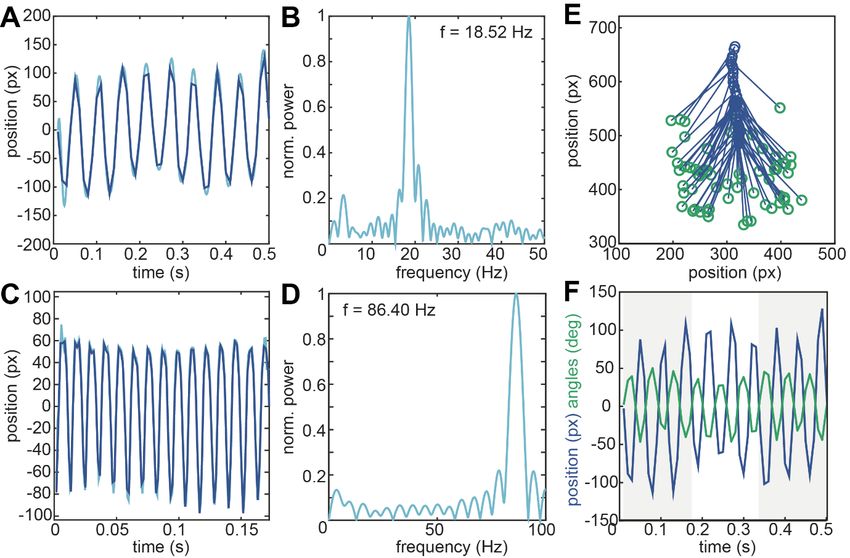
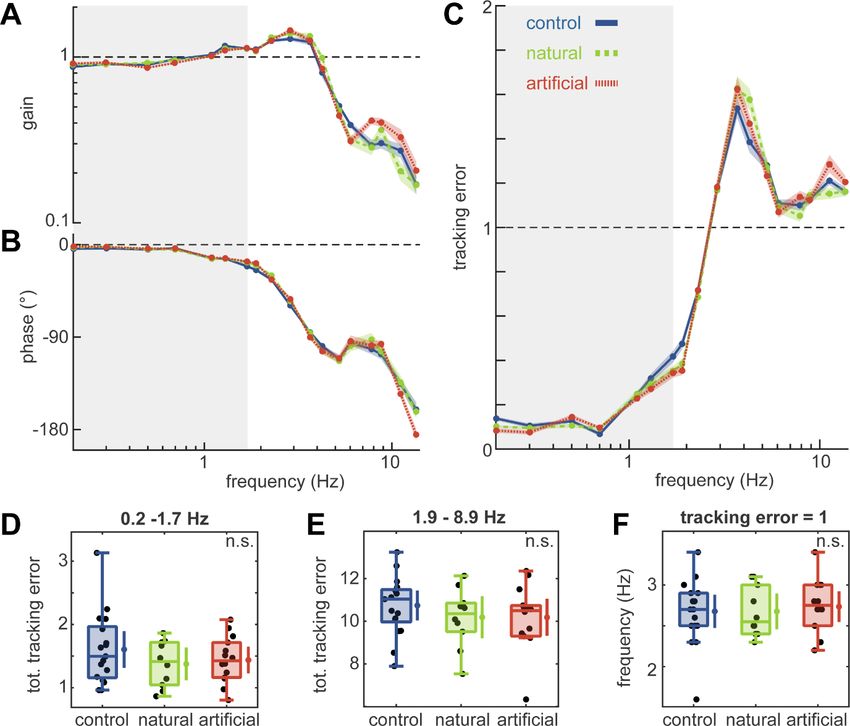
1994, Sponberg et al. 2015). The gain is the ratio of the amplitude of the hawkmoth’s movement at
the frequency relative to the flower’s movement and would be 1 for perfect tracking. The phase is the
amount that the hawkmoth leads or lags the flower movement measured in cycles of oscillations
(degrees) and would be 0 for perfect tracking. Since both gain and phase affect the positional error,
and they are not independent, we used the tracking error ε metric (Roth et al. 2011, Sponberg et al.
2015), which incorporates effects of both gain and phase to quantify a straightforward-to-interpret
tracking performance metric for our hawkmoths (Fig.2 –S2). It is calculated as the distance between
the moth’s response H(s) and the ideal tracking conditions (gain=1, phase lag=0) in the complex plane,
where s is the Laplace frequency variable:

 ( ) = ‖ ( ) − (1 + 0 )‖ (3)

A tracking error of 0, comprised of a gain of 1 and a phase lag of 0, denotes perfect tracking, while at
a tracking error larger than 1, the hawkmoths would produce better tracking results when remaining
stationary. Because the tracking error metric is represented in the complex plane, we calculated the
average of individual tracking errors and their confidence intervals by averaging data in the complex
plane to avoid artefacts. These could arise from separating gain and phase components when
transforming them and averaging in the non-complex plane (see (Stöckl et al. 2017) for discussion).
95% confidence intervals for gain and phase were calculated in the complex plane as in (Stöckl et al.
2017).

The individual frequency that compose the analyses are not independent measures and instead
represent part of dynamic systems characterization of the moth’s response to the flower. Statistical
tests are still being developed to compare frequency responses, because it is not clear how to combine
data across frequencies. Lacking these, we took the approach of prior studies, which compares the
95% confidence intervals in the gain and phase plots and statistically compares the tracking error and
other measures across specific frequency bands. To compare the tracking error across conditions, we
pooled the data into two frequency ranges: high and low frequencies, as determined by the frequency
range of natural flower movement, which concentrates 95% of total power in frequencies up to 1.7 Hz

 Journal of Experimental Biology • Accepted manuscript
(as used for other hawkmoth species: (Sponberg et al. 2015)). We used this frequency as the limit for
our low frequency category (Fig. 6D), and frequencies higher than 1.7 Hz and up to and including 8.9
Hz into the high frequency range (Fig. 6E). We chose 8.9 Hz as the cut-off for comparability with
previous studies on Macroglossum stellatarum (Stöckl et al. 2017, Dahake et al. 2018).

Wing kinematic analysis

To extract the wing beat frequency, as well as the amplitude of wing movement, we analysed the
movement of the left wing tip for the first 100 frames of flower tracking. We thereby ensured that we
analysed the same stimulus window for all moths to avoid biasing our results by analysing different
flight manoeuvres caused by different sections of the stimulus. From these measurements, we
extracted the wing beat frequency as the peak in the Fourier transformed wing tip position (Fig. 2 –
S1A,B). Because we filmed at a frame rate of 100 fps, the animal’s wing beat frequency was higher
than the Nyquist sampling limit, which we corrected for by subtracting the measured frequency from
100 Hz to obtain the actual wing beat frequency. We confirmed this wing beat frequency by filming 3
animals during stationary hovering at 600 fps (wing beat frequencies of these animals: 86.4, 78.4, 77.2
Hz, Fig. 2 – S1C,D). We could not film the tracking videos at 600 fps for all experiments because the
memory limits of the camera did not allow sufficiently long videos for the frequency domain analysis.
Thus, while our sampling rate was sufficient to quantify general changes in flight kinematics averaged
over several consecutive wing strokes, we lacked the temporal resolution to resolve wingstroke-by-
wingstroke adjustments.

We used Fiji to extract a horizontal projection of the wing stroke amplitude (Schindelin et al. 2012),
measured as the angle between the two most extreme wing positions for each consecutive 10 wing
beat sequence over an average of 100 wing beats in total. This resulted in 10 wing beat amplitude
measurements per animal, which were then averaged to obtain the wing beat amplitude of the animal
(Fig. 2 – S1E,F). This method ensured that we selected the maximum range of wing positions despite
the frame rate undersampling of the wing beat frequency. We confirmed the accuracy of our
amplitude analysis by comparing the results to the wing beat angles obtained in the brief, 600 fps
control videos. With our dorsal camera view, we could not measure the wing stroke amplitude along
the wing stroke plane, but measured a horizontal projection of it. Thus, changes in wing stroke angle
might appear as changes in the projection amplitude we measured, as the actual wing stroke also
extends into the vertical axis (Willmott & Ellington 1997a). However, based on unpublished
measurements of the wing stroke plane relative to the horizontal plane of M. stellatarum, which
averages 30.21 ± 3.8 ° IQR, the projection captures the majority of wing stroke amplitude change, and
the method is consistent with approaches in other insect studies.

Aerodynamic model
We used established models of hovering flight (Ellington 1984a, Ellington 1984c, Fernández et al.
2017) to estimate the effects of wing damage on the lift force and mechanical power required for
flapping the wings. We modelled the lift production and required mechanical power during flapping
hovering for each individual. Following the methods of (Fernández et al. 2017) and (Ellington 1984c)
lift production was modelled as:

 1 (4)
 = 2 2 2 ̅ ̅̅̅̅̅̅̅̅̅̅̅̅̅
 ( ̂/ ̂)2
 8

 Journal of Experimental Biology • Accepted manuscript
where is air density, 2 is the second moment of wing area, is the wing beat frequency, is wing
 ̅̅̅̅̅̅̅̅̅̅̅̅̅
beat amplitude, ̅ is the average coefficient of lift, and ( ̂ / ̂)2 is the average square of the non-
dimensional angular velocity. The required mechanical power was modelled as:

 1 ̅̅̅̅̅̅̅̅̅̅̅̅̅̅̅3 (5)
 ℎ = |( ̂/ ̂)|
 3 3 ̅̅̅
 16 3
 ̅̅̅̅̅̅̅̅̅̅̅̅̅̅̅3
where 3 is the third moment of wing area, ̅̅̅ is the average coefficient of drag, and |( ̂/ ̂)| is
the average of the absolute value of the cube of the non-dimensional angular velocity. Numerical
 ̅̅̅̅̅̅̅̅̅̅̅̅̅ ̅̅̅̅̅̅̅̅̅̅̅̅̅̅̅
 ̂ / ̂)2 , and |( ̂ / ̂)|3 were obtained from (Fernández et al. 2017) and equal to
values of ̅ , ̅̅̅
 , (
1.4, 1.6, 19.74, and 105.29, respectively. The coefficients of lift and drag for a given wing planform
average a range of parameters as a function of the wing angle of attack. Average coefficients of the
same value have been applied to wings ranging in shape from that of a fruit fly to that of a
hummingbird (Hedrick et al. 2009). The assumption that many different wing shapes have similar force
coefficients is supported by comparisons of force coefficients across a range of wing shapes
(Usherwood & Ellington 2002).
Since in these equations, the wing stroke amplitude denotes the angular amplitude of the wing
stroke in the wing stroke plane, rather than in the horizontal projection as we measured in our setup,
and the transformation of the wing stroke angle from projection to stroke plane is not a linear one,
we transformed the projected wing stroke angles into the wing stroke plane using the following
transformation,

 tan( /2) (6)
 = 2 ∗ arctan ( )
 cos( )

where denotes the angle between the horizontal plane and the wing stroke plane, and is the
wing stroke amplitude measured in the horizontal projection. To calculate wing stroke amplitudes
back to the horizontal projection for better comparison with our measured results, we used the
relationships in equation 6.

To investigate the relative effect of modulating stroke amplitude and frequency to compensate for
the loss in lift production upon wing damage, we calculated the necessary modulation required in
either wing beat frequency or stroke amplitude, if the other variable remained at the average of an
animal with intact wings. In other words, how much greater would the increase in wing beat frequency
need to be if stroke amplitude was not modulated (and vice versa). To do this, the lift force was
calculated for each individual in the artificial damage and natural damage group. Using the calculated
lift, the equation was rearranged, the mean wing beat frequency from the control group was used to
replace the wing beat frequency of that individual, and the resultant magnitude of the wing stroke
amplitude was calculated. This procedure was then repeated while using the wing stroke amplitude
of the mean control group to determine the wing beat frequency necessary to compensate lift for that
individual.

To obtain the required second and third moments of wing area, wing morphology from the
photographs of each moth was digitized using the StereoMorph package (version 1.6.2) (Olsen &

 Journal of Experimental Biology • Accepted manuscript
Westneat 2015) in R (version 3.4.2; The R Foundation for Statistical Computing). The rostral and caudal
bases of the left and right forewing were digitized and a series of third order Bézier curves were used
to outline each forewing. The curves of each wing were then resampled using the StereoMorph
package to generate 50 evenly spaced points (semilandmarks) around the perimeter of each forewing.

The digital shape outputs of the left and right forewing from each moth were further analysed in
Matlab (version R2018b – 9.5.0.944444). First, each forewing was rotated so its long axis was
perpendicular to the long axis of the body. Wing length, , was measured as the distance between
the minimum and maximum value of the wing outline. Wing area was calculated using the ‘polyarea’
function in Matlab. For each wing, the second and third moments of area were calculated following
(Ellington 1984a).
Results
We investigated the effects of wing damage on the hawkmoth M. stellatarum in three treatments: a
control group with intact wings, a group with “natural” wing damage that occurred in our flight cages,
and an artificial damaged group, in which we trimmed the distal forewings to the maximum extent
with which the animals were still able to fly (Fig. 1D). The natural damage group contained individuals
with a wide range of wing damage, thus resulting in the widest spread of forewing area and forewing
length of the three treatments (Fig.1–S1B,C, Table 1). We therefore normalised forewing length and
forewing area relative to the expected length and size given an individual’s body length (see Methods).
Relative forewing length and area differed significantly between the damage treatments and the
control group (ANOVA: F2= 34.04, p
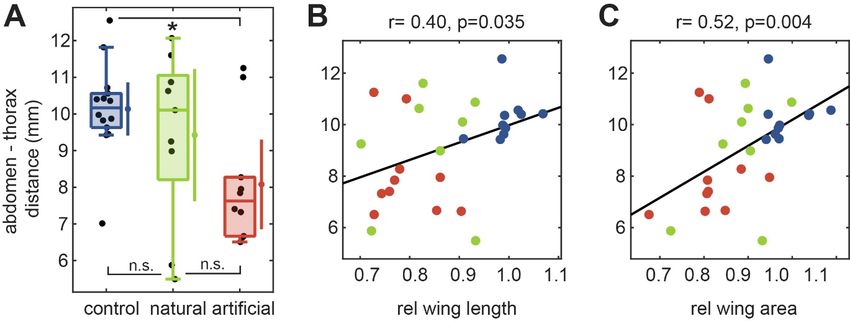
and treatments for wing beat frequency and wing length (ANCOVA, group*winglength: F2=4.4,
p=0.022, resulting in a significant difference in slope between the control and the other two
conditions: p=0.017 and intercept: p=0.026, but not between the natural and artificial damage group).
All other comparisons did not yield statistically significant interaction terms.

We also observed a change in the body pitch angle between treatments, measured as the distance
between the thorax and the distal tip of the abdomen in the dorsal camera view. Hawkmoths in the
artificial showed a steeper body pitch angle than animals in the control group (Fig. 2 -S2A, ANOVA: F2=
4.1, p=0.027, Tukey's HSD corrected post-hoc test: p=0.021, Table S1), though there was no significant
difference between the control and natural, and the artificial and natural groups (Table S1).

The effect of wing beat kinematics on lift and mechanical power

To test whether the increase in wing beat amplitude and frequency in the damage groups could
compensate for the loss in lift force due to the reduced wing area, we calculated the effects of these
parameters on the lift force and mechanical power required for flapping the wings (see Methods -
aerodynamic model). There was no significant difference in the estimated lift force across treatments
(ANOVA: F2= 0.103, p=0.903, Fig. 4A, Table S1), indicating that the changes in wing beat amplitude and
frequency observed in the damage treatment groups were sufficient to compensate for the loss in lift
force due to the reduction in wing area. There was no significant difference between treatments in
the mechanical power based on the measured wing area and wing beat kinematics (ANOVA: F2= 0.016,
p 0.984, Fig. 4B, Table S1).

To determine if wing beat frequency or wing stroke amplitude contributed more strongly to lift
compensation, we replaced the measured wing beat parameters by the median frequency and
amplitude of the control group. Without any compensation, the loss of lift force was substantial: the
median lift force in the natural damage group decreased significantly to 66.4 ± 15.2% of the lift force
generated with their measured wing beat parameters (Wilcoxon signed rank test: W7=40, p=0.008),
and in the artificial damage group to 50.0 ± 8.5% (Wilcoxon signed rank test: W14=0, p
the stroke amplitude in our model was assumed in the wing stroke plane, rather than in the horizontal
projection as measured in our experiments. We therefore transferred the projected amplitudes to the
stroke plane using an average stroke plane angle of 30.2° (see Methods). If stroke amplitude was fixed,
the average wing beat frequency required to compensate lift force production was 92.6 ± 10.3 Hz for
the natural, and 107.8 ± 8.0 Hz for the artificial damage group, both significantly increased compared
to the control (ANOVA: F2= 27.05, p
Discussion
Hummingbird hawkmoths use a combination of frequency and amplitude to compensate for wing
damage

In our study on the effects of wing damage on flight performance in the hawkmoth Macroglossum
stellatarum we observed significant effects of wing damage on the flight kinematics. Similar to other
studies previously performed on the hawkmoth M. sexta (Fernández et al. 2012, Fernández et al.
2017), as well as on butterflies (Kingsolver 1999) and bumblebees (Hedenström et al. 2001, Haas &
Cartar 2008), hummingbird hawkmoths increased their wing beat frequency when their wings were
damaged (Fig. 2A). The wing beat frequency was increased proportionally to the amount of forewing
area and length lost (Fig. 3). The increase in wing beat frequency in wing-damaged hummingbird
hawkmoths was larger than in M. sexta (10% compared to less than 5%, (Fernández et al. 2017)), and
larger in relative terms than the changes in wing beat frequency observed in bumblebees upon
comparable extent of wing damage, though similar in absolute extent (Hedenström et al. 2001, Haas
& Cartar 2008). Thus, unlike previously thought (Fernández et al. 2017), our findings show that wing
beat frequency can also be flexibly adjusted in insects with synchronous flight muscles, to a similar
extent as in insects with asynchronous flight muscles.

Interestingly, we also observed a significant and substantial increase in wing beat amplitude in
hawkmoths with damaged wings (Fig. 2B). A similar increase in wing beat amplitude has not been
observed in any of the species so far studied – though there was a marginally significant increase in
wing beat amplitude in Manduca sexta (Fernández et al. 2017). The increase in M. stellatarum,
however, was much larger than in M. sexta, and reached about 30%, while in M. sexta it was only 5%.
Together, our model results indicate that in M. stellatarum, the adjustments in wing beat kinematics
are sufficient to compensate for the loss in lift force in the damage treatments, without a significant
increase in mechanical power required to move the wings (Fig. 4).

Why, though, did hummingbird hawkmoths show a much more pronounced change in wing beat

 Journal of Experimental Biology • Accepted manuscript
kinematics to compensate for a loss of wing area than their larger relative M. sexta? A striking
difference in flight kinematics between M. sexta and M. stellatarum is their average wing beat
frequency, and their overall difference in size (M. sexta has more than twice the wingspan of M.
stellatarum and on average weighs 5 times as much (Henningsson & Bomphrey 2013)). However, the
general shape of the wings across hawkmoths is very similar, suggesting similar hovering kinematics.
Their wing loading and span efficiency have been shown to be similar (Henningsson & Bomphrey
2013). Yet, this assessment was based on experiments performed on tethered individuals in a wind
tunnel, so the results might differ from those for freely hovering individuals. Indeed, the wing beat
frequency of freely hovering M. stellatarum is almost twice as high as that measured in tethered
animals (76 Hz in Fig. 2 vs 48 Hz, (Henningsson & Bomphrey 2013). Thus, further kinematic studies
investigating hovering flight in diverse hawkmoths will be necessary to understand the striking
differences in wing beat kinematics following wing damage in these two hawkmoths species.

The high wing beat frequency of M. stellatarum might require a compensation strategy via wing beat
amplitude

Why did we observe a much greater contribution of wing beat amplitude in lift force compensation
than previously observed in other insects? Our modelling gives some indication for why M. stellatarum
might use this strategy, rather than compensate almost entirely by adjusting wing beat frequency, as
most other insects do. Based on our calculations, in order to compensate the reduction in lift force
due to wing damage entirely by adjusting wing beat frequency, an average frequency of 93 Hz for the
natural and 108 Hz for the artificial group would be required (Fig. 4E). However, such wing beat
frequencies might exceed the range of synchronous flight muscles (Dudley 2000, Syme 2002), the
muscle type possessed by hawkmoths. Indeed, none of the hawkmoths in our study (in any treatment
group) reached even the more moderate wing beat frequency increase of 94 Hz required for the
natural damage group (Fig. 2A). Since the wing beat frequency of intact M. stellatarum is already close
to the upper limit for synchronous flight muscles, compensating lift force production entirely by wing
beat frequency might not be an option for this hawkmoth species, and therefore a reason why we
observed a larger contribution of wing beat amplitude to lift force compensation (Fig. 4C). The
significant contribution of wing beat frequency, nevertheless, suggests that wing beat amplitude alone
might not be sufficient to compensate the reduction in lift force upon wing damage. It is therefore
likely that the required increase in wing beat amplitude (especially in the artificial damage case) might
be outside biomechanical limits at the relatively high wing beat frequencies employed by M.
stellatarum.

A potential beneficial side-effect of this compensation strategy, which relies heavily on increases in
wing beat amplitude rather than frequency, is a reduction in the inertial power required to move the
wings. While the aerodynamic power (Fig. 4B) scales similarly for changes in wing beat frequency and
amplitude, inertial power scales with the square of stroke amplitude and the cube of wing beat
frequency (Willmott & Ellington 1997a). Inertial power is often not considered as a cost, because it is
assumed that minimal power is required for the inertial acceleration of the wings due to energy
storage and return. However, it has been shown that the inertial power, while significantly reduced,
is not perfectly compensated by elastic elements (Gau et al. 2019). Thus, the amplitude-based strategy
of M. stellatarum should be beneficial from an inertial power point of view, and equally good as far as
aerodynamic power is concerned. This raises the question, however, why all other insect species
investigated so far showed a frequency-based compensation strategy. One important aspect speaking

 Journal of Experimental Biology • Accepted manuscript
against an amplitude-based compensation strategy, in particular for insects with asynchronous flight
muscles, is that modulations of wing beat amplitude are required for steering. Thus, increasing the
average wing beat amplitude proportionally leaves less room for amplitude changes, which might
therefore affect manoeuvrability in these insects. It will therefore be interesting to investigate in the
future whether insects with synchronous and asynchronous flight muscles apply different strategies
when compensating for wing damage, and what role other factors, such as body and wing size, might
play.

Flower tracking manoeuvrability is not compromised by natural or artificial wing damage

While the effects of wing damage on flight kinematics show some common trends across the different
species of insects studied previously, it is less well understood what effects wing damage has on the
manoeuvrability of fast flying insects, and thus ultimately on their foraging and predator avoidance
success. In our setup, we studied the effects of wing damage on the manoeuvrability of hawkmoths
in a task which is very similar to their natural foraging paradigm. Moreover, we tested the effect of
wing damage quantitatively over a range of temporal frequencies, which allowed us to assess whether
wing damage affected particular temporal aspects of the hawkmoth’s flower tracking ability, as does
alteration of their sensory input (Sponberg et al. 2015, Roth et al. 2016, Stöckl et al. 2017, Dahake
et al. 2018). However, we did not find any significant impairment of the tracking performance in wing-
damaged hawkmoths (Figs. 6,7), and no significant difference in tracking error within the frequency
range in which flowers naturally move ((Sponberg et al. 2015), Fig. 6D), nor indeed at any frequency
across the entire range. We did, however, observe an interesting difference between the three
treatment groups in the shape of their tracking response, in particular in the tracking gain: individuals
with artificial wing damage had higher tracking gains for frequencies ranging from 4.5 to 12 Hz (Fig.
6A). The particular shape of the frequency response (Fig. 6A,B) is a representation of the full sensory
to motor dynamics of the hovering moth. These differences could therefore arise either from changes
in flight kinematics affecting the mechanics of flight, or from context-dependent changes in neural
processing due to damage.

The results of a previous study on the kinematics of lateral manoeuvres in hawkmoths suggests that
wing damage, and the changes in flight kinematics induced by wing damage, might indeed affect
lateral manoeuvres (Greeter & Hedrick 2016): the hawkmoth M. sexta uses asymmetries between the
left and right wing stroke pitch angle, and to a lesser degree of the wing stroke amplitude, to initiate
lateral movements of the type we studied here in M. stellatarum via roll manoeuvres. Moreover, M.
sexta flapped with greater amplitudes during sideslips to increase their net manoeuvre force. The
increased wing beat amplitude in wing-damaged M. stellatarum should therefore have reduced the
operational flexibility of the moths to vary wing their stroke amplitude during manoeuvres or to
increase it during sideslip. Furthermore, alternative strategies based on flapping frequency changes
would also have been jeopardised by approaching the upper limit of wing beat frequency in the
damaged individuals. The fact that we did not observe any effects of wing damage on flower tracking
performance might therefore indicate that M. stellatarum rely on a manoeuvring strategy based on
wing pitch variations rather than amplitude variations, which would also be capable of supporting
these lateral manoeuvres (Greeter & Hedrick 2016). Future studies of the wing pitch angles of intact
and wing-damaged individuals resolved at wing-beat precision while the hawkmoths are tracking
flowers could reveal such a change in strategy.

 Journal of Experimental Biology • Accepted manuscript
Even though the changes in flight performance we observed between control and damage groups (Fig.
6A,B) did not affect overall tracking error, they might still reflect functional differences in the control
and damaged conditions. Previously, changes in gain within a species were observed upon altered
sensory input necessary for flight control, for example when the animals had reduced luminance
(Sponberg et al. 2015, Stöckl et al. 2017), conflicting mechanosensory and visual cues (Roth et al.
2016) or were deprived of fast sensory input about the animal’s own movements (Dahake et al. 2018).
Without the latter form of feedback, the animals could not track fast movements of the flower, and
the gain in the high frequency range decreased compared to the controls. Interestingly, with wing
damage, the gain increased in the high frequency range compared to the control group, suggesting
that wing damaged animals performed coordinated flight manoeuvres with larger amplitudes within
this range. A potential explanation for this observation might be the increased wing beat frequency
observed in the wing damage groups. It might allow the animals to perform more accurate flight
manoeuvres even at higher frequencies because the necessary adjustments of the hawkmoth’s
position could be performed faster. While the effects were relatively small and manifested only
outside of the range the animals usually experience, it shows that manipulating the wing anatomy
could also be used to artificially change different aspects of wing beat kinematics and study their role
in fine-scale flight control.
Overall, our findings suggest that intact wings are not crucial for the precise control of lateral flight
manoeuvres, which hawkmoths perform tracking flowers within their natural movement range
(Sponberg et al. 2015). This is in line with results from foraging butterflies and bumblebees, which
likewise showed no significant alterations in flight or foraging performance (Kingsolver 1999, Haas &
Cartar 2008). The system identification approach we used on the sum-of-sines stimulus allowed us to
extend this conclusion over the full temporal frequency response of the moth’s behaviour. One
explanation that might reconcile our results and previous findings from dragonflies, which showed a
strong impairment in flight performance upon wing wear (Combes et al. 2010) is the direction in which
flight manoeuvres were executed. In our experiments, the insects were conducting horizontal flight
manoeuvres, while in dragonflies the vertical acceleration was impaired, and animals often perform
vertical manoeuvres during prey capture, which showed a reduction in success upon wing damage
(Combes et al. 2010). One might therefore hypothesise that wing damage affects some flight
manoeuvres stronger than others, and that intact wings might be particularly important for fast
vertical manoeuvres.

Conclusion

Taken together, hummingbird hawkmoths compensate for a loss in wing area by increases in wing
beat frequency and amplitude, and track moving flowers without a performance impairment. This
impressive tolerance to wing damage might be a testament to the immense importance that fast
steering has for these animals: not only do they feed exclusively on the wing, and very rarely land on
flowers, they also lay their eggs on their hostplant while hovering in front of the plants (Stöckl & Kelber
2019). Moreover, since hummingbird hawkmoths hibernate as adults, resulting in lifespans of several
months (Pittaway 1993), optimising their flight abilities to tolerate wing damage might be paramount
for the fitness of these insects. Their strategy to compensate for the loss in wing area both by an
increase in wing stroke amplitude and wing beat frequency, suggests that multiple kinematics
strategies could be utilized to compensate for wing damage in different insect species. It opens up
future study directions to better understand which kinematic, aerodynamic and behavioural aspects

 Journal of Experimental Biology • Accepted manuscript
govern the strategies of insects to compensate for wing damage while retaining optimal
manoeuvrability.
Acknowledgements

We thank Merry and Leigh Foster for help with capturing the parental moths in France, and Marie
Dacke for allowing us to use her high-speed cameras. We thank Usama Bin Sikandar for help with
analysis.

Competing interests

No competing interests declared.

Funding

This work was supported by a National Science Foundation Postdoctoral Research Fellowship in
Biology (DBI-1812107) to B.A., NSF Faculty Early Career Development Award (Award no. 1554790) to
S.S. and grants from the Swedish Research Council (Grant no. 2016-04014) and the Air Force Office
of Scientific Research (Award no. FA9550-12-1-0237) to E.W.

Author contributions

Conceptualization: A.S., K.K.; Methodology: A.S., S.S.; Validation: K.K., A.S.; Formal analysis: K.K., A.S.,
B.A., S.S.; Investigation: K.K.; Resources: S.S., A.S., E.W.; Data curation: K.K., A.S.; Writing - original
draft: A.S.; Writing - review & editing: A.S., K.K., E.W., S.S., B.A.; Visualization: A.S.; Project
administration A.S.; Supervision: A.S., S.S.; Funding acquisition: E.W., S.S., B.A.

Data availability

Data supporting the presented results is available at Figshare
(https://figshare.com/s/73ad11df08567ea76d9d). The custom-written MATLAB-code used to analyse
the data and prepare the figures is available from the corresponding author upon request.

 Journal of Experimental Biology • Accepted manuscript
References
Cartar, R. V. (1992), ‘Morphological senescence and longevity: An experiment relating wing wear and
life span in foraging wild bumble bees’, Journal of Animal Ecology 61(1), 225–231.

Combes, S. A., Crall, J. D. & Mukherjee, S. (2010), ‘Dynamics of animal movement in an ecological
context: dragonfly wing damage reduces flight performance and predation success.’, Biology Letters
6(3), 426–429.

Cowan, N. J., Ankarali, M. M., Dyhr, J. P., Madhav, M. S., Roth, E., Sefati, S., Sponberg, S., Stamper,
S. A., Fortune, E. S. & Daniel, T. L. (2014), ‘Feedback control as a framework for understanding
tradeoffs in biology’, Integrative and Comparative Biology. icu050.

Dahake, A., Stöckl, A. L., Foster, J. J., Sane, S. P. & Kelber, A. (2018), ‘The roles of vision and antennal
mechanoreception in hawkmoth flight control’, eLife 7, e37606.

Dakin, R., Segre, P. S., Straw, A. D. & Altshuler, D. L. (2018), ‘Morphology, muscle capacity, skill, and
maneuvering ability in hummingbirds’, Science 359(6376), 653–657.

Dudley, R. (2000), The Biomechanics of Insect Flight: Form, Function, Evolution, Princeton University
Press.

Ellington, C. P. (1984a), ‘The aerodynamics of hovering insect flight. II. morphological parameters’,
Philosophical Transactions of the Royal Society of London. B, Biological Sciences 305(1122), 17–40.

Ellington, C. P. (1984b), ‘The aerodynamics of hovering insect flight. III. kinematics’, Philosophical
Transactions of the Royal Society of London. B, Biological Sciences 305(1122), 41–78.

Ellington, C. P. (1984c), ‘The aerodynamics of hovering insect flight. VI. lift and power requirements’,
Philosophical Transactions of the Royal Society of London Series B 305, 145–181.

 Journal of Experimental Biology • Accepted manuscript
Ellington, C. P. & Lighthill, M. J. (1984a), ‘The aerodynamics of hovering insect flight. I. the quasi-
steady analysis’, Philosophical Transactions of the Royal Society of London. B, Biological Sciences
305(1122), 1–15.

Ellington, C. P. & Lighthill, M. J. (1984b), ‘The aerodynamics of hovering insect flight. IV. aerodynamic
mechanisms’, Philosophical Transactions of the Royal Society of London. B, Biological Sciences
305(1122), 79–113.

Farina, W. M., Varjú, D. & Zhou, Y. (1994), ‘The regulation of distance to dummy flowers during
hovering flight in the hawk moth Macroglossum stellatarum’, Journal of Comparative Physiology A
174(2), 239–247.

Fernández, M. J., Driver, M. E. & Hedrick, T. L. (2017), ‘Asymmetry costs: effects of wing damage on
hovering flight performance in the hawkmoth Manduca sexta.’, The Journal of experimental biology
220, 3649–3656.
Fernández, M. J., Springthorpe, D. & Hedrick, T. L. (2012), ‘Neuromuscular and biomechanical
compensation for wing asymmetry in insect hovering flight.’, Journal of Experimental Biology 215(Pt
20), 3631–3638.

Gau, J., Gravish, N. & Sponberg, S. (2019), ‘Indirect actuation reduces flight power requirements in
Manduca sexta via elastic energy exchange’, Journal of The Royal Society Interface
16(161), 20190543.

Greeter, J. S. M. & Hedrick, T. L. (2016), ‘Direct lateral maneuvers in hawkmoths.’, Biology open
5, 72–82.

Haas, C. A. & Cartar, R. V. (2008), ‘Robust flight performance of bumble bees with artificially induced
wing wear’, Canadian Journal of Zoology 86(7), 668–675.

Hedenström, A., Ellington, C. P. & Wolf, T. J. (2001), ‘Wing wear, aerodynamics and flight energetics
in bumblebees (Bombus terrestris): an experimental study’, Functional Ecology 15(4), 417–422.

Hedrick, T. L. (2008), ‘Software techniques for two- and three-dimensional kinematic measurements
of biological and biomimetic systems.’, Bioinspir Biomim 3(3), 034001.

Hedrick, T. L., Cheng, B. & Deng, X. (2009), ‘Wingbeat time and the scaling of passive rotational
damping in flapping flight.’, Science 324, 252–255.

Henningsson, P. & Bomphrey, R. J. (2013), ‘Span efficiency in hawkmoths.’, Journal of the Royal
Society, Interface 10(84), 20130099.

Kingsolver, J. G. (1999), ‘Experimental analyses of wing size, flight, and survival in the western white
butterfly’, Evolution 53(5), 1479–1490.

Mountcastle, A. M., Alexander, T. M., Switzer, C. M. & Combes, S. A. (2016), ‘Wing wear reduces
bumblebee flight performance in a dynamic obstacle course’, Biol. Lett. 12(6), 20160294.

 Journal of Experimental Biology • Accepted manuscript
Olsen, A. M. & Westneat, M. W. (2015), ‘Stereomorph: an R package for the collection of 3D
landmarks and curves using a stereo camera set-up’, Methods Ecol. Evol. 6(3), 351–356.

Pittaway, A. (1993), The Hawkmoths of the Western Palearctic, Harley Books, Colchester, UK.

Roth, E., Hall, R. W., Daniel, T. L. & Sponberg, S. (2016), ‘Integration of parallel mechanosensory and
visual pathways resolved through sensory conflict’, Proceedings of the National Academy of Sciences
113, 12832–12837.

Roth, E., Sponberg, S. & Cowan, N. J. (2014), ‘A comparative approach to closed-loop computation.’,
Curr. Opin. Neurobiol. 25, 54–62.

Roth, E., Zhuang, K., Stamper, S. A., Fortune, E. S. & Cowan, N. J. (2011), ‘Stimulus predictability
mediates a switch in locomotor smooth pursuit performance for eigenmannia virescens.’, J. Exp. Biol.
214, 1170–1180.

Schindelin, J., Arganda-Carreras, I., Frise, E., Kaynig, V., Longair, M., Pietzsch, T., Preibisch, S.,
Rueden, C., Saalfeld, S., Schmid, B., Tinevez, J.-Y., White, D. J., Hartenstein, V., Eliceiri, K., Tomancak,
P. & Cardona, A. (2012), ‘Fiji: an open-source platform for biological-image analysis’, Nat. Methods
9, 676–682.

Sponberg, S., Dyhr, J. P., Hall, R. W. & Daniel, T. L. (2015), ‘Insect flight. luminance-dependent visual
processing enables moth flight in low light.’, Science 348(6240), 1245–1248.

Sprayberry, J. D. H. & Daniel, T. L. (2007), ‘Flower tracking in hawkmoths: behavior and energetics.’,
J. Exp. Biol. 210(Pt 1), 37–45.

Stöckl, A. L. & Kelber, A. (2019), ‘Fuelling on the wing: sensory ecology of hawkmoth foraging.’, J.
Comp. Physiol. A Neuroethol. Sens. Neural. Behav. Physiol. 205, 399-413.

Stöckl, A. L., Kihlström, K., Chandler, S. & Sponberg, S. (2017), ‘Comparative system identification of
flower tracking performance in three hawkmoth species reveals adaptations for dim light vision’,
Philosophical Transactions of the Royal Society B: Biological Sciences 372(1717), 20160078.

Syme, D. A. (2002), ‘How to build fast muscles: Synchronous and asynchronous designs’, Integrative
and Comparative Biology 42, 762–770.

Usherwood, J. R. & Ellington, C. P. (2002), ‘The aerodynamics of revolving wings ii. propeller force
coefficients from mayfly to quail’, Journal of Experimental Biology 205(11), 1565–1576.

Voigt, C. C. (2013), ‘Bat flight with bad wings: is flight metabolism affected by damaged wings?’,
Journal of Experimental Biology 216(8), 1516–1521.

Warton, D. I., Wright, I. J., Falster, D. S. & Westoby, M. (2006), ‘Bivariate line-fitting methods for
allometry.’, Biol. Rev. Camb. Philos. Soc. 81(2), 259–291.

Willmott, A. P. & Ellington, C. P. (1997a), ‘The mechanics of flight in the hawkmoth Manduca sexta. I.
kinematics of hovering and forward flight.’, J. Exp. Biol. 200(Pt 21), 2705–2722.

 Journal of Experimental Biology • Accepted manuscript
Willmott, A. P. & Ellington, C. P. (1997b), ‘The mechanics of flight in the hawkmoth Manduca sexta.
II. aerodynamic consequences of kinematic and morphological variation.’, J. Exp. Biol. 200(Pt
21), 2723–2745.
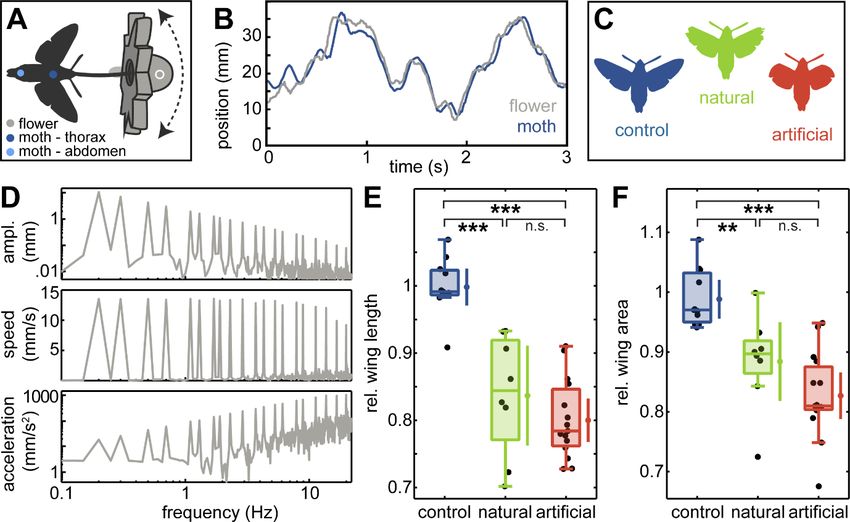
Figures

Fig. 1 The role of wing damage on hawkmoth flight performance. A We tested how wing damage affects
hawkmoth flight performance in a naturalistic flight control task, using an artificial flower (48 mm
diameter) that was attached to a stepper-motor via a rod. To test the manoeuvrability of the animals, we
moved the robotic flower while the animals were hover-feeding from the nectary, and thus attempted to
track the flower to continue feeding. B Example flower and hawkmoth (thorax) positions in the axis of
flower movement during a 3 s (out of a total of 20 s) stimulus sequence . C To study the effect of wing
damage on flight and flower tracking performance, we compared a control group with intact wings (n=11)

 Journal of Experimental Biology • Accepted manuscript
to a group with natural wing damage (n=8), and an artificial damage group (n=15) in which we clipped the
distal forewings to the maximum extent possible that allowed the animals to fly. D The flower was moved
using a superposition of sine-wave stimuli comprised of different temporal frequencies. The amplitudes of
flower movements (upper panel) were adjusted to keep the velocity (middle panel) at the different
frequencies constant, which resulted in an increase of flower acceleration with temporal movement
frequency (lower panel) E-F Forewing length and forewing area were normalised by the expected forewing
length and area given each animal’s body length (see Methods, Fig. 1 – S1D,E). Black dots denote individual
hawkmoths, boxplots depict the median and 25th and 75th percentiles of the samples. Whiskers represent
the data range excluding outliers (values extending 1.5 interquartile ranges beyond the upper and lower
box limits). Statistical differences between groups are indicated as: *** p < 0.001, ** p < 0.01, * p < 0.05,
n.s. p > 0.05 (ANOVA with Tukey's HSD corrected post-hoc test was performed after testing the normality
of residuals, Table S1). The dots next to each boxplot show the data’s mean, and the lines around them the
95% confidence intervals around the mean.
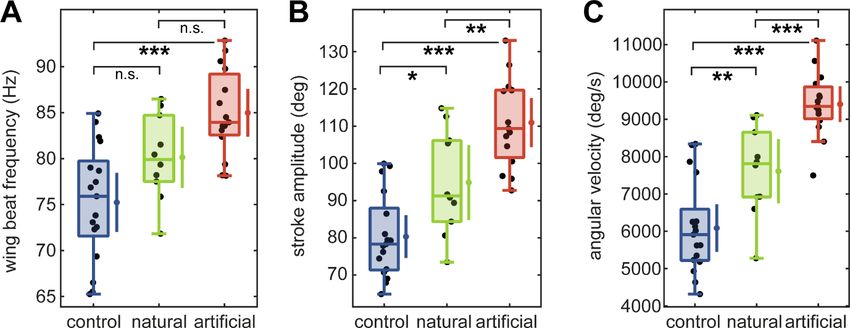
Fig. 2. Wing beat parameters of the three treatment groups. A Wing beat frequency and B horizontal
projection of wing stroke amplitude measured during a hovering at the flower stimulus. C Wing stroke
velocity was calculated as the product of wing beat frequency and amplitude. Statistical differences
between groups are indicated as: *** p < 0.001, ** p < 0.01, * p < 0.05, n.s. p > 0.05 (ANOVA with Tukey's
HSD corrected post-hoc test was performed after confirming normality of residuals, Table S1, control: n=17,
natural: n=10, artificial: n=15). The dots next to each boxplot show the data’s mean, and the lines around
them the 95% confidence intervals around the mean.

 Journal of Experimental Biology • Accepted manuscript
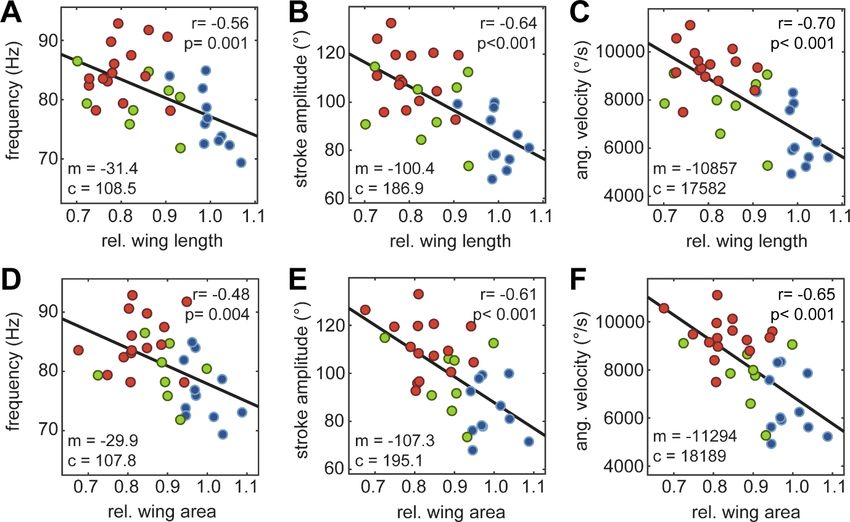
Fig. 3 Linear relationship between wing beat kinematics and wing anatomy. Ordinary least square
regression of wing beat frequency (A,D), horizontal projection of wing stroke amplitude (B,E) and wing beat
velocity (C,F) with the relative forewing length (A-C) and area (D-F). The strength of the linear correlation
is given by r, and the statistical significance of the Pearson correlation coefficient by p. The model for the
linear fit with slope m and intercept c is given in each panel (control: n=11, natural: n=8, artificial: n=15),
the units of these parameters are the same as the y-axis units.

 Journal of Experimental Biology • Accepted manuscript
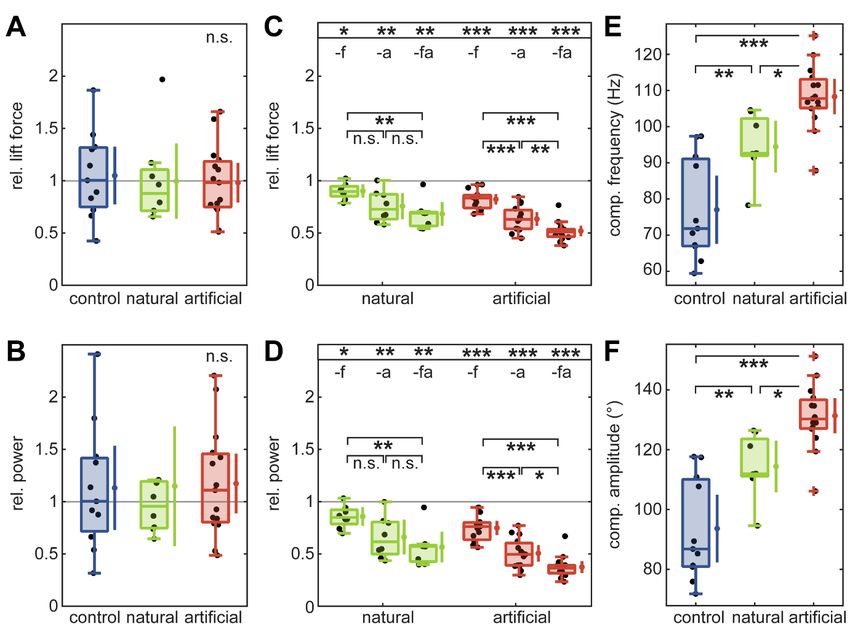
Fig. 4 Estimated lift generated, and mechanical power required for flapping. We calculated the lift force
generated during hovering (A) for the three treatment groups, as well as the mechanical power (B) required
for flapping, based on their wing shape, wing beat frequency and wing stroke amplitude in the wing stroke
plane. Results were normalised relative to the median of the control group. We compared the estimated
lift force (C) and mechanical power (D) within each treatment for three scenarios: with the measured wing

 Journal of Experimental Biology • Accepted manuscript
beat amplitude (transformed to the stroke plane) and the median wing beat frequency of the control group
(-f), with the measured frequency and median amplitude of the control group (-a) and with both median
frequency and amplitude of the control (-fa). For each treatment, the resulting lift force and power
predictions were normalised by the treatments predictions based on the measured parameters. Using the
fixed median wing stroke amplitude of the control group, we calculated the wing beat frequency required
to generate the same lift as with both the measured amplitude and frequency (E), and vice versa for the
wing stroke amplitude (F). Statistical differences between groups are indicated as: *** p < 0.001, ** p <
0.01, * p < 0.05, (ANOVA with Tukey's HSD corrected post-hoc test was performed after confirming
normality of residuals, see Table S1, control: n=11, natural: n=8, artificial: n=15). In C and D, a Wilcoxon
signed rank test was used to compare the median of each group with 1: *** p < 0.001, ** p < 0.01, * p <
0.05, n.s. p > 0.05, see Table S2B. The dots next to each boxplot show the data’s mean, and the lines around
them the 95% confidence intervals around the mean.
You can also read