Non-respiratory Particles Emitted by Guinea Pigs in Airborne Disease Transmission Experiments - Research Square
←
→
Page content transcription
If your browser does not render page correctly, please read the page content below
Non-respiratory Particles Emitted by Guinea Pigs in Airborne Disease Transmission Experiments Sima Asadi University of California, Davis Manilyn J. Tupas University of California, Davis Ramya S. Barre Icahn School of Medicine at Mount Sinai Anthony S. Wexler University of California, Davis Nicole M. Bouvier Icahn School of Medicine at Mount Sinai William D. Ristenpart ( wdristenpart@ucdavis.edu ) University of California, Davis Research Article Keywords: Animal models, aerosolized fomites, non-negligible fraction, Aerodynamic Particle Sizer (APS) Posted Date: March 16th, 2021 DOI: https://doi.org/10.21203/rs.3.rs-272834/v1 License: This work is licensed under a Creative Commons Attribution 4.0 International License. Read Full License
1 Non-respiratory Particles Emitted by Guinea Pigs in Airborne
 2 Disease Transmission Experiments
 3 Sima Asadi1†, Manilyn J. Tupas1, Ramya S. Barre2‡, Anthony S. Wexler3,4,5,6,
 4 Nicole M. Bouvier2,7, and William D. Ristenpart1*

 1
 5 Dept. of Chemical Engineering, University of California Davis, One Shields Ave., Davis, CA 95616 USA.
 2
 6 Dept. of Microbiology, Icahn School of Medicine at Mount Sinai, 1 Gustave L. Levy Place, New York, NY
 7 10029 USA.
 3
 8 Dept. of Mechanical and Aerospace Engineering, University of California Davis, One Shields Ave., Davis,
 9 CA 95616, USA.
 4
10 Air Quality Research Center, University of California Davis, One Shields Ave., Davis, CA 95616 USA.
 5
11 Dept. of Civil and Environmental Engineering, University of California Davis, One Shields Ave., Davis,
12 CA 95616, USA.
 6
13 Dept. of Land, Air and Water Resources, University of California Davis, One Shields Ave., Davis, CA
14 95616, USA.
 7
15 Dept. of Medicine, Div. of Infectious Diseases, Icahn School of Medicine at Mount Sinai, 1 Gustave L.
16 Levy Place, New York, NY 10029 USA.

17 † Present address: Department of Chemical Engineering, Massachusetts Institute of Technology, 77
18 Massachusetts Ave., Cambridge, MA 02139 USA.

19 ‡ Present address: Department of Ecology and Evolutionary Biology, 304 Guyot Hall, Princeton
20 University, Princeton, NJ 08544 USA.

21 *Corresponding author: William D. Ristenpart, Dept. of Chemical Engineering, University of California
22 Davis, One Shields Ave., Davis, CA 95616 USA, (530) 752-8780, wdristenpart@ucdavis.edu

 1
23 Abstract

24 Animal models are often used to assess the airborne transmissibility of various pathogens,

25 which are typically assumed to be carried by expiratory droplets emitted directly from the

26 respiratory tract of the infected animal. We recently established that influenza virus is also

27 transmissible via “aerosolized fomites,” micron-scale dust particulates released from virus-

28 contaminated surfaces (Asadi et al., Nature Communications, 2020). Here we expand on this

29 observation, by counting and characterizing the particles emitted from guinea pig cages using an

30 Aerodynamic Particle Sizer (APS) and an Interferometric Mie Imaging (IMI) system. Of over

31 9,000 airborne particles emitted from guinea pig cages and directly imaged with IMI, none had an

32 interference pattern indicative of a liquid droplet. Separate measurements of the particle count

33 using the APS indicate that particle concentrations spike upwards immediately following animal

34 motion, then decay exponentially with a time constant commensurate with the air exchange rate in

35 the cage. Taken together, the results presented here raise the possibility that a non-negligible

36 fraction of airborne influenza transmission events between guinea pigs occurs via aerosolized

37 fomites rather than respiratory droplets, though the relative frequencies of these two routes have

38 yet to be definitively determined.

39 Introduction

40 The physical pathways governing airborne disease transmission remain poorly understood, in

41 part due to the lack of quantitative data on the number of pathogens emitted by infected individuals

42 and then inhaled by susceptible individuals1-4. Because of the difficulty of performing controlled

43 infectious disease transmission experiments with human subjects, animal models have been

44 instead widely used to perform transmission experiments with influenza viruses5-14, and less often

45 with other microorganisms that can travel through the air to infect the respiratory tract of a
46 susceptible host, including Mycobacterium tuberculosis15, Ebola virus16, and SARS-CoV-217,18.

47 Typically, an animal inoculated with the pathogen is placed in a separate cage in the vicinity of a

48 naïve, uninfected partner animal such that air can circulate freely through both cages, but direct

49 and indirect contact between the partner animals is precluded. If the naïve animal becomes

50 infected, the pathogen is considered to be transmissible by an airborne route.

51 The usual implicit assumption with respiratory viruses like influenza virus or SARS-CoV-2 is

52 that respiratory emissions from the infected animal carry the pathogen to the susceptible animal.

53 Many authors explicitly refer to the airborne pathogen transporters as “respiratory droplets”9,11,19-
 21
54 ; however, in most indoor human environments, water-laden droplets in the micron-scale range

55 rapidly evaporate within seconds after exhalation to become “droplet nuclei,” the residual, non-

56 volatile proteins, lipids, and salts in respiratory fluid22,23. It is these droplet nuclei, sometimes also

57 called “aerosols,” which may remain airborne for long periods of time before eventually being

58 inhaled into the respiratory tract of a susceptible host. The relative frequency of transmission via

59 large respiratory droplets versus smaller droplet nuclei remains unknown. However, the

60 conventional experimental setup used to test airborne virus transmission in animal models does

61 not conclusively prove that the virus infecting the susceptible animal was directly exhaled into the

62 air by the inoculated animal. It establishes that a pathogen is airborne-transmissible, but does not

63 establish the composition or origin of the airborne particles transmitting the pathogen.

64 Recent work by our team in the guinea pig model24 established that influenza is transmissible

65 through the air on “aerosolized fomites,” the name given to microscopic particles emitted from

66 virus-contaminated surfaces such as skin, fur, or bedding. We used an aerodynamic particle sizer

67 (APS) and video recordings to establish quantitatively that the vast majority of particles emitted

68 from a guinea pig cage are environmental dust, not respiratory droplets. We showed that, even in
69 the absence of a donor animal with active respiratory tract infection, influenza virus in the

70 environment could become airborne and transmit to a susceptible recipient guinea pig nearby, and

71 also that aerosolized fomites could be readily generated from friable materials like virus-

72 contaminated facial tissues. These observations strongly suggest that some unknown fraction of

73 transmission events observed in the guinea pig model are due to aerosolized fomites, rather than

74 expiratory droplets, as is commonly assumed.

75 In this work we provide more details about the nature and origin of the airborne particles

76 emanating from guinea pig cages. We designed an experimental setup based on Interferometric

77 Mie Imaging (IMI)25-29 to quantify the number of aerosol particles emitted from guinea pig cages

78 and to qualitatively characterize these particles by examining the interference patterns made by

79 light waves reflected and refracted by the particles as they pass through a laser sheet 30. With IMI,

80 spherical, homogenous, and transparent particles, including liquid droplets, yield regular fringes

81 in the out-of-focus wave-interference patterns captured by a camera as the laser sheet illuminates

82 the droplets27,28. Nontransparent solid, partially liquid, or heterogeneous objects, in contrast, yield

83 complicated speckle patterns with no clear fringe spacing31, allowing IMI to discriminate between

84 liquid droplets and solid or mixed particulates in the air. We also used an Aerodynamic Particle

85 Sizer (APS) to measure the number and size distribution of airborne particles sampled from guinea

86 pig cages under various experimental conditions. Preliminary results with the APS were reported

87 previously24; here we add an independent measuring technique, IMI, to compare with APS data

88 and expand upon our analyses of the dynamics of airborne particle generation by awake and

89 anesthetized guinea pigs used in modeling the airborne transmission of influenza viruses.
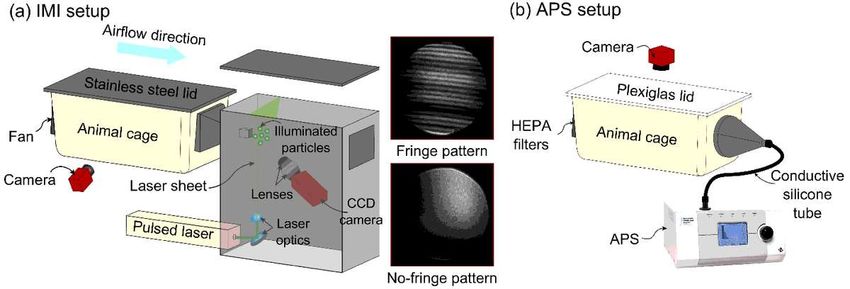
90 Experimental methods

 91 IMI setup

 92 An experimental apparatus was designed to count and qualitatively characterize the aerosol

93 particles emitted from an animal cage using IMI (Fig. 1a and Fig. S1a). This technique involves

 94 the capture of out-of-focus images of the particles illuminated in a laser sheet. Interference between

 95 the light reflected by and refracted in a transparent sphere, such as a water droplet, yields a pattern

 96 of evenly spaced fringes, the width of which is inversely proportional to the droplet size26,29. Our

 97 experimental apparatus consisted of a standard animal cage (26.7 cm × 48.3 cm × 20.3 cm)

 98 connected to an enclosed black box (22 cm × 44 cm × 46 cm) containing the optical equipment. A

 99 532 nm single-pulsed laser beam (Nd:YAG Nano L 20-290 Litron, max pulse rate = 20 Hz, pulse

100 length = 1 ns) was directed inside the box and converted to a laser sheet (5mm thickness) with a

101 mirror and laser line generator. During the experiment, a fan mounted inside the guinea pig cage

102 pushed airborne particles toward the laser sheet through a 2.54 cm × 2.54 cm hole. A charge-

103 coupled device (CCD) camera (Allied Vision Prosilica) and two camera lenses (Zeiss Planar

104 T*85mm f/1.4) captured the out-of-focus images of the particles illuminated in the laser sheet. The

105 lenses were attached together at the front of the camera, capturing an area of 8.7 mm × 7 mm and

106 enabling measurement of particle size down to 2 μm in diameter29. Because the aperture was

107 approximately 4 times larger than this field of view, our setup did not measure 100% of the

108 particles and the particle emission rates reported here do not represent the absolute number of

109 particles emitted from the cage. For laser safety reasons, and also to minimize background light

110 contamination, a light-absorbing blackout curtain was wrapped around the guinea pig cage (not

111 shown). A second webcam camera (Logitech HD webcam C310) was placed inside the curtain to

112 capture side view images of the guinea pig inside the cage at 1 image per second, and standard
113 image analysis techniques were used to track the motion of the guinea pig24. Red LED lights

114 illuminated the guinea pigs without interfering with acquisition of particle images. Fig. S1b and

115 Fig. S1c show representative image analyses of detected guinea pigs (green lines) and their

116 corresponding centroids (red circles). Guinea pig movement velocity was calculated by measuring

117 the change in position of the centroid between consecutive time-lapse photographs.

118 Simultaneously, the CCD camera inside the black box recorded out-of-focus images of particles

119 illuminated by laser sheet at an acquisition rate of 10 images per second.

120 Before starting the experiment, the setup was tested with deionized water droplets generated

121 using a humidifier (AGPtek Mini USB air mist humidifier) and also droplets emitted from human

122 speech released approximately 3 cm away from the laser sheet, in a manner similar to that reported

123 previously.30 In both cases, we observed two interference patterns (Fig. 1a): regularly spaced light

124 fringes, indicating transparent droplets larger than 2 µm in diameter, or a single, uniformly bright

125 fringe in images of droplets smaller than 2 µm.

126 The following experiments were performed:

127 (i) An uninfected, unrestrained guinea pig on dried corncob (CC) bedding was placed inside

128 the measurement cage, and cage air was sampled for 60 minutes (Fig. S1b). Before placing the

129 guinea pig in the cage, background particles were measured for 30 minutes (No GP (background)).

130 (ii) The CC bedding was replaced with bedding made of polar fleece (PF)-covered absorbent

131 pads (Fisherbrand Universal All-Purpose Absorbent Pads, Fisher Healthcare). All other conditions

132 were similar to the CC bedding experiment (Fig. S1c).

133 (iii) An anesthetized, uninfected guinea pig was used to characterize the airborne particles

134 produced by tidal breathing. After anesthetizing the guinea pig, it was placed inside a plastic bag

135 to prevent the aerosolization of dander and fur (Fig. S1d), and the expiratory particles were
136 collected through a small hole made for the guinea pig’s nose (Fig. S1e). The plastic bag containing 137 the anesthetized guinea pig was placed in the empty cage on a platform about 8 cm away from the 138 laser sheet with its nose facing toward the laser sheet. Before placing the anesthetized guinea pig, 139 the empty cage background particles were measured for 60 minutes. 140 Food and water were provided for awake guinea pigs during the measurements; for 141 anesthetized guinea pigs, food, water, and bedding were removed from the cage. Each experiment 142 was repeated three times each for three guinea pigs, denoted as GP1, GP2, and GP3. To compare 143 the particle emission rates for different conditions in a manner consistent with our prior work24, 144 ̅(15) . The particle we time-averaged the particle emission rates over 15-minute periods, denoted as 145 emission rates reported for awake guinea pigs are the average of four 15-minute periods, each 146 acquired over an hour, with three individual hour-long trials per guinea pig, yielding a total sample 147 size of 4 × 3 × 3 = 36 measurements per experimental condition. To test for correlation between 148 particle emission and animal motion velocity, we time-averaged the particle emission rate ( (1) ) 149 and guinea pig movement velocity ( (1) ) over 1-minute periods. 150 APS setup 151 Preliminary results using the APS were reported previously24; here we provide more details 152 about the dynamics of particle emission and corresponding particle size distributions for trial 153 replicates under various conditions. In brief, the setup consisted of an airtight standard animal cage 154 (26.7 cm × 48.3 cm × 20.3 cm) with a Plexiglas lid connected to an aerodynamic particle sizer 155 (APS, TSI model 3321) through a static dissipative silicon tube (Fig. 1b, Fig. S2). The setup was 156 placed inside a biosafety cabinet (NUAIRE, NU-430 Class II Type B2) to minimize the 157 background particle concentration. The APS pulls the air at a total flow rate of 5 L/min (sheath 158 flow rate 4 L/min, sample flow rate 1 L/min) through two HEPA filters attached to the cage,
159 and records the number and size of particles between 0.5–20 µm in diameter. It also counts but

160 cannot size particles between 0.37–0.5 μm, due to limits in resolution. The APS acquisition time

161 was set to report the cumulative number of particles detected per second. A camera positioned

162 above the cage captured time-lapse photographs at 1 image per second, and guinea pig movement

163 velocity was calculated as described above. The following experiments with different types of

164 bedding (see Fig. S1 of Asadi et al. 24) were performed:

165 (i) Similar to the IMI setup experiments, an unrestrained, uninfected guinea pig was placed in

166 the measurement cage on CC bedding during a 60-minute air sampling. Cage background particle

167 count was also measured for 60 minutes before placing the guinea pig in the cage (No GP

168 (background)).

169 (ii) CC bedding was replaced with PF bedding, and all other conditions were similar to the CC

170 bedding experiment.

171 (iii) The bedding was removed from the cage (No bedding), and all other conditions were

172 similar to the CC and PF bedding experiments.

173 (iv) To measure the expiratory particles released from a guinea pig inoculated with influenza

174 A virus, an anesthetized animal was placed inside an aluminum sleeve (20 cm × 10 cm × 10 cm)
 24
175 with a small hole (3.5cm in diameter) for its nose (see Fig. S4 of Asadi et al. ), to minimize

176 background particles such as fur or dander. The aluminum sleeve replaced the plastic bag used in

177 the IMI setup to decrease any potential influence of static charge. The aluminum sleeve was then

178 placed inside the measurement cage with the guinea pig’s nose directly facing a stainless-steel

179 funnel attached to the APS inlet. The measurements were performed at 0, 1, 2, and 3 days post-

180 inoculation (dpi); on 0 dpi, the measurements were taken before virus inoculation.
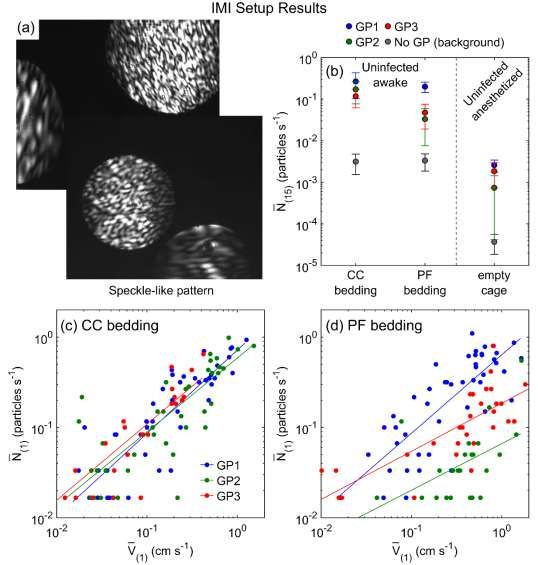
181 (v) As a negative control, the experiment described above (iv) was repeated after each guinea

182 pig was humanely euthanized and then placed inside the aluminum sleeve.

183 Food and water were provided for unrestrained, awake guinea pigs during measurements; with

184 anesthetized or euthanized guinea pigs, no food, water or bedding was present in the cage. Each

185 experiment with APS setup was performed once with three different guinea pigs denoted as GP4,

186 GP5, and GP6.

187 Virology and animals

188 All procedures were performed in strict accordance with the recommendations in the Guide

189 for the Care and Use of Laboratory Animals, and the research protocol was approved by the Icahn

190 School of Medicine at Mount Sinai Institutional Animal Care and Use Committee (IACUC

191 protocol #2014-0178). Reporting in this manuscript follows recommendations in the ARRIVE

192 guidelines. All methods for viruses, plaque assays, and guinea pigs used for the experiments

193 reported here are identical to our previous work24; interested readers are referred there for details.

194 The primary focus here is on the characterization of the aerosol particles emitted from the cage.

195 Results

196 Observation of Speckle-like Pattern for Particles Emitted from an Animal Cage

197 Our preliminary experiments using both deionized water droplets generated by a humidifier,

198 and respiratory droplets released from human speech, established that our IMI setup could

199 successfully capture micron-scale liquid droplets (Fig. 1a).

200 Over a cumulative total of 18 hours of observation time with 3 awake, unrestrained guinea

201 pigs, our IMI system recorded a total of 9,046 airborne particles emanating from the measurement

202 cage, all of which had speckled patterns (Fig. 2a), consistent with particulates that either are non-

203 spherical or have non-homogenous index of refraction. Likewise, for the anesthetized, stationary
204 animals, over a cumulative total of 9 hours of observation time with 3 different animals, we

205 observed a total of 56 objects, all of which again had speckled patterns. We did not observe any

206 airborne particles with clear fringes, which would be characteristic of a liquid droplet >2 μm, nor

207 any that were uniformly bright, suggesting a droplet
227 was only 8.7 mm × 7 mm, so this setup does not necessarily capture all of the emitted particles.

228 Nonetheless, the IMI data indicate that one to two orders of magnitude more particulates were

229 emitted from the cage by awake mobile guinea pigs in comparison to the background level, with

230 slightly more particulates emitted from guinea pigs in cages with CC bedding than PF bedding.

231 Next, to measure the number of expiratory particles and minimize the background fur and dander

232 particulates, we anesthetized the guinea pigs and placed them individually in a plastic bag with a

233 ̅(15) for
 small opening for the guinea pig nose. The results (Fig. 2b) demonstrated that

234 anesthetized guinea pigs (~0.002 particles/s) is two orders of magnitude lower than awake mobile

235 guinea pigs (~0.14 particles/s). There was only a small difference between the particle emission

236 rates for the anesthetized guinea pig when mostly covered in plastic and the background particles

237 for a cage with the bedding but no guinea pig

238 Post-processing of the images captured to track guinea pig movement in the cage allowed

239 calculation of the guinea pig velocity within the cage. The time-averaged particle emission rate

240 ̅(1) vs. ̅(1) ) is plotted in Figs. 2b and
 versus time-averaged guinea pig velocity over 1 minute (

241 2c, which show that the particle emission rate as measured by IMI is correlated with guinea pig

242 movement velocity for both CC bedding (Fig. 2c) and PF bedding (Fig. 2d) experiments. These

243 results indicate that increased guinea pigs motion yielded more aerosolized particles, suggesting

244 that the majority of particles emitted from a guinea pig cage are environmental dust or dander

245 rather than expiratory particles.

246 Observation of Bimodal Size Distribution for Particles Emitted from an Animal Cage

247 Due to the lack of fringes in the observed (inhomogeneous and/or non-spherical) particulates,

248 the IMI apparatus was unable to obtain any particle size measurements. Instead, we performed

249 complementary experiments with the APS, which has increased spatial and temporal resolution
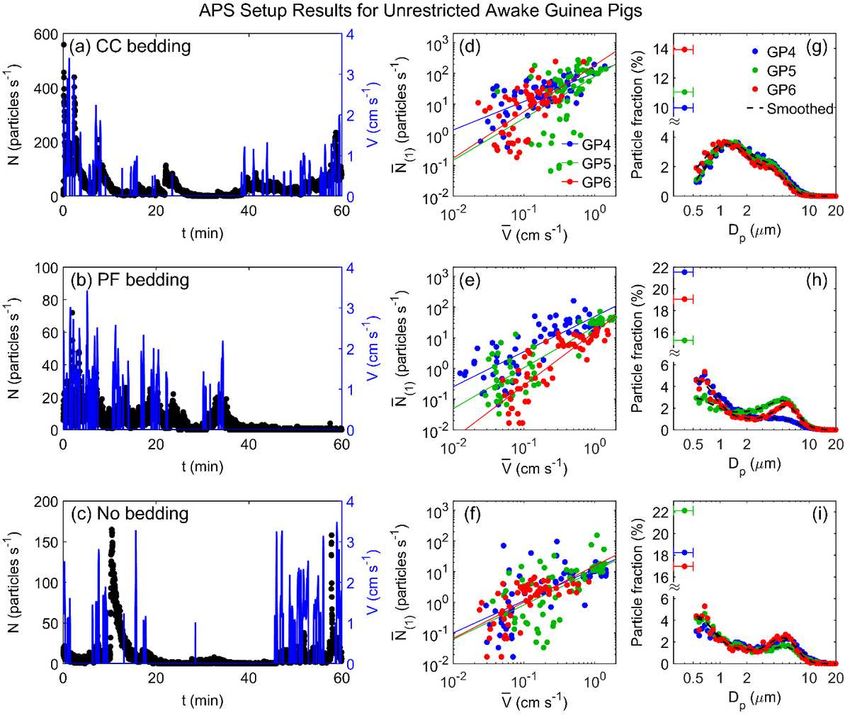
250 for counting and sizing aerosol particles (albeit without yielding information about particle

251 composition). Some APS data were already reported previously24; here we provide more details

252 regarding the size distributions, velocity correlations, and exponential decay behavior of the

253 concentration spikes. Fig. 3 shows representative measurements of the instantaneous particle

254 emission rate, , and concurrent guinea pig movement velocity, , versus time, for an awake

255 uninfected guinea pig placed in the measurement cage with CC bedding (Fig. 3a), PF bedding (Fig.

256 3b), or no bedding (Fig. 3c). These data clearly indicate that whenever the guinea pig moves, there

257 is a spike in particle emission rate, and after the guinea pig ceases moving, the particle emission

258 rate decreases gradually to the background level unless interrupted by another burst of motion.

259 Notably, there is little evidence of the converse situation: we do not observe any appreciable

260 spikes in the particle concentration without a preceding burst of animal motion. Scatter plots of

261 ̅(1) ) versus the time-averaged guinea pig velocity ( ̅(1) )
 the time-averaged particle emission rates (

262 yield positive correlations (Fig. 3d to Fig. 3f) similar to the trend observed with the IMI setup, for

263 all three guinea pigs tested and all three bedding types. In other words, two completely separate

264 measurement techniques yielded positive correlations between particle counts and animal motion.

265 The corresponding size distributions of particles emitted from the cage, measured in the range

266 of 0.5 to 20 μm in diameter, are shown in Fig. 3g to Fig. 3i. The CC bedding measurements (Fig.

267 3g) exhibit a bimodal distribution, with count mean diameters at approximately 1 μm and 3.5 μm.

268 For PF bedding (Fig. 3h) and no bedding (Fig. 3i) the bimodal distribution is preserved, although

269 the first peak is shifted toward smaller sizes (approximately 0.5 μm), while the second peak is

270 shifted toward larger sizes at approximately 5 μm. The size distribution results suggest that the

271 particles emitted from the animal cage are generated from more than one source; the change in
272 peak sizes with respect to the CC bedding (Fig. 3g) versus PF bedding (Fig. 3h) strongly indicates

273 that particulates from the bedding itself comprises a substantial fraction of the aerosolized matter.

274 As with the IMI setup, we sought to minimize the dust and dander by anesthetizing and

275 enclosing the guinea pigs to hopefully allow quantification of just the guinea pig expiratory

276 particles. Anesthetized guinea pigs were placed individually in an aluminum sleeve with a small

277 hole for its nose, and the sleeve was attached nose first to the funnel inside the measurement cage

278 (see Fig. S4 of Asadi et al24). Air necessarily flowed past the animal body in this configuration,

279 but there was no motion besides the animal respiration. Fig. 4a to Fig. 4c show the particle

280 emission rate during 30 minutes of air sampling from uninfected anesthetized guinea pigs (0 dpi)

281 and inoculated guinea pigs 1, 2 and 3 days post inoculation. Prior to placing the animal in the

282 apparatus, the particle count was close to zero, i.e., the cage was ‘washed-out’ of particles. Shortly

283 after placing the aluminum sleeve containing the anesthetized guinea pig inside the measurement

284 cage, the number of emitted particles started at a relatively large value then decreased gradually

285 over the next 15 to 20 minutes. Particle emission rates for two of the guinea pigs (GP4 and GP6)

286 were only slightly higher at 2 and 3 dpi. The corresponding size distributions, extracted from the

287 final 15 minutes of each trial (Fig. 4d to Fig. 4f), indicate that the particulates emitted by the

288 anesthetized animals were on average much smaller than those emitted by active guinea pigs in

289 motion (Fig. 3g – i), with a geometric mean diameter of approximately 0.5µm. Note that the

290 fraction of the smallest particles (between 0.3–0.5 µm) for the anesthetized guinea pigs is

291 significantly higher compared to the awake guinea pigs.

292 It is difficult to interpret the observed decays of particle emission rate in terms of expiratory

293 particles, for two key reasons. First, the particle emission rates from the anesthetized animals decay

294 exponentially, in a manner extremely similar to the decays observed after bursts of motion with
295 the awake mobile guinea pigs. Representative examples for both situations are shown in Fig. 5.

296 Here, we see that the particle rate in either situation is captured well by an exponential decay of

297 the form = 0 − . Notably, the time constant is 0.85 min–1 for awake mobile guinea pig

298 (Fig. 5a), and 0.22 min-1 for anesthetized guinea pig (Fig. 5b), equivalent to characteristic time
 1
299 scale of = = 1.18 min, and 4.55 min, respectively. These time scales are of the same order as

300 what one would expect via a standard mass conservation analysis for well mixed air with an initial

301 concentration being diluted by delivery of fresh air. The volume of the cage when empty is = 26

302 liters, and the flow rate to the APS is = 5 liters per minute, yielding a characteristic time of =

303 / ≈ 5 minutes. In other words, the observed dynamics are entirely consistent with a rapid

304 aerosolization of large quantities of particulates, followed by an exponential decay as the

305 ventilation slowly removes them. Simultaneously, although the respiratory rate does decline during
 34
306 anesthesia by about 25 to 33% , there is no physiological reason to expect that the respiratory

307 rate will decline exponentially and result in such a large decrease in particle emission rate as

308 observed here.

309 The second key reason to interpret the data in terms of dust particulate aerosolization is

310 that our negative control experiments, with humanely euthanized guinea pigs (black points in Fig.

311 4), yielded extremely similar dynamics as alive, tidally breathing guinea pigs (colored points in

312 Fig. 4). The euthanized animals also exhibited exponential decays, albeit with slightly lower

313 magnitudes, and similar size distributions. Since the animals were not respiring, the particles were

314 necessarily all non-expiratory dust and dander particulates. This observation indicates that despite

315 our best effort to eliminate the background dust particles, simply placing the animal inside the

316 apparatus generated an appreciable amount of dust.
317 The variability in the long-time particle emission rates (the final 15 minutes) of Fig. 4a – c

318 complicate efforts to subtract the negative control particle emission rate from the anesthetized

319 animal particle emission rate; at some time points, the anesthetized, respiring animals emitted less

320 particles than the euthanized ones. Even if we ignore this complexity, however, and simply assume

321 that all particles emitted by anesthetized animals are expiratory particles despite the strong

322 evidence to the contrary, they still account for at most 1% of the total particles emitted from an

323 awake, mobile guinea pig. In other words, the data suggest that almost all particles emitted from

324 the guinea pig cage are non-respiratory in origin.

325 Discussion

326 The overarching theme for our results is that a large majority of the particulates emitted from

327 a guinea pig cage appear to be environmental dust, not respiratory droplets. Anesthetized, tidally

328 breathing guinea pigs emitted orders of magnitude fewer particles than were generated by awake,

329 mobile guinea pigs, and, notably, they produced at most only slightly more particles than

330 euthanized guinea pigs under the same conditions. No objects containing fringes consistent with a

331 homogeneous, spherical, liquid droplet larger than 2 µm were observed via the IMI technique,

332 suggesting that, at least in this size range, the airborne particles emitted from guinea pig cages

333 were either solid dust or droplet nuclei of evaporated respiratory droplets. Prior work using IMI

334 with humans focused on speech and coughing30, which are well established to yield orders of

335 magnitude more droplets than nasal breathing35. To our knowledge there is no clear basis of

336 comparison for how many liquid droplets should be expected from guinea pigs during normal tidal

337 breathing. Nonetheless our data indicate that droplet emission from guinea pigs is rare.

338 The positive correlations between animal motion and particle counts, observed independently

339 both with the IMI and APS measurements, indicate that animal motion contributes substantially to
340 the generation of airborne particles by guinea pigs. Likewise, the exponential decay in particle

341 concentrations following bursts of animal motion is also most consistent with environmental dust

342 aerosolization. Taken together, the results suggest that almost all of the particles emitted from a

343 cage containing an awake, mobile guinea pig are aerosolized environmental dust rather than

344 expiratory particles.

345 This observation by itself, however, does not necessarily indicate that these dust particles play

346 any role in influenza virus transmission. Our results do not preclude the possibility that

347 transmission occurs entirely via dried respiratory droplets, and that the large quantities of

348 environmental dust particulates kicked up by animal motion simply confound the measurements.

349 Our prior results, however, confirmed that guinea pigs heavily contaminate their fur and

350 surroundings with influenza virus, and that these contaminated surfaces yield airborne virus

351 capable of infecting susceptible animals in a separate cage24.

352 Influential work by Lowen et al. established that temperature and relative humidity affect the

353 transmissibility of influenza virus between guinea pigs5-7; they found that airborne virus

354 transmission occurred readily at cold temperatures (5 °C) but not at hot temperatures (30 °C). This

355 result spurred much investigation of how temperature affects airborne virus survivability, both in

356 animal models and epidemiologically with people32,36,37. However, these data can be alternatively

357 explained if the ambient temperature affects the amount of animal motion and the consequent

358 generation of aerosolized fomites. Lowen and colleagues observed qualitatively that guinea pigs

359 appeared lethargic at 30 °C 5; quantitatively, guinea pigs have been shown to be twice as active at

360 18 °C than at 30 °C38. More recently, experiments by Koster et al. in the ferret model of influenza

361 virus transmission11 demonstrated that the total concentration of aerosolized particles transmitted

362 to the susceptible recipient ferret’s cage varied by more than two orders of magnitude during the
363 exposure, ranging from 2 to more than 250 particles/cm3. They qualitatively observed that

364 fluctuations in particle transmission rate might relate to observed activity of the donor ferret 11,

365 albeit without any quantitative measurements of animal activity. The qualitative observation

366 nonetheless suggests that ferrets also produce animal-motion induced spikes similar to those we

367 reported recently with guinea pigs24. In combination with prior reports that ferrets contaminate

368 their surrounding dust with virus39, these observations raise the possibility that aerosolized fomites

369 play a significant role in the ferret model.

370 More quantitative details regarding emission from ferrets was provided by Gustin et al., who

371 used an APS to characterize the particles emitted by anesthetized ferrets that were either uninfected

372 or infected with influenza virus9,12; however, they did not perform a negative control experiment

373 to quantify non-respiratory particle emissions, such as from euthanized animals. It remains

374 possible that a substantial fraction of the presumed respiratory particles might not actually have

375 been directly exhaled by the ferret, given our results with anesthetized and euthanized guinea pigs

376 (Fig. 4 and Asadi et al.24). In a more recent study, Zhou et al.14 measured the effect of particle size

377 on the relative efficiency of airborne influenza virus transmission, using impactors to selectively

378 remove particles of a specific size from the air passing between the cages of infected donor and

379 susceptible recipient ferrets. They showed that the transmission efficiency of human influenza

380 declined as the impactor cut-off size was lowered, until no ferret-to-ferret transmission was

381 observed through an impactor that removed airborne particles ≥1.5 µm. However, in a separate

382 series of experiments, they confirmed that fine droplet nuclei less than 1.5 μm in size could infect

383 a susceptible recipient ferret when the virus was artificially aerosolized by a nebulizer. These data

384 suggest that influenza virus-infected ferrets do not generate sufficient amounts of fine, virus-laden

385 droplets to transmit infection; rather, ferret-to-ferret transmission of influenza viruses is mediated
386 by airborne particles larger than 1.5 µm. Similarly, Chan et al. recently demonstrated that the

387 transmission of SARS-CoV-2 was reduced but not eliminated by placing a surgical mask barrier

388 between the cages of infected donor and susceptible recipient hamsters. They noted that surgical

389 masks are most efficient at filtering out larger particles “but not the airborne aerosol particles of

390
409 models, at least 99% of the particles transmitted between two cages, in the size range measured

410 here, may be from sources other than animal’s respiratory tract. Moreover, the results via two

411 independent measurement techniques confirm that particle emission rate from guinea pig cage and

412 guinea pig movement velocity is correlated, and that particle emission rate depends on type of

413 bedding. The data presented here strongly suggests that, when assessing the transmission of

414 respiratory pathogens in animal models, care must be taken to evaluate the relative contributions

415 of expiratory particles and environmental particles and to consider the possibility that transmission

416 occurs at least in part due to aerosolized fomites.

417

418 Funding

419 This research was supported by the National Institute for Allergy and Infectious Diseases

420 (NIAID) of the National Institutes of Health (NIH), grant R01 AI110703 to N.M.B., W.D.R., and

421 A.S.W.

422 Competing interests: The authors declare no competing interests.

423 Data availability: All data is available in the manuscript or the supplementary information.

424 MATLAB codes used for analyzing the data and preparing the figures are available from the

425 corresponding author upon reasonable request.

426 Author contributions: S.A. designed and assembled the experimental apparati. S.A., J.T.,

427 and R.B. performed the experiments, including measurements of particulate emission, time lapse

428 photography, intranasal virus inoculations, and collection and titration of nasal washes. A.S.W.,

429 W.D.R., and N.M.B. conceived the project, and all authors contributed to experimental design.

430 S.A. and W.D.R. analyzed the data and wrote the manuscript. All authors reviewed and revised

431 the manuscript for accuracy and intellectual content.

432
433 References

 1. Weber TP, Stilianakis NI. Inactivation of influenza A viruses in the environment and modes of
 transmission: A critical review. J Infect. 2008;57(5):361-73.
 2. Tellier R. Aerosol transmission of influenza A virus: a review of new studies. J R Soc Interface.
 2009;6:S783-S90.
 3. Tang JW. Investigating the airborne transmission pathway - different approaches with the same
 objectives. Indoor Air. 2015;25(2):119-24.
 4. Luongo JC, Fennelly KP, Keen JA, Zhai ZJ, Jones BW, Miller SL. Role of mechanical ventilation in
 the airborne transmission of infectious agents in buildings. Indoor Air. 2016;26(5):666-78.
 5. Lowen AC, Mubareka S, Steel J, Palese P. Influenza virus transmission is dependent on relative
 humidity and temperature. Plos Pathogens. 2007;3(10):1470-6.
 6. Bouvier NM, Lowen AC, Palese P. Oseltamivir-resistant influenza A viruses are transmitted efficiently
 among guinea pigs by direct contact but not by aerosol. Journal of virology. 2008;82(20):10052-8.
 7. Mubareka S, Lowen AC, Steel J, Coates AL, Garcia-Sastre A, Palese P. Transmission of Influenza Virus
 via Aerosols and Fomites in the Guinea Pig Model. Journal of Infectious Diseases. 2009;199(6):858-
 65.
 8. Lednicky JA, Hamilton SB, Tuttle RS, Sosna WA, Daniels DE, Swayne DE. Ferrets develop fatal
 influenza after inhaling small particle aerosols of highly pathogenic avian influenza virus
 A/Vietnam/1203/2004 (H5N1). Virology Journal. 2010;7.
 9. Gustin KM, Belser JA, Wadford DA, Pearce MB, Katz JM, Tumpey TM, et al. Influenza virus aerosol
 exposure and analytical system for ferrets. Proceedings of the National Academy of Sciences of the
 United States of America. 2011;108(20):8432-7.
 10. MacInnes H, Zhou Y, Gouveia K, Cromwell J, Lowery K, Layton RC, et al. Transmission of
 Aerosolized Seasonal H1N1 Influenza A to Ferrets. Plos One. 2011;6(9).
 11. Koster F, Gouveia K, Zhou Y, Lowery K, Russell R, MacInnes H, et al. Exhaled Aerosol Transmission
 of Pandemic and Seasonal H1N1 Influenza Viruses in the Ferret. Plos One. 2012;7(4).
 12. Gustin KM, Katz JM, Tumpey TM, Maines TR. Comparison of the Levels of Infectious Virus in
 Respirable Aerosols Exhaled by Ferrets Infected with Influenza Viruses Exhibiting Diverse
 Transmissibility Phenotypes. Journal of Virology. 2013;87(14):7864-73.
 13. Bouvier NM. Animal models for influenza virus transmission studies: a historical perspective. Current
 Opinion in Virology. 2015;13:101-8.
 14. Zhou J, Wei J, Choy K-T, Sia SF, Rowlands DK, Yu D, et al. Defining the sizes of airborne particles
 that mediate influenza transmission in ferrets. Proceedings of the National Academy of Sciences.
 2018;115(10):E2386-E92.
 15. Ramos L, Obregon-Henao A, Henao-Tamayo M, Bowen R, Lunney JK, Gonzalez-Juarrero M. The
 minipig as an animal model to study Mycobacterium tuberculosis infection and natural transmission.
 Tuberculosis. 2017;106:91-8.
 16. de la Vega MA, Soule G, Tran KN, Tierney K, He S, Wong G, et al. Modeling Ebola Virus
 Transmission Using Ferrets. Msphere. 2018;3(5).
 17. Sia SF, Yan LM, Chin AWH, Fung K, Choy KT, Wong AYL, et al. Pathogenesis and transmission of
 SARS-CoV-2 in golden hamsters. Nature. 2020;583(7818):834-+.
18. Kim YI, Kim SG, Kim SM, Kim EH, Park SJ, Yu KM, et al. Infection and Rapid Transmission of
 SARS-CoV-2 in Ferrets. Cell Host & Microbe. 2020;27(5):704-+.
19. Andrewes CH, Glover RE. Spread of infection from the respiratory tract of the ferret I Transmission of
 influenza A virus. British Journal of Experimental Pathology. 1941;22(2):91-7.
20. Buhnerkempe MG, Gostic K, Park M, Ahsan P, Belser JA, Lloyd-Smith JO. Mapping influenza
 transmission in the ferret model to transmission in humans. Elife. 2015;4.
21. Gustin KM, Belser JA, Veguilla V, Zeng H, Katz JM, Tumpey TM, et al. Environmental Conditions
 Affect Exhalation of H3N2 Seasonal and Variant Influenza Viruses and Respiratory Droplet
 Transmission in Ferrets. PloS one. 2015;10(5):e0125874-e.
22. Wells WF. On air-borne infection - Study II Droplets and droplet nuclei. American Journal of Hygiene.
 1934;20(3):611-8.
23. Riley EC, Murphy G, Riley RL. Airborne spread pf measles in a suburban elementary school. American
 Journal of Epidemiology. 1978;107(5):421-32.
24. Asadi S, Gaaloul ben Hnia N, Barre RS, Wexler AS, Ristenpart WD, Bouvier NM. Influenza A virus is
 transmissible via aerosolized fomites. Nature Communications. 2020;11(1):4062.
25. Ragucci R, Cavaliere A, Massoli P. Drop sizing by laser-light scattering exploiting intensity angular
 oscillation in the Mie regime. Particle & Particle Systems Characterization. 1990;7(4):221-5.
26. Glover AR, Skippon SM, Boyle RD. Interferometric laser imaging for droplet sizing: A method for
 droplet-size measurement in sparse spray systems. Applied Optics. 1995;34(36):8409-21.
27. Mounaim-Rousselle C, Pajot O. Droplet sizing by Mie scattering interferometry in a spark ignition
 engine. Particle & Particle Systems Characterization. 1999;16(4):160-8.
28. Kawaguchi T, Akasaka Y, Maeda M. Size measurements of droplets and bubbles by advanced
 interferometric laser imaging technique. Measurement Science and Technology. 2002;13(3):308-16
29. Grassmann A, Peters F. Size measurement of very small spherical particles by Mie Scattering Imaging
 (MSI). Particle & Particle Systems Characterization. 2004;21(5):379-89.
30. Chao CYH, Wan MP, Morawska L, Johnson GR, Ristovski ZD, Hargreaves M, et al. Characterization
 of expiration air jets and droplet size distributions immediately at the mouth opening. J Aerosol Sci.
 2009;40(2):122-33.
31. Olsen AP, Flagan RC, Kornfield JA. Single-particle levitation system for automated study of
 homogeneous solute nucleation. Review of Scientific Instruments. 2006;77(7).
32. Shaman J, Kohn M. Absolute humidity modulates influenza survival, transmission, and seasonality.
 Proceedings of the National Academy of Sciences of the United States of America. 2009;106(9):3243-
 8.
33. Halloran SK, Wexler AS, Ristenpart WD. A Comprehensive Breath Plume Model for Disease
 Transmission via Expiratory Aerosols. Plos One. 2012;7(5).
34. Schmitz S, Tacke S, Guth B, Henke J. Comparison of Physiological Parameters and Anaesthesia
 Specific Observations during Isoflurane, Ketamine-Xylazine or Medetomidine-Midazolam-Fentanyl
 Anaesthesia in Male Guinea Pigs. Plos One. 2016;11(9).
35. Asadi S, Wexler AS, Cappa CD, Barreda S, Bouvier NM, Ristenpart WD. Aerosol emission and
 superemission during human speech increase with voice loudness. Scientific Reports. 2019;9(1):2348.
36. Kudo E, Song E, Yockey LJ, Rakib T, Wong PW, Homer RJ, et al. Low ambient humidity impairs
 barrier function and innate resistance against influenza infection. Proceedings of the National Academy
 of Sciences of the United States of America. 2019;116(22):10905-10.
37. Wu Y, Jing WZ, Liu J, Ma QY, Yuan J, Wang YP, et al. Effects of temperature and humidity on the
 daily new cases and new deaths of COVID-19 in 166 countries. Science of the Total Environment.
 2020;729.
38. Nicholls EE. A study of the spontaneous activity of the guinea pig. Journal of Comparative Psychology.
 1922;2(4):303-30.
39. Edward DGF. Resistance of influenza virus to drying and its demonstration on dust. Lancet. 1941;2:664-
 6.
40. Chan JFW, Yuan SF, Zhang AJX, Poon VKM, Chan CCS, Lee ACY, et al. Surgical Mask Partition
 Reduces the Risk of Noncontact Transmission in a Golden Syrian Hamster Model for Coronavirus
 Disease 2019 (COVID-19). Clinical Infectious Diseases. 2020;71(16):2139-49.
41. Heyder J, Gebhart J, Rudolf G, Schiller CF, Stahlhofen W. Deposition of particles in the human
 respiratory-tract in the size range 0.005-15 µM. J Aerosol Sci. 1986;17(5):811-25.
42. Schreider JP, Hutchens JO. Particle deposition in the guinea-pig respiratory tract. J Aerosol Sci 10, 599-
 607 (1979);10(6):599-607.
43. Asadi S, Wexler AS, Cappa CD, Barreda S, Bouvier NM, Ristenpart WD. Effect of voicing and
 articulation manner on aerosol particle emission during human speech. PloS one.
 2020;15(1):e0227699-e.
Figures

Fig. 1. Schematic of Interferometric Mie Imaging (IMI) and Aerodynamic Particle Sizer (APS) setup. (a) IMI setup
for counting and qualitatively characterizing particles emitted from a guinea pig cage. Particles emitted from the cage
are carried toward the laser sheet by a horizontal airflow. A CCD camera captures out-of-focus images of the
illuminated particles with diameter of > 2 µm (fringe pattern), and < 2 µm (no-fringe pattern). A second camera
captures the time-lapse images of guinea pig in the cage (side-view). (b) APS setup for measuring the size distribution
of particles with diameter of 0.3–20 µm emitted from a guinea pig cage. An APS pulls the air at 5 L/min through the
HEPA filters and a camera captures top-view images of the guinea pig in the cage at 1 image per second.

 23
Fig. 2. Particle emission rates measured by IMI setup. (a) Images captured by CCD camera that show speckle-like
 ̅(15) for three guinea pigs
pattern for particles illuminated by the laser sheet. (b) Time-averaged particle emission rate,
(GP1, GP2, and GP3) under different conditions: uninfected, awake guinea pig in the cage with CC bedding or PF
bedding, and uninfected, anesthetized guinea pig inside the empty cage. A plastic bag was used to cover anesthetized
guinea pig fur with a small opening for its nose facing directly toward the laser sheet. Background particle
measurements for each condition where no guinea pig was in the cage are shown with gray circle markers (No GP
(background)). Each data point is the average of four 15-minute time-averaged particle emission rates and 3 trials for
each guinea pig. Time-averaged particle emission rate, ̅(1) versus time-averaged guinea pig movement velocity, ̅(1)
over 1 minute, for three uninfected guinea pigs in the cage with (c) CC bedding, and (d) PF bedding. Solid lines are
best power law fits (see Table S1 for statistics).
Fig. 3. Particle emission rates measured by APS setup for unrestricted awake guinea pigs. Particle emission rate,
(left axis) and guinea pig movement velocity, (right axis) versus time for a representative guinea pig in the cage
with (a) CC bedding, (b) PF bedding, and (c) no bedding. Time-averaged particle emission rate, ̅(1) versus time-
averaged guinea pig movement velocity, ̅(1) , for three uninfected awake guinea pigs (GP4, GP5, and GP6) in the
cage with (d) CC bedding, (e) PF bedding, and (f) no bedding. Solid lines are power law fits (see Table S2 for
statistics). Corresponding size distributions (g, h, and i) for the uninfected awake guinea pigs (GP4, GP5, and GP6) in
the cage with (g) CC bedding, (h) PF bedding, and (i) no bedding. The left-most data points in each plot shows the
fraction of particles counted in the 0.3 to 0.5 μm bin, which cannot be further size-discriminated. The whiskers
represent the width of the bin (0.3 to 0.5 μm). Dashed lines represent the data using a 5-point smoothing function.
Data indicated by blue markers for GP4 in (d) and (g) are reproduced from Asadi et al.24 and included here for
comparison.
Fig. 4. Particle emission from anesthetized guinea pigs measured by APS setup. Particle emission rate, , versus time
placed in aluminum sleeve with a small aperture for guinea pig nose in 5 conditions: uninfected anesthetized guinea
pig (0 dpi), inoculated anesthetized guinea pig at 1, 2 and 3 dpi, and euthanized guinea pig for (a) GP4, (b) GP5, and
(c) GP6. Magnifications show the final 15 minutes of each set. (d), (e), and (f) Corresponding size distribution for
particles emitted during the last 15 minutes of the measurements shown in (a) to (c). The left-most data points in each
plot shows the fraction of particles counted in the 0.3 to 0.5 μm bin, which cannot be further size-discriminated. The
whiskers represent the width of the bin (0.3 to 0.5 μm). Dashed lines represent the data using a 5-point smoothing
function. Data indicated by red and black markers in (d) for GP4 at 2dpi and euthanized, respectively, are reproduced
from Asadi et al.24 and included here for comparison.
Fig. 5. Representative particle emission rate dynamics after (a) a guinea pig stops moving in a cage with CC bedding,
and (b) after placing the aluminum sleeve containing an anesthetized guinea pig inside the measurement cage. In (a),
the blue lines are the animal velocity. In both (a) and (b), the red lines are best fits to an exponential decay of the form
 = 0 − with = 0.85 min-1 for (a) and 0.22 min-1 for (b).
Figures

Figure 1

See the Manuscript Files section for the complete gure caption.
Figure 2

See the Manuscript Files section for the complete gure caption.
Figure 3

See the Manuscript Files section for the complete gure caption.
Figure 4

See the Manuscript Files section for the complete gure caption.

Figure 5

See the Manuscript Files section for the complete gure caption.

Supplementary Files
This is a list of supplementary les associated with this preprint. Click to download.

 asadisupplementary.docx
You can also read