Environmental Technology & Innovation - Active NS
←
→
Page content transcription
If your browser does not render page correctly, please read the page content below
Environmental Technology & Innovation 22 (2021) 101481

                                                  Contents lists available at ScienceDirect

                                 Environmental Technology & Innovation
                                             journal homepage: www.elsevier.com/locate/eti

Application of ion-exchange-based additive to control
ammonia emissions in fattening pig barns with slatted floors
Imane Uald Lamkaddam, Enric Blázquez, Lara Pelaz, Laia Llenas, Sergio Ponsá,
                                    ∗
Joan Colón, Esther Vega, Mabel Mora
BETA Tech Center. TECNIO Network, University of Vic-Central University of Catalonia, C/ de la Laura, 13, 08500, Vic, Spain

article              info                           a b s t r a c t

Article history:                                    The intense productivity related to the livestock sector has led to the development and
Received 28 November 2020                           application of different technologies and procedures to mitigate, mainly, NH3 emissions.
Received in revised form 21 February 2021           The addition of ion-exchange-based additives, such as Active NS, is one of the practices
Accepted 27 February 2021
                                                    that may help reducing nitrogen emissions. In this study, the use of Active NS to
Available online 6 March 2021
                                                    mitigate NH3 emissions in pig barns with slatted floor has been assessed during three
Keywords:                                           pig fattening cycles. Two naturally ventilated identical barns were used to carry out
Ammonia emissions                                   the experiments at full-scale. Active NS was only applied in one of the barns while
Farm animal welfare                                 the other one was used as a reference to compare ammonia emissions between both
GHG emission reduction                              barns during a 1-year monitoring campaign. The concentration of ammonia in the
Ion-exchange-based additive
                                                    air at different points of each barn besides the ammonia emission rate generated
Nitrogen recovery efficiency
                                                    directly from the slurry were measured monthly. The maximum reduction of ammonia
Pig manure
                                                    emission (ranging from 17.6% to 38.3%) was systematically obtained at mid fattening
                                                    cycle, where the concentration of Active NS in the slurry was between 40 and 45 g
                                                    m−3 . The retention of ammonium into Active NS structure caused an increase of total
                                                    nitrogen in the slurry of 19.6% compared to the control barn. This result indicated that
                                                    the application of Active NS promoted better nitrogen retention in the slurry, thus
                                                    avoiding its loss by volatilization during the storage of slurry. Lab-scale experiments
                                                    were additionally performed in order to validate the results observed at full-scale under
                                                    controlled conditions resulting in similar findings and confirming the adequacy of Active
                                                    NS optimal dosage.
                                                                                                        © 2021 Elsevier B.V. All rights reserved.

1. Introduction

    Ammonia (NH3 ) is a hazardous compound that contributes to acid deposition and eutrophication. Moreover, NH3 reacts
with atmospheric acids (sulfuric, nitric, and hydrochloric acids), forming (secondary) particles that contribute significantly
to the burden of particulate matter in the atmosphere (Webb et al., 2005). In addition, NH3 is also well-known for its
toxicity, which converts this compound into a potential health hazard for human beings and animals’ welfare. Specifically
in livestock housing, NH3 represents a health risk for animals and humans since long term exposures to NH3 combined
with dust cause severe lung diseases (Seedorf and Hartung, 1999). It has also been reported that prolonged exposure to
atmospheric NH3 affects absolute blood cell counts, lymphocytes, and monocytes, for NH3 concentrations up to 35 ppmv .

  ∗ Corresponding author.
    E-mail address: mabel.mora@uvic.cat (M. Mora).

https://doi.org/10.1016/j.eti.2021.101481
2352-1864/© 2021 Elsevier B.V. All rights reserved.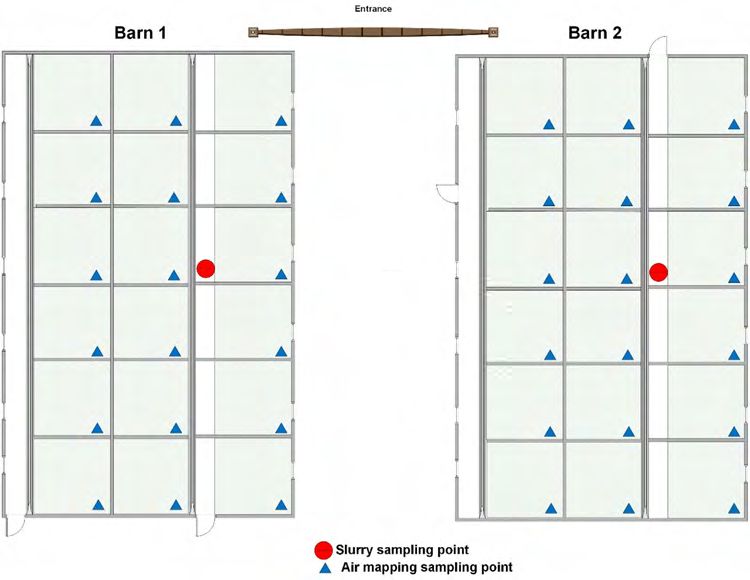
I. Uald Lamkaddam, E. Blázquez, L. Pelaz et al.                              Environmental Technology & Innovation 22 (2021) 101481

Anomalous serum haptoglobin and serum cortisol concentrations besides less feeding behavior have also been found in
animals exposed to 50 ppmv of NH3 (Von Borell et al., 2007).
    The agricultural sector is currently responsible for the vast majority of ammonia emissions in the European Union
(2015). The EU legislation restricts ammonia emissions since 2010, targeting an ammonia emission reduction of 15% by
2030 (European Environment Agency, 2019a). Due to the lack of emission reduction efforts in the sector, over the period
2014–2017 the overall increase was 2.5% (European Environment Agency, 2019b). Agriculture was responsible for 94% of
EU-28 NH3 emissions in 2011 (EAA, 2017), and particularly in 2013, the agricultural activities in the EU-28 resulted in the
emission of 3.6 Mt of ammonia to the atmosphere (European Union, 2015). The European Pollutant Release and Transfer
Register shows that the largest portion, by far, of ammonia emissions generated in industrial sectors has its origin in the
intensive rearing of poultry or pigs (E-PRTR, 2017). The annual consumption for pork products averages around 40 kg per
capita in EU, a level that is higher than the overall poultry, cattle, sheep and goat products consumed (European Union,
2011). Following the intensive production of pigs, in 2017, the number of pigs in the EU achieved almost 148M head
(FAOSTAT, 2017) and the total ammonia emissions for the whole European pig sector were estimated to be 606 Kt of
nitrogen per year (Santonja et al., 2017).
    The intense productivity related to livestock sector has led to the development and application of different technologies
and procedures to mitigate, mainly, NH3 emissions. The techniques to reduce NH3 emissions from livestock housing can
be separated into three general categories: (1) nutritional measures to reduce the amount of manure and its nitrogen
content (2) utilization of physical and chemical additives and (3) optimization of livestock housing design and storage
covering. Potential control strategies for NH3 emission from animal production facilities include changing animal diet,
redesigning or renovating barns, cleaning the exhaust air from buildings, treating manure, and improving the application
of manure to land. In practice, to achieve optimal NH3 volatilization abatement in animal production operations, the
combination of these control strategies is frequently performed (Ndegwa et al., 2008). At full scale level and for the purpose
to moderate the emissions from livestock housing, one of the best available techniques (BAT) to avoid NH3 emissions from
pig slurry consists of the slurry acidification (Kai et al., 2008; Misselbrook et al., 2016). The acid is added to the slurry
in order to lower the pH to about 5.5 in the slurry pit (Santonja et al., 2017). Slurry acidification to pH values below 6.0
can be very effective to reduce NH3 emissions, resulting in reductions over 99%, due to its pka of 9.26, compared with
untreated slurries with typical pH values ranging from 7.0 to 8.0 (Kai et al., 2008; Petersen et al., 2012). However, the
main drawbacks of this technique consist of personnel risks for concentrated acid management, high cost of the acid,
corrosion and CO2 and H2 S emissions generated (Fangueiro et al., 2015). Another example of BAT consists of installing
cooling pipes in contact with pig slurry in order to decrease the temperature and prevent the volatilization of ammonia
(usually less than 12 ◦ C). Cooling intensities ranging from 10 W m−2 to 50 W m−2 are usually required for gestating sows
and fattening pigs housed on partly slatted floors (Santonja et al., 2017). Apart from slurry acidification or cooling, the
application of ion-exchange-based additives (IEbA), such as natural zeolites, activated zeolites or clay minerals, is one of
the strategies that may help reducing nitrogen emissions. Moreover, the addition of IEbA to the pig slurry diminishes
notably the high costs associated to the acidification and cooling strategies. High affinity to ammonia ions is a well-
known feature of IEbA (Rhodes, 2010); they remove NH3 from slurry by trapping and exchanging it in its crystalline
structure. As an example, zeolite is a kind of mineral with an open reticular structure which allows the entrapment or
release of various cations as a consequence of cation exchange mechanisms (Venglovsky et al., 2005) and adsorption
(Bernal et al., 1993; Venglovsky et al., 2005). Zeolites are naturally occurring three-dimensional, microporous, hydrated
aluminosilicate minerals characterized for showing high internal surface areas (Bíreš et al., 2005). Additionally, zeolites
have been proven, at lab-scale, to enhance nitrogen retention in the solid fraction of pig slurry when added previously to
the solid–liquid separation stage (Vargova et al. 2002). Taking into account the adsorption property of IEbA, many studies
have also investigated the influence of this additives on NH3 and nitrogen retention during waste treatments, such as
composting (Cao et al., 2019; Giacomini et al., 2014; Li et al., 2012; Wang et al., 2017) and thermal drying (Liu et al.,
2019). IEbA have been even tested as a dietary supplement to improve pigs’ welfare but this practice could also mitigate
ammonia emissions once pig slurry is excreted (Kim et al., 2005; Milic et al., 2005; Tatar et al., 2012). Even with these
positive precedents, to the best of our knowledge, the use of IEbA, such as zeolites or clay minerals, as physical additives
in the slurry has not been investigated up to date in full-scale pig farms.
    Besides the abovementioned procedures and additives applied to directly reduce the emissions released from the
slurry pit, many other additives have been used to mitigate the emissions of NH3 associated to slurry management and
treatment activities, especially during composting. As an example, biochar has been widely cited as one of the most
convenient additives to mitigate NH3 emissions during pig slurry composting, being used as a single additive (Liu et al.,
2017; Steiner et al., 2010) or combined with other additives such as zeolites (Awasthi et al., 2016) or commercial bacteria
(Mao et al., 2018). Sulfur has also shown effectiveness to mitigate NH3 and odor emissions during composting (Li et al.,
2020; Gu et al., 2018) as well as the application of enriched ammonia oxidizing-bacteria, which has been mainly used
for nitrogen retention purposes resulting in the mitigation of the emissions both during storage and composting of pig
slurry (Zhang et al., 2016a). Combined use of nitrification inhibitor and struvite crystallization (Jiang et al., 2016) and
palygorskite addition to composting (Pan et al., 2019) have been also implemented to mitigate NH3 emissions.
    Considering the overview about the best available techniques and additives used to mitigate ammonia emissions from
pig slurry, the present study aimed to demonstrate the environmental and economic feasibility specifically associated to
the application of ion-exchange-based additives to pig slurry stored under slatted floor pig barns. This study focuses on
the reduction of ammonia emissions directly from the slurry pit, which turns it into a pioneer solution applied to mitigate
the emissions in pig housing systems and to favor the nitrogen retention in pig slurry post-treatment activities.
                                                              2
I. Uald Lamkaddam, E. Blázquez, L. Pelaz et al. Environmental Technology & Innovation 22 (2021) 101481
2. Materials and methods
2.1. Farm monitoring (in-situ)
2.1.1. Farm description
Full-scale testing and monitoring developed in this study was carried out in a pig fattening farm located in Catalonia
(Spain). The farm had two identical fattening pig barns with a slatted floor system and a slurry pit underneath. The barns
had a dimension of 33 × 10 × 10 m, with a pig capacity of 400 pigs/barn. The slurry pit of each barn had a volume of
198 m3 , that was designed considering the daily increase in the level of slurry (< 198 m3 by the end of each cycle). The
slurry level was identical in both barns and followed the same increase rate since the number of pigs remained similar in
all the cycles. The average evolution of the slurry level along the cycles is given in the Supplementary Material (Table S3).
The lateral and roof windows positions were identical and following the same orientation, to ensure an identical natural
ventilation inside the barns. Windows were fully or partially open depending on the season. One of the barns (Barn 1,
as B-1) was used as a control and the second barn (Barn 2, as B-2) was used for testing (application of a commercial
ion-exchange-based additive).
2.1.2. Fattening cycles description
Three pig fattening cycles were monitored in this study. Each cycle lasted 4 months, resulting in a 1-year monitoring
campaign, thus, covering seasonal variability. Cycles were distributed as follows: cycle 1 (C-1) from Sept. to Jan. (fall-
winter, first year); cycle 2 (C-2) from Feb. to May (winter–spring, second year); cycle 3 (C-3) from Jul. to Sept. (summer,
second year). At the beginning of each cycle, the following actions were performed: (1) the slurry was removed as much as
possible from the pit down to one third of the total capacity; (2) addition of a commercial ion-exchange-based additive
(IEbA) (Active NS, FCSI, Denmark) to the remaining slurry in the experimental barn; (3) 400 piglets (25–30 kg) were
located into each barn and were fattened up to 110–120 kg.
The supplier of the commercial IEbA, Active NS, recommended a concentration of 20 g m−3 to reduce ammonia
emission. Active NS powder is a 100% natural product primarily composed of three different types of pre-processed clay
minerals. The unique blend gives the product an exceptionally high ion-exchange effect and a binding capacity of 60 g of
ammonium in 1 g of Active NS. The porous substances in the powder are structured as an open lattice of tetrahedrons with
inner cavities capable of adsorbing and releasing ions, essentially operating as a molecular sieve. The adsorbent works
according to the principle of exchanging negatively and positively charged ions.
Therefore, the amount added in the testing barn was calculated to achieve a concentration of 20 g m−3 of Active NS
by the end of the cycle considering the daily dejections of pigs to the slurry pit. In this study, at the beginning of each
cycle, 4 kg of Active NS were mixed with a small amount of water, and this mixture was added through the slatted floor
at different points of the barn.
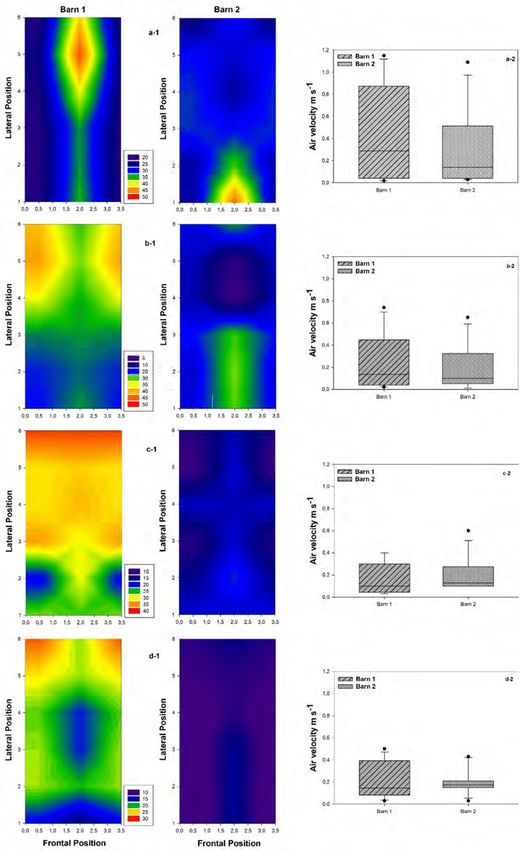
Monthly monitoring and sampling activities were performed in both barns along each fattening cycle (D1, D2, D3,
D4). Ammonia emission rates (NH3 -ER) generated directly from the slurry stored in the slurry pit were monitored in one
specific location of each barn (near the geometric center), as shown in Fig. 1. Pig slurry was also sampled from the same
sampling point for further physical and chemical analyses. NH3 -in-air maps (named air mapping in the present study)
were also created by measuring the ammonia concentration in the air, at 21 evenly distributed points inside the barns as
illustrated in Fig. 1. Further details about the performance of monitoring and sampling activities are given in the following
sections.
2.1.3. Indoor air ammonia concentration: Air mapping
The concentration of ammonia in the air was measured using a multiparametric portable analyzer (MultiRAE Lite, RAE
Systems, Spain) equipped with an electrochemical sensor for NH3 analysis. The ammonia detection range was from 0 to
100 ppmv , with 1 ppmv increments. The air mapping represented the ammonia distribution pattern at surface level in each
of the barns under study. As mentioned above, 21 points were measured to construct air maps. Besides the concentration
of NH3 , the air velocity and temperature were also measured using a thermal anemometer (Testo Ltd Testo −425, Alton
Hampshire, UK) with a measuring range from 0 to 20 m s−1 , a resolution of 0.01 m s−1 and an accuracy of ±0.015 m s−1
for the air velocity, and a measuring range from 5 to 65 ◦ C, a resolution of 0.1 ◦ C and an accuracy of 0.03 ◦ C/◦ C for the
temperature. Both monitoring devices (MultiRAE and anemometer) were manually moved from one point to other, held
in a fixed position by the operator until the stabilization of the displayed values. Both devices were placed 1 m above
the slatted floor of each barn. Prior to each sampling day the sensors of the MultiRAE were calibrated using a calibration
ammonia–nitrogen mixture cylinder of 50 ppm and an accuracy of ±5% (RAE Spain SL).
2.1.4. Ammonia emission rate
During C-1 the effect of the IEbA application on the pig slurry was evaluated in terms of average concentration of
NH3 in the air and % of N reduction, comparing Barn 1 (control) and Barn 2 (addition of Active NS). Pig slurry was also
characterized. However, air ammonia concentration inside the barns is highly dependent on meteorological conditions
and was not enough to assess the mitigation effect of the IEbA on ammonia released from the slurry pits due to its high
dependence on meteorological conditions. Then, further information was required to clearly assess the mitigation effect
3I. Uald Lamkaddam, E. Blázquez, L. Pelaz et al. Environmental Technology & Innovation 22 (2021) 101481
Fig. 1. Scheme of the barns used to carry out the study including air and slurry sampling points.
Fig. 2. Flux chamber set used to measure the ammonia emission rate generated from the pig slurry stored under the slatted floor of each barn.
of IEbA on ammonia released from the slurry pits. For this reason, a dynamic flux chamber (DFC) (Fig. 2) was designed and
constructed to directly measure the ammonia emitted to the air from the pig slurry stored under the slatted floors. The
implementation of the dynamic flux chamber in C-2 and C-3 helped complementing the study with more accurate data.
Fig. 2 shows the scheme of the DFC (200 mm Ø with 640 mm length). The use of a DFC has been considered
by other authors (Blanes-Vidal et al., 2007) as a reliable method to assess the reduction of NH3 emissions from this
4I. Uald Lamkaddam, E. Blázquez, L. Pelaz et al. Environmental Technology & Innovation 22 (2021) 101481 type of waste. The enclosure of the DFC was effectively isolated from external conditions (such us wind velocity and temperature) avoiding the effect of meteorological factors on the measurements. Prior to the set-up of the DFC, the slurry was thoroughly mixed to obtain an integrated homogeneous sampling area (manually and identical procedure for both barns). Afterwards, the DFC was placed directly on the pig slurry, located 20 cm above the pit bottom. The headspace of the DFC allowed circulating air and extracting a dynamic flux of ammonia. To this aim, a clean air flow (
I. Uald Lamkaddam, E. Blázquez, L. Pelaz et al.                                            Environmental Technology & Innovation 22 (2021) 101481

Table 1
Average and maximum NH3 concentration in the indoor air of B-1 and B-2 monitored along the cycles.
    Cycle        Sampling      Barn 1                                  Barn 2                                  NH3 emission      Airflow
                 day           [NH3 ]avg (ppmv )   [NH3 ]max (ppmv )   [NH3 ]avg (ppmv )   [NH3 ]max (ppmv )   reduction (%)     difference (%)

                 D1            31   ±   9          47                  30   ±   6          46                  3.0               12
                 D2            29   ±   7          41                  19   ±   8          31                  34                30
    Cycle 1
                 D3            31   ±   5          38                  15   ±   3          21                  51                −10
                 D4            18   ±   2          19                  14   ±   2          18                  22                6.0
                 D1            41 ± 5              50                  38   ±   2          40                  8.4               29
                 D2            11 ± 6              28                  11   ±   5          22                  −4.0              n.a.a
     Cycle 2
                 D3            28 ± 8              41                  27   ±   2          30                  3.2               −7.3
                 D4            7 ± 3               13                  10   ±   2          13                  −35               63
                 D1            16 ± 9              32                  17   ±   4          23                  −5.0              48
                 D2            10 ± 5              23                  18   ±   5          25                  −87               84
     Cycle 3
                 D3            9 ± 4               19                  10   ±   3          16                  −11               55
                 D4            13 ± 5              22                  24   ±   8          45                  −86               66
a
    Equipment issue.

The windows of the barns were partially to fully open respectively during C-2 and C-3 to keep the barns aerated on hot
seasons for animal welfare reasons. Instead, during the first cycle C1 (autumn–winter) the lateral windows of both barns
were closed or partially opened (to prevent heat loss in the barn and a reduction of indoor temperature) making the
airflow variations less evident and facilitating the interpretation of the results. The high variations in terms of air flowing
into the barns caused a hindrance to obtain representative air maps. The NH3 concentrations were highly influenced by
the end of C-2 and C-3 (diluted), as the reduction of NH3 in air concentration was not achieved as shown in Table 1.
This could be justified by the abovementioned reason (windows closed in winter and partially to fully open in spring
and summer cycles). Fig. 3 shows the NH3 concentration distribution in the air (air mapping) inside the barns during
the first fattening cycle (C-1). As can be observed in Fig. 3, NH3 concentrations were clearly higher in B-1 compared to
B-2, while similar air velocities were registered in both barns. Regarding the ambient temperature of the barns, similar
to equal values were measured in all the cycles and for the four sampling days (detailed data is presented in Table S2 of
the Supplementary Material).
    The measured differences on airflows between the barns with and without the IEbA Active NS are shown in Table 1.
For C-1 the difference of air velocities inside the barns was still significant (p = 0.024), however the NH3 concentrations
in B-2 was lower than B-1. During C-2 the difference started to be higher and more influencing; the p-value calculated
for the measured air velocities was p=0.006. Likewise, the air velocity was statistically lower in B-2 with a p = 0.001
(precision of 95%) in the case of C-3, where the air flowing towards both barns was the leading cause of the limitation of
the air mapping technic for the cycle. The average airflow difference between the barns from C-1 to C-3 was almost three
times higher as 84% difference was recorder in C-3, that corresponded to −87% of NH3 emission reduction (0.20 versus
0.03 m s−1 ).
    The interpretation of Active NS application influence on the ammonia indoor air concentration should be associated
with a homogeneous ventilation to prevent any accumulation of particles. However, in the present study, the opening
and closing of the windows was uncolorable, as the performance of the cycle must be carried out according to the typical
conditions of a fattening cycle.

3.2. Ammonia emission rate at full-scale

    NH3 -ER directly generated from the pig slurry stored under the slatted floor of the barns was estimated using a DFC.
Mixing of slurry before setting up the DFC and the circulation of a fresh air flow through its headspace, forced the
emission of ammonia and resulted in the appearance of a concentration peak (that lasted on 20 min in average), followed
by decreasing and stabilization phases. After approximately 1 h, the steady NH3 concentration monitored indicated the
achievement of the mass transfer equilibrium. Table 2 shows the NH3 -ER calculated from the DFC data obtained, from both
barns, during C-2 and C-3. In general, B-2 (the barn containing Active NS in the pig slurry) presented lower values (p< 0.05)
of NH3 -ER than B-1 (control barn). Uniquely two exceptions were recorded, the sampling day D4 of C-2 and the sampling
day D1 of C-3. The last sampling day of the second cycle there were 109 pigs more in B-2 than in B-1, the difference in
the last days of the cycle is because the pigs were already being sent to the slaughterhouse which affected the reduction
in terms of ER. The first sampling day of the last cycle there was a cleaning event in B-1 causing a decrease of the NH3 -ER.
These are typical events that may inevitably occur at full-scale experimentation and highlights the complexity and value
associated to the present study; however, despite NH3 -ER was higher in B-2 as an average, the recorded concentrations
were not statistically significant (p< 0.05). Similar NH3 -ER trends were observed along cycles C-2 and C-3, reaching values
up to 38.0% and 38.3%, respectively, the second sampling day. From the statistical analysis, it has been also determined
that there is a significant difference between the emissions of ammonia in B-1 and B-2, in C-2 and in C-3. This indicates
                                                                         6
I. Uald Lamkaddam, E. Blázquez, L. Pelaz et al. Environmental Technology & Innovation 22 (2021) 101481
Fig. 3. Air mapping (charts on the left; in the legend the concentrations of NH3 in ppmv ) and air velocity average and variation (charts on the right)
corresponding to sampling days D1 (a-1, a-2), D2 (b-1, b-2), D3 (c-1, c-2) and D4 (d-1, d-2) of the first fattening cycle (C-1).
7I. Uald Lamkaddam, E. Blázquez, L. Pelaz et al. Environmental Technology & Innovation 22 (2021) 101481
Table 2
Ammonia emission rate calculated from the dynamic flux chamber for cycles 2 and 3.
Cycle Sampling Emission rate in B-1 Emission rate in B-2 Emission reduction
day (g N d−1 ) (g N d−1 ) (%)
D 1 179 148 17.6
D 2 306 190 38.0
C-2
D 3 706 495 29.8
D 4 31.0 44.3 −43.0
D 1 358 432 −20.0
D 2 906 559 38.3
C-3
D 3 1014 870 14.0
D 4 935 764 18.0
Table 3
Nitrogen balance in both barns during the fattening cycle.
Cycle 1 Cycle 2 Cycle 3
B-1 B-2 B-1 B-2 B-1 B-2
Gas phase
Total Emission Rate (kg N d−1 ) n.a. 0.51 ± 0.3 0.34 ± 0.2 0.80 ± 0.3 0.66 ± 0.2
Total N emitted (kg N) n.a. 60.7 41.1 96 79
N emitted from total N (%) n.a. 5.9 3.9 10.2 8.1
Reduction of total N emitted (%) n.a. 0 32.3 0 18.4
Slurry
Total N increase (kg N) 510 540 471 551 345 429
Total N increase in the slurry (%) 0 5.6 0 14.7 0 19.6
Values shown in the table have been calculated as the averages of each cycle monitored.
that the concentration of NH3 recorded from B-1 and B-2 are significantly different, that implies the validation of the
influence of addition of Active NS on the slurry pit for NH3 mitigation.
The addition of Active NS directly to the slurry pit exhibited successful performances in cycles C-2 (winter–spring) and
C-3 (spring–summer). Experimental results at full-scale indicated that the application of this product is a cost-effective
strategy to efficiently mitigate ammonia emissions regardless the seasonality. Then, the present study confirms for the
first time, at full-scale and under seasonal influence, the proven benefits of Active NS application to pig slurry at lab-scale.
3.3. Nitrogen balance in the slurry
Apart from the monitoring of ammonia emitted from the DFC and the air mapping, samples of pig slurry (extracted
from B-1 and B-2 each monitoring day) were characterized to assess the nitrogen balance in each cycle (Table 3).
Overall results indicated that B-2 emitted less ammonia to the atmosphere, in terms of NH3 -ER and total N. The
application of Active NS engendered a total reduction in ammonia emissions of 32.3% and 18.4% in cycles C-2 and
C-3, respectively. As expected, these reduction values (%) were aligned with the N emitted from total N contained in
the pig slurry, which at the same time were of about 2-fold in C-3 (hottest season) rather than in C-2. As an example, N
emitted (from total N in the pig slurry) in B-2 during C-3 was 8.10%, meaning a reduction of 20.4% with respect to B-1
for the same cycle, and 2.08-fold higher than in a colder season (3.89% in C-2). Results obtained herein indicate that the
dosage of Active NS should be further optimized to target similar NH3 -ER along the year since ammonia generation rate
increases with temperature, causing higher emission rates during hot seasons (Nimmermark and Gustafsson, 2005). As
can be observed from Table 3, similar amounts of total nitrogen were retained in the pig slurry stored in B-2 for cycles
C-2 and C-3 (19.6 kg N and 14.7 kg N, respectively), probably indicating the achievement of near-to-maximal retention
capabilities of the Active NS applied.
Regarding the slurry analysis, the amount of total nitrogen in the slurry containing Active NS increased by 5.6%, 14.7%
and 19.6% in C-1, C-2 and C-3, respectively. Fig. 4 represents the evolution of the total N remaining in the slurry along
each fattening cycle. In C-1 the nitrogen available in the slurry, for both barns, is relatively similar along the whole cycle;
then, by mid C-2 (D2 of C-2), the influence of Active NS was more effective regarding nitrogen retention in the slurry
of B-2 compared to the slurry from B-1. In C-3 the effect of Active NS showed the same trend as in C-2, nevertheless,
this last cycle showed less total nitrogen content than the previous cycle. Overall, at the beginning of all cycles the total
nitrogen content (kg) in the control barn (B-1) was always higher than in B-2. Afterwards, Active NS started mitigating
NH3 emissions by blocking the nitrogen inside its tetrahedra structure, which allowed better retention of nitrogen in the
pig slurry of B-2. By the end of the cycles, nitrogen retention was always higher in B-2.
Bíreš et al. (2005), among other authors, reported that IEbA, such as zeolites, remove ammonia from slurry by trapping
and exchanging it in its crystalline structure. However, without elaborating a nitrogen mass balance, it is complex to
confirm and assess the retention capability of IEbA, especially at full-scale, by uniquely analyzing ammonia in air and
8I. Uald Lamkaddam, E. Blázquez, L. Pelaz et al. Environmental Technology & Innovation 22 (2021) 101481
Fig. 4. Nitrogen retention in the slurry pit along the monitored cycles (a) C-1 (b) C-2 and (c) C-3.
ammonium in pig slurry. In the present study, the concentration of N-NH+ 4 in the slurry was quite stable and similar
for both, the control barn and the barn with IEbA, for all the fattening cycles. The addition of Active NS did not show
any effect during any of the fattening cycles in terms of N-NH+
4 contained in the slurry. However, ammoniacal nitrogen is
continuously generated enzymatically, from the urea, once excreted (Blanes-Vidal et al., 2007), underlining the importance
9I. Uald Lamkaddam, E. Blázquez, L. Pelaz et al. Environmental Technology & Innovation 22 (2021) 101481
Fig. 5. Evolution of NH3 -ER, Active-NS concentration and ammonium concentration along cycles (A) C-2 and (B) C-3.
of analyzing the content of TKN in the pig slurry to clearly evaluate the effect of IEbA addition through the N balance. In
this sense, Table S1 (shown in the Supplementary Material) summarizes the results obtained from the characterization
of pig slurry, sampled from both barns during all the fattening cycles, where both NH+ 4 and TKN are considered.
Fig. 5 represents the evolution of NH3 -ER, Active NS concentration and ammonium concentration along cycles C-2
and C-3. As mentioned in previous sections, the commercial IEbA was dosed at the beginning of each cycle, taking into
account the final volume that should be achieved at the end of the cycle and the dosage recommended by the supplier
(20 g Active NS m−3 pig slurry). The concentration of Active NS along each cycle was calculated by considering the initial
amount added and the pig slurry volume accumulated each monitoring day. In Fig. 5 it can be observed that the maximum
NH3 -ER was achieved almost two months after the cycle initialization, when the IEbA concentration was between 40 and
45 g m−3 . The recommended concentration of IEbA was never achieved by the end of the studied cycles although Active
NS effectiveness was already decreasing at mid-cycle, when its concentration was 2-fold the dosage recommended by
the supplier. These results again indicate that the dosage of Active NS at full-scale and for long-term cycles should be
still optimized. It has already reported that the saturation of adsorption sites of physical additives limits the adsorption
capacity of N-NH+ 4 and NH3 , and the NH3 emission mitigation potential (Kastner et al., 2009). Moreover, the adsorption
effect of NH3 into acidic sites (Kastner et al., 2009) and N-NH+4 onto negatively charged sites (Agyarko-Mintah et al., 2017)
could also explain the loss of IEbA effectiveness with such a high dosage (45 g m−3 at the beginning of the cycles).
An optimization of the application of Active NS could be implemented in the farms, which consist of a weekly or
monthly application of the optimum concentration to maximize the reduction, depending on the increase of the slurry
inside the pit. The increase of the level of the slurry in the pit of the barns is represented by Eq. (2). At the beginning of
the cycle, the level of the slurry rapidly increased with the pig growths to become uniform increase by the end (the level
of the slurry is given in Table S3 of the Supplementary Material). Thus, a first application on the beginning of the cycle
followed by another one by the middle of the cycle (after two months) could enhance the performance of Active NS and
give better results.
Si(%) = 21.6 · ln(Vi ) − 5.15 (2)
Where Vi represents the existing volume of the slurry on the sampling day i (i=1, 2, 3, 4), and Si the increase of pig slurry
stored in the barn at the day i.
The addition of 4 kg of Active NS at the beginning of the cycle in order to achieve (20 g m−3 ) is a good compromise
for the farmers, since the application is unique, however a good balance of Active NS addition and ammonia reduction
should be taken into consideration.
10I. Uald Lamkaddam, E. Blázquez, L. Pelaz et al. Environmental Technology & Innovation 22 (2021) 101481
Fig. 6. Ammonia emission profiles obtained from Active-NS testing performed at lab-scale.
Regarding previous results reported in the literature it must be mentioned that, many studies have proven the benefits
of IEbA application for nitrogen conservation and ammonia emission mitigation during the treatment of different wastes,
such as composting of municipal solid waste (Ergun and O.N., 2014) or composting of sludge (Zhang et al., 2016b). Other
studies also investigated the use of IEbA during the composting of pig manure in order to prevent nitrogen loss and to
moderate the NH3 emission during the process (Giacomini et al., 2014; Li et al., 2012; Wang et al., 2017). However, the
evaluation of ammonia emissions mitigation and total nitrogen conservation, through the application of IEbA to the pig
slurry at full-scale, has never been investigated to the authors’ knowledge.
Other additives different than IEbA have also shown promising results during post-treatment activities of pig slurry,
indicating that a proper combination of IEbA with them could result in the maximization of N emissions mitigation along
the whole livestock manure management and treatment chain. As an example, Pan et al. (2018), reported that the acidic
additives on sewage sludge composting had no negative effect of the quality of the compost, yet the conservation of
N was improved during the process, elemental sulfur and phosphoric acid had the lower NH3 volatilizations among
the studied additives (0.80% and 0.98% of initial N, respectively). Tu et al. (2019) from the other side stated that the
combination of biochar and microbial inoculation added to pig manure compost results on the increase of 59% of TKN
through the reduction of NH3 volatilization and N2 O production. Which is higher than the use of single biochar or microbial
inoculation. Likewise, combined use of nitrification inhibitor and struvite crystallization to reduce the NH3 emissions
during composting showed promising results, significantly reduced NH3 losses by 45%–53% (Jiang et al., 2016).
3.4. Ammonia emission rate at lab-scale
Tests performed at lab-scale, for 2 weeks and under controlled conditions revealed that an NH3 -ER of 35% could be
achieved applying 20 g Active NS m−3 of pig slurry (Fig. 6). This result confirmed the mitigation of ammonia emissions
through the addition of such a low dosage of IEbA.
As can be observed in Fig. 6, the effect of Active NS was noted from the beginning of the experiment with higher
percentages of NH3 -ER associated than those obtained at full-scale. This result once again demonstrates the importance of
testing this mitigation strategy at full-scale to clearly assess the performance under uncontrolled and variable conditions.
The lack of IEbA mixing with pig slurry or the age of the pig slurry are two of the several variables affecting its effectivity.
Even so, the effective mitigation of NH3 emissions achieved linked to such a low dosage of additives to the slurry converts
the application of IEbA into a successful alternative to other expensive or harmful strategies currently followed at full-
scale. It must be pointed out that the average concentration of IEbA used for composting ranges between 1% to 10%, which
is much higher than the dosage of IEbA required in the present study. Moreover, the use of acids directly to the slurry
pit requires between 4 to 6 kg of acids to achieve a pH of 5.5 for 1 m3 of pig slurry (MAPA, 2015). Portejoie et al. (2003)
achieved 71% of NH3 -ER reduction from a covered pig slurry storage applying zeolites, which is 86% higher than that
obtained herein. However, these studies were performed at lab-scale, under well controlled conditions.
3.5. Economic approach of active NS addition for ammonia mitigation
An economic approach has been performed to evaluate the economic benefits associated to the application of Active
NS to the pig slurry as an alternative to acidification, both considered efficient strategies to mitigate ammonia emissions
in pig farms.
11I. Uald Lamkaddam, E. Blázquez, L. Pelaz et al. Environmental Technology & Innovation 22 (2021) 101481
Regarding acidification, to achieve a pH of 5.5 for pig slurry, between 4 to 6 kg of concentrated sulfuric acid (95%–98%
H2 SO4 ) should be added to 1 m3 of pig slurry. The cost associated to the addition of sulfuric acid for treating pig slurry,
include the acid cost, energy consumption and the maintaining cost, which are 0.72 e m−3 , 0.17 e m−3 and 0.29 e m−3 ,
respectively (Santonja et al., 2017). In addition, the application of this type of harmful products must be performed by
trained staff (due to the level of safety required and the corrosive nature of the additive) and requires of maintenance
activities over the time. This fact causes difficulties for the implementation of the acidification strategy by farmers.
Advantageously, due to the efficiency of the Active NS, a very low amount was required to mitigate the ammonia
emissions. In the case studied, it was only necessary the addition of 4 kg of Active NS, in a barn of approximately 200
m3 , at the beginning of each fattening cycle. The average price of IEbA similar to Active NS on the market is around
90 to 150 e tn−1 depending on the supplier. Based on this value, the application cost of the IEbA is below 0.6 e in each
fattening cycle, considering that the present method does not require maintaining cost nor energy consumption. Thus, the
cost of the recommended concentration was 0.003 e m−3 and the optimum concentration found in the same study was
0.006 e m−3 .
Regarding the cooling of the slurry as a technology for ammonia mitigation, the economic assessment was not
performed to be compared due to the huge operational cost of the technology, moreover, the cooling pipes are more
efficient in forced ventilated housing, which is not the case of the present study.
Hence, this study confirms that the application of an IEbA, such as Active NS, to pig slurry at full-scale is not only a
successful strategy but economically more advantageous than other strategies applied to mitigate ammonia emissions,
however achieving only the half of the efficiency than the acidification technique. Besides this, the use of pig slurry with
zeolites could also improve the carbon footprint of its post-treatment.
4. Conclusions
The present study has proven that the addition of an ion-exchange-based additive (IEbA) to pig slurry stored in
slatted floor barns is an environmentally friendly and economical and technically feasible strategy to mitigate ammonia
emissions from livestock housing. Ammonia emissions and nitrogen balance were assessed along three pig fattening
cycles, performed along 1 year at full-scale, using data from air mapping, dynamic flux chamber emissions and pig slurry
characterization. The concentration of ammonia in the air inside the barns was highly influenced by air velocity, which
required the use of a dynamic flux chamber. This methodology was guaranteed as the most adequate method for the
assessment of ammonia emission rates in naturally ventilated housing systems. Data obtained from the DFC indicated
that a dosage of 45 g m−3 of pig slurry of the commercial IEbA, Active NS, reduced up to 38.3% the ammonia emitted
in comparison with the control barn. The analysis of pig slurry also revealed that a maximum increase of 19.56% total
nitrogen was achieved in the pig slurry where Active NS was applied. A decrease of the additive effectiveness was observed
by the end of the fattening cycles, indicating the saturation of the IEbA, applied at the beginning of each cycle. It was
concluded that the dosage of Active NS should be further improved to optimize the mitigation of ammonia emissions
in pig farms, recommending the addition of 20 to 45 g Active NS m−3 to the slurry pit on a monthly basis is to obtain
optimal results.
CRediT authorship contribution statement
Imane Uald Lamkaddam: Investigation, Writing - original draft, Writing - review & editing. Enric Blázquez: Inves-
tigation, Writing - original draft, Writing - review & editing. Lara Pelaz: Conceptualization, Investigation. Laia Llenas:
Resources, Funding acquisition, Project administration. Sergio Ponsá: Resources, Funding acquisition, Project administra-
tion. Joan Colón: Conceptualization, Investigation, Writing - review & editing, Project administration, Supervision. Esther
Vega: Writing - review & editing, Supervision. Mabel Mora: Investigation, Writing - review & editing, Supervision.
Declaration of competing interest
The authors declare that they have no known competing financial interests or personal relationships that could have
appeared to influence the work reported in this paper.
Acknowledgments
Joan Colón has received funding from the 2018 call for Ramón y Cajal Grants from the Ministry of Science, Innovation
and Universities, Spain (reference RYC2018-026231-I) co-financed by the State Research Agency, Spain and the European
Social Fund.
Appendix A. Supplementary data
Supplementary material related to this article can be found online at https://doi.org/10.1016/j.eti.2021.101481.
12I. Uald Lamkaddam, E. Blázquez, L. Pelaz et al. Environmental Technology & Innovation 22 (2021) 101481
References
Agyarko-Mintah, E., Cowie, A., Van Zwieten, L., Singh, B.P., Smillie, R., Harden, S., Fornasier, F., 2017. Biochar lowers ammonia emission and improves
nitrogen retention in poultry litter composting. Waste Manage. 61, 129–137. http://dx.doi.org/10.1016/j.wasman.2016.12.009.
Awasthi, M.K., Wang, Q., Huang, H., Li, R., Shen, F., Hussain Lahori, A., Wang, P., Guo, D., Guo, Z., Jiang, S., Zhang, Z., 2016. Effect of biochar amendment
on greenhouse gas emission and bio-availability of heavy metals during sewage sludge co-composting. J. Cleaner Prod..
Bernal, M.P., Lopez-Real, J.M., Scott, K.M., 1993. Application of natural zeolites for the reduction of ammonia emissions during the composting of
organic wastes in a laboratory composting simulator. Bioresour. Technol. 43 (1), 35–39. http://dx.doi.org/10.1016/0960-8524(93)90079-Q.
Bíreš, J., Ihnátová, M., Büchlerová, Z., State, 2005. Hygiene and ecological problems in relation to veterinary medicine. Sci. J. Univ. Vet. KOŠICE —
Slovak Repub. ISSN 49, 3–54.
Blanes-Vidal, V., Topper, P.A., Wheeler, E.F., 2007. Validation of ammonia emissions from dairy cow manure estimated with a non-steady-state,
recirculation flux chamber with whole-building emissions. Trans. ASABE 50 (2), 633–640.
Cao, Y., Wang, X., Bai, Z., Chadwick, D., Misselbrook, T., Sommer, S.G., Qin, W., Ma, L., 2019. Mitigation of ammonia, nitrous oxide and methane
emissions during solid waste composting with different additives: A meta-analysis. J Clean Prod 235, 626–635. http://dx.doi.org/10.1016/j.jclepro.
2019.06.288.
E-PRTR, 2017. European pollutant release and transfer register. https://ec.europa.eu/environment/industry/stationary/e-prtr/legislation.htm.
Ergun, N.G.T., O.N., 2014. Ammonia uptake by natural zeolite in municipal solid waste compost. Environ. Prog. Sust. En. 33 (3), 676–680.
http://dx.doi.org/10.1002/ep.10198.
European Environment Agency, 2019a. Ammonia emissions from agriculture continue to pose problems for Europe 1–2. https://www.eea.europa.eu/
highlights/ammonia-emissions-from-agriculture-continue.
European Environment Agency, 2019b. Ammonia (NH3) emissions. https://www.eea.europa.eu/data-and-maps/indicators/eea-32-ammonia-nh3-
emissions-1/assessment-4.
European Union, 2011. Food: From farm to fork statistics 2011. https://ec.europa.eu/eurostat/documents/3930297/5966590/KS-32-11-743-EN.PDF/
64ace8f7-ea9f-431c-81cd-83ef3a601ea6.
European Union, 2015. Agriculture - ammonia emission statistics main statistical findings 2013. pp. 1–7, https://ec.europa.eu/eurostat/statistics-
explained/index.php?oldid=257567.
Fangueiro, D., Hjorth, E., Gioelli, G., et al., 2015. Acidification of animal slurry — a review. J. Eniron. Manage. 46–56. http://dx.doi.org/10.1016/j.
jenvman.2014.10.001.
FAOSTAT, 2017. Food and Agriculture Organization of the United Nations. http://www.fao.org/faostat/en/#data.
Giacomini, D.A., Aita, C., Pujol, S.B., Giacomini, S.J., Doneda, A., Cantú, .R.R., Dessbesell, A., Lüdtke, R.C., Silveira, C.A., 2014. Mitigação das emissões
de amônia por zeólitas naturais durante a compostagem de dejetos de suínos. Pesquisa Agropecuária Bras. 49 (7), 521–530. http://dx.doi.org/10.
1590/S0100-204X2014000700004.
Gu, W., Sun, W., Lu, Y., Li, X., Xu, P., Xie, K., Sun, L., Wu, H., 2018. Effect of Thiobacillus thioparus 1904 and sulphur addition on odour emission
during aerobic composting. Bioresour. Technol. 249 (2017), 254–260. http://dx.doi.org/10.1016/j.biortech.2017.10.025.
Jiang, T., Ma, X., Tang, Q., Yang, J., Li, G., Schuchardt, F., 2016. Combined use of nitrification inhibitor and struvite crystallization to reduce the NH3
and N2O emissions during composting. Bioresour. Technol. 217, 210–218. http://dx.doi.org/10.1016/j.biortech.2016.01.089.
Kai, P., Pedersen, P., Jensen, J.E., Hansen, M.N., Sommer, S.G., 2008. A whole-farm assessment of the efficacy of slurry acidification in reducing
ammonia emissions. Eur. J. Agron. 28 (2), 148–154. http://dx.doi.org/10.1016/j.eja.2007.06.004.
Kastner, J.R., Miller, J., Das, K.C., 2009. Pyrolysis conditions and ozone oxidation effects on ammonia adsorption in biomass generated chars. J. Hazard
Mater. 164 (2–3), 1420–1427. http://dx.doi.org/10.1016/j.jhazmat.2008.09.051.
Kim, J.H., Kim, S.C., Ko, Y.D., 2005. Effect of dietary zeolite treated on the performance and carcass characteristics in finishing pigs. J. Anim. Sci.
Technol. 47 (4), 555–564. http://dx.doi.org/10.5187/jast.2005.47.4.555.
Li, R., Wang, J.J., Zhang, Z., Shen, F., Zhang, G., Qin, R., Li, X., Xiao, R., 2012. Nutrient transformations during composting of pig manure with bentonite.
Bioresour. Technol. 121, 362–368. http://dx.doi.org/10.1016/j.biortech.2012.06.065.
Li, R., Xu, K., Ali, A., Deng, H., Cai, H., Wang, Q., Pan, J., Chang, C.C., Liu, H., Zhang, Z., 2020. Sulfur-aided composting facilitates ammonia release
mitigation, endocrine disrupting chemicals degradation and biosolids stabilization. Bioresour. Technol. 312 (June), 123653. http://dx.doi.org/10.
1016/j.biortech.2020.123653.
Liu, W., Huo, R., Xu, J., Liang, S., Li, J., Zhao, T., Wang, S., 2017. Effects of biochar on nitrogen transformation and heavy metals in sludge composting.
http://dx.doi.org/10.1016/j.biortech.2017.03.052.
Liu, J., de Neergaard, A., Jensen, L.S., 2019. Increased retention of available nitrogen during thermal drying of solids of digested sewage sludge and
manure by acid and zeolite addition. Waste Manage. 100, 306–317. http://dx.doi.org/10.1016/j.wasman.2019.09.019.
Mao, H., Lv, Z., Sun, H., Li, R., Zhai, B., Wang, Z., Awasthi, K., Wang, Q., Zhou, L., 2018. Improvement of biochar and bacterial powder addition on
gaseous emission and bacterial community in pig manure compost. http://dx.doi.org/10.1016/j.biortech.2018.02.082.
MAPA, 2015. Evaluación de técnicas de gestión de deyecciones en ganadería. Mapa 114.
Milic, D., Tofant, A., Vucemilo, M., Venglovsky, J., Ondrasovicova, O., 2005. The performance of natural zeolite as a feed additive in reducing aerial
ammonia and slurry ammonium ion concentration in the pig farm nursery. Folia Veterinaria 49 (3), 23–25.
Misselbrook, T., Hunt, J., Perazzolo, F., Provolo, G., 2016. Greenhouse gas and ammonia emissions from slurry storage: Impacts of temperature and
potential mitigation through covering (pig slurry) or acidification (cattle slurry). J. Environ. Qual. 45 (5), 1520–1530. http://dx.doi.org/10.2134/
jeq2015.12.0618.
Ndegwa, P.M., Hristov, A.N., Arogo, J., Sheffield, R.E., 2008. A review of ammonia emission mitigation techniques for concentrated animal feeding
operations. Biosyst. Eng. 100 (4), 453–469. http://dx.doi.org/10.1016/j.biosystemseng.2008.05.010.
Nimmermark, S., Gustafsson, G., 2005. Influence of temperature, humidity and ventilation rate on the release of odour and ammonia in a floor
housing system for laying hens. Agric. Eng. Int.: CIGR J.
Pan, J., Li, R., Zhai, L., Zhang, Z., Ma, J., Liu, H., 2019. Influence of palygorskite addition on biosolids composting process enhancement. J. Clean. Prod.
217, 371–379. http://dx.doi.org/10.1016/j.jclepro.2019.01.227.
Petersen, S.O., Andersen, A.J., Eriksen, J., 2012. Effects of cattle slurry acidification on ammonia and methane evolution during storage. J. Environ.
Qual. 41 (1), 88–94. http://dx.doi.org/10.2134/jeq2011.0184.
Portejoie, S., Martinez, J., Guiziou, F., Coste, C.M., 2003. Effect of covering pig slurry stores on the ammonia emission processes. Bioresour. Technol.
87 (3), 199–207. http://dx.doi.org/10.1016/S0960-8524(02)00260-2.
Rhodes, C.J., 2010. Properties and applications of Zeolites. Sci. Prog. 93 (3), 223–284. http://dx.doi.org/10.3184/003685010X12800828155007.
Santonja, G., Georgitzikis, K., Scalet, B., Montobbio, P., Roudier, S., Sancho, L., 2017. Best available techniques (BAT). Reference Document for the
Intensive Rearing of Poultry or Pigs EUR 28674 EN. http://eippcb.jrc.ec.europa.eu/reference/.
Seedorf, J., Hartung, J., 1999. Survey of ammonia concentrations in livestock buildings. J. Agric. Sci. 133 (4), 433–437. http://dx.doi.org/10.1017/
S0021859699007170.
13I. Uald Lamkaddam, E. Blázquez, L. Pelaz et al. Environmental Technology & Innovation 22 (2021) 101481
Steiner, C., Das, K.C., Melear, N., Lakly, D., 2010. Reducing nitrogen loss during poultry litter composting using biochar. J. Environ. Qual. 39 (4),
1236–1242. http://dx.doi.org/10.2134/jeq2009.0337.
Tatar, A., Boldaji, F., Dastar, B., Hassani, S., Yalçin, S., 2012. Effects of dietary supplementation with perlite and zeolite on performance, litter quality
and carcass characteristics of broilers from 7-42 days of age. Int. Res. J. Appl. Basic Sci. 3, 1148–1154.
Venglovsky, J., Sasakova, N., Vargova, M., Pacajova, Z., Placha, I., Petrovsky, M., Harichova, D., 2005. Evolution of temperature and chemical parameters
during composting of the pig slurry solid fraction amended with natural zeolite. Bioresour. Technol. 96 (2), 181–189. http://dx.doi.org/10.1016/
j.biortech.2004.05.006.
Von Borell, E., Eslinger, K.M., Schnitz, A.L., Zhao, Y., Mitloehner, F.M., 2007. Acute and prolonged effects of ammonia on hematological variables,
stress responses, performance, and behavior of nursery pigs. J. Swine Health Prod. 15 (3), 137–145.
Wang, Q., Awasthi, M.K., Ren, X., Zhao, J., Li, R., Wang, Z., Chen, H., Wang, M., Zhang, Z., 2017. Comparison of biochar, zeolite and their mixture
amendment for aiding organic matter transformation and nitrogen conservation during pig manure composting. Bioresour. Technol. 245, 300–308.
http://dx.doi.org/10.1016/j.biortech.2017.08.158.
Webb, J., Menzi, H., Pain, B.F., Misselbrook, T.H., Dämmgen, U., Hendriks, H., Döhler, H., 2005. Managing ammonia emissions from livestock production
in europe. Environ. Pollut. 135 (3), 399–406. http://dx.doi.org/10.1016/j.envpol.2004.11.013.
Zhang, J., Sui, Q., Li, K., Chen, M., Tong, J., Qi, L., Wei, Y., 2016a. Influence of natural zeolite and nitrification inhibitor on organics degradation and
nitrogen transformation during sludge composting. Environ. Sci. Pollut. Res. 23 (2), 1324–1334. http://dx.doi.org/10.1007/s11356-015-5326-5.
Zhang, Y., Zhao, Y., Chen, Y., Lu, Q., Li, M., Wang, X., Wei, Y., Xie, X., Wei, Z., 2016b. A regulating method for reducing nitrogen loss based on enriched
ammonia-oxidizing bacteria during composting. Bioresour. Technol. 221, 276–283. http://dx.doi.org/10.1016/j.biortech.2016.09.057.
14You can also read