Diagnostic Comparison of Changes in Air Quality over China before and during the COVID-19 Pandemic
←
→
Page content transcription
If your browser does not render page correctly, please read the page content below
Diagnostic Comparison of Changes in Air Quality
over China before and during the COVID-19
Pandemic
Arjun Suresh ( asuresh@amity.edu )
Amity University
Diksha Chauhan
Guru Gobind Singh Indraprastha University, India
Amina Othmani
Department of chemistry, Faculty of Sciences of Monastir, University of Monastir, Avenue of the
Environment, Tunisia
Neha Bhadauria
Amity University
Aswin S
Amity University
Jais Jose
Amity University
Nezha Mejjad
. Department of Geology, Faculty of Sciences, Ben M’Sik, University Hassan II- Casablanca,Morocco
Research Article
Keywords: Air Quality, China, COVID-19, Pandemic, Black Carbon.
DOI: https://doi.org/10.21203/rs.3.rs-30482/v1
License: This work is licensed under a Creative Commons Attribution 4.0 International License.
Read Full License
Page 1/20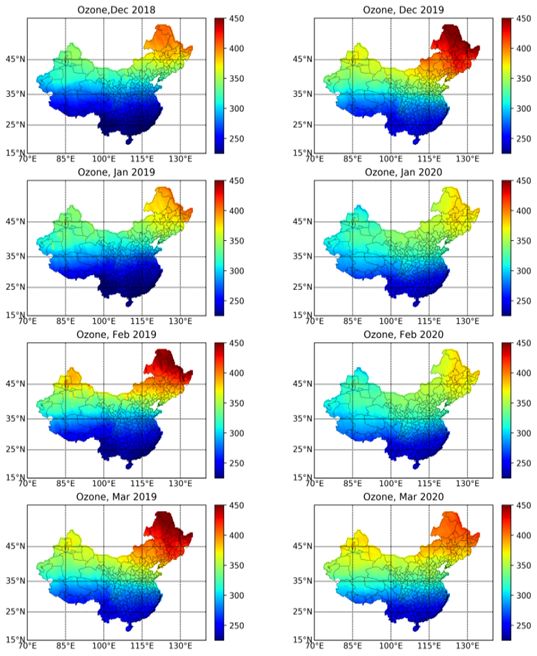
Abstract
The rapid spread of Covid-19 has affected the political, social, and economic sectors, which inevitably
will also affect the environmental component. This contagious virus led the worldwide countries to make
securities measures such as lockdown to reduce the spread of COVID-19 and protect human health. In
contrast to the negative impacts of this virus on the economy, it has in uenced the environment
positively. As reported by station and program for monitoring the Earth, the air quality has improved after
the lockdown. The present study compares the air level pollution one year before and during the spread of
Coronavirus in China. Accordingly, we investigate the change of the concentrations of three air pollutants,
namely, O3, NO2, and black carbon. The study of the measured parameter between December 2019 and
March 2020 exhibit an apparent decrease in their concentrations because of the imposing lockdown of
cities and restriction on chemical industries and factories.

1. Introductions
Incipient viruses are getting a challenge for people all around the world. Corona viruses are among them.
These viruses affect humans, including other mammals and birds. The fast spreading of the COVID-19
cases has created a worldwide pandemic and brought lethal consequences (Wang et al., 2020).
Coronaviruses are very infectious, cause tract diseases that will be lethal. Mild symptoms of corona
include respiratory illness, cough, fever, etc., and can cause multiple organ failure and result in death.
Four kinds of common coronavirus that causes infections in humans are 229E, NL63, OC43, and HKU1.
Most of the people globally can develop a minimum of one amongst these over their lifetime. Three other
coronaviruses emerged in animals and transmitted to humans and produced critical risks to human
health. They are described as SARS-CoV, MERS-CoV, SARS-CoV-2. In step with the WHO, the rst human
cases of SARS-CoV were observed in southern China in November 2002. Previous studies revealed that
SARS-CoV might have originated in bats then transmitted to other animals before infecting humans.
According to the study done by WHO, MERS-CoV, has rstly appeared in September 2012 in an Asian
country and it spread through the close contact of humans with camels as well as through human-to-
human contact.

In late December 2019, a replacement coronavirus has appeared in Wuhan, Hubei Province, China i.e.,
SARS-CoV-2 causes COVID-19. The health administrators in Wuhan have observed a mass of cases of
pneumonia, and the cause was linked to seafood and wet animals wholesale market situated in Wuhan
city. It was also believed that the Wet market of Wuhan might not be the sole source of coronavirus. A
recent study conducted by Società Italiana di Medicina Ambientale (SIMA) has indicated that the
speci city of the important rate spread of the coronavirus in some zones of Northern Italy is seem related
to air pollutions conditions (Martelletti & Martelletti, 2020).

                                                   Page 2/20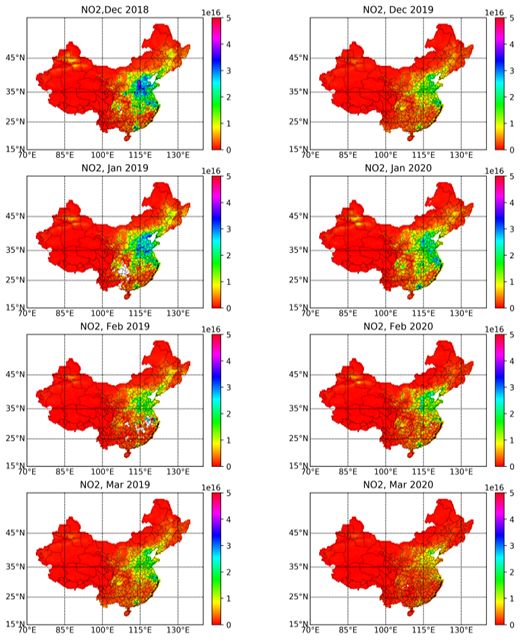
On December 31, 2019, the Chinese Center for Disease Control and Prevention (China CDC) sent off a
team to Wuhan to conduct an investigation, they doled out it and recorded the obtained results. They
found the source of the pneumonia masses in patients and they detected the novel coronavirus in
patients whose specimens were tested by the CDC. Prior, it was suggested that the patients who suffered
by pneumonia and transmitted this virus may have visited the wet animal or seafood market where the
animals sort of a bat, snakes, birds, etc., However, after this investigation, the researchers unveiled that
some individuals infected with this virus do not show any record of a visit to the present wet or seafood
market. Furthermore, this research revealed the human-to-human transmission capability of this new
virus, which is caused by the close contact with an infected person liable to coughing, respiratory droplets
of aerosols, or sneezing. These respiratory droplets enter the physical body by inhalation through the
nose or mouth and then contaminating no infected persons. This virus belongs to the β group of
coronaviruses. The Chinese Researchers named this virus as Wuhan coronavirus or 2019 novel
coronavirus (2019-nCov). Around 210 countries and territories are affecting by COVID-19. The source of
SARS-CoV-2 is not con rmed, but it is believed that it arose from bats.

In early January, the pandemic began to increase rapidly in many cases. It has affected the political,
social, and economic sectors, which inevitably will also in uence the environment. January 24, 2020,
numerous countries have also reported the patients plagued by the same virus, which means that this
virus exported to other countries via infected individuals coming from China. After that, the number of
cases infected with COVID-19 continued to grow up to date, and the number of deaths caused by this
virus exceeds the death amount caused by other types of coronaviruses. The number of con rmed cases
crossed the mark of 1.5 million globally. Until now, no speci c treatments exist to cure or vaccine to cater
to COVID-19. However, symptoms will be treated in clinical conditions. In step with observations, the
recovery time for patients varies from 2 weeks to 3-6 weeks in severe cases. People infected with COVID-
19 generally develop symptoms, including respiratory signs and fever, on a median of 5-6 days after
infection and during a period of 1 to 14 days. Symptoms and signs shown by patients are dry cough,
fever and tiredness. Some patients also develop chest congestion, aches, and pains, diarrhea, runny nose
and in ammatory disease.

As of April 14, the WHO has been reported 19, 20,918 con rmed cases and 1, 19,686 death cases
worldwide (Table 1; Fig.1). Currently, every nation is trying to regulate and limit the transmission of SARS-
CoV-2 in humans. On a global level, lockdown is adopted to prevent the public gathering, keep people at
their homes and keep them aloof from their o ces, public transports, etc.. In order to keep up social
distancing, various other methods were adopted. In turn, the USA, Italy, Spain, China have been almost
coms to rest. Streets, Malls, theatres, etc. are deserted, aircraft grounded, travel restricted. Factories shut
down, events canceled and postponed, and all activities were blocked.

COVID-19 has dramatically impacted the world economy, the petrol barrel price has shut down and
recently the benchmark US oil prices fell below zero for the rst time in the whole history of the oil market.
The coronavirus crisis is the leading cause that has pushed demand for oil after the airlines reduced
services, and travel restrictions lowered the amount of petrol pump activity. Besides, the petrol stations
                                                    Page 3/20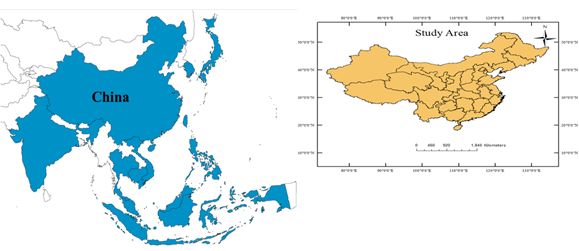
are now selling less fuel because of the containment, which dropped off the human consumption rate.
The mining activities around the world were also closed because of coronavirus, which caused an
increasing trend of metals prices. The tourism activities were also postponed in the whole world in order
to stop the virus spread.

These all activities generate every day high amount of pollutants in air, land and rivers, which reach easily
ocean. The temporary suspend of these activities may have impacted positively the air quality. In order to
understand how the economic impacts of Covid-19 have in uenced the environment a diagnostic
comparison between the air quality before and after Covid-19 is needed. Currently, numerous studies are
undergoing to investigate the effect of con nement on environment, which could be helpful to standard
individuals and partially offset the costs of these counter-COVID-19 measures. As an example, satellite
pictures caught a pointy decision in pollution in many countries that have taken aggressive measures on
the transmission of the virus.

Table 1 . COVID-19 confirmed cases and deaths as of 14 th April 2020 (WHO Report 2020)

Region                                 Confirmed Cases                 Confirmed Deaths

Global                                     19,20,918                       1,19,686

United States                              5,87,337                         23,649

Spain                                      1,70,009                         17,756

Italy                                      1,59,516                         20,465

China                                       82,249                           3,341

India                                       10,363                            339

Since a long time air pollution is affecting each and every part of the world. It is one of the biggest
environmental and health problems worldwide. It could be a risk factor leading to death due to heart
disease, attacks, respiratory infections, lung cancer, diabetes, and chronic pulmonary disease. (Suresh A,
2020; Bhardwaj P,2019 ) There are many reports, research articles, papers and analyses, which have
explained a direct impact of air pollution in respiratory diseases (Guan et al., 2016; Li J et al., 2016;
Komalkirti A et al., 2016; Schiavoni G et al., 2017). According to WHO, every year, around 7 million people
die because of severe diseases caused by air pollution; disease includes stroke, cancers, heart disease
and respiratory disease. Chemically, air pollutants can be presented as the vapor forms of inorganic
pollutants, such as carbon monoxide (CO), ozone (O3) nitrogen dioxide (NO2), and sulfur dioxide (SO2), or
as the aerosols (Li J et al., 2016; Bloemsma L.D et al., 2016; A.Othmani et al., 2019).

NO2, which is associated with mortality and morbidity, is a common tracer of industrial activity/air
pollution (He et al., 2020a , b). Ordinarily, the concentration of NO2 above 200 micrograms per cubic meter

                                                       Page 4/20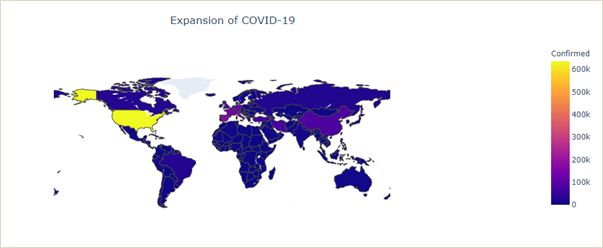
has been considered as toxic gas (WHO 2018a). CO2 is considered as another common tracer of air
pollution (Hanaoka and Masui, 2019). In 2017, it was estimated that globally, air pollution contributed
9% of deaths, and it ranged from an occasional 2% across high-income countries to shut to 15% across
many countries in South and East Asia (Hannah et al., 2019). The particulate forms of air pollutants
comprise of the most harmful forms of particulate matter (PM) include PM10 (
regions in the country are having starkly different microclimates. Regional difference in the climatic
condition of the country is due to its highly complex topography. Asian countries remain
disproportionately affected by toxic air and so-called pollution-related problems in consideration with a
large population, crowded cities, industrial emissions, etc. Ways adopted for the rapid economic
development in the country has led to severe air pollution. The main cause of air pollution in the country
is due to the seriousness of pollution, especially in the metropolitan cities throughout the county.

2.2 Methodology

Ozone Monitoring Instrument (OMI) is a Dutch Finnish ozone monitoring image spectrometer (Table 2).
The instrument is designated for distinguishing ozone and other atmospheric species. OMI sensor has a
spectral region of 264 – 504 nm, a spectral resolution of 0.42 nm – 0.63 nm, and a resolution of 0.125 ×
0.1250. The high spectral and spatial resolution of the instrument is the key to the detection of air
pollution of urban scale resolution. The acquisition of measurement from tropospheric and stratospheric
levels of the earth's atmosphere is the main objective of the instrument's mission. MERRA-2 stands for
Modern-Era Retrospective analysis for Research and Applications version 2. The MERRA project focuses
on historical climate analyses for a broad range of weather and climate time scales and places the NASA
Earth Observatory System (EOS) suite of observations in a climate context.

Table 2 : Details of Satellite Data used for current study

        Satellite Sensor                    Resolution                   Duration

    OMI (Ozone Monitoring                  0.25 degree               December to March
         Instrument)
                                                                      2019 and 2020

       MERRA – 2 Model                  0.5 × 0.625 degree           December to March

                                                                      2019 and 2020

For the study of total column ozone, the TOMS-like OMTO3e product has been used. It selects the best
pixel data from the good quality level-2 total column ozone data (OMTO3). This product data falls in the
0.25 x 0.25-degree global grids. For the study of the tropospheric column, NO2OMNO2d data product has
been selected. It is a Level-3 Gridded Product where pixel-level data of good quality are falling into
0.25x0.25 degree global grids. This product contains Tropospheric Column NO2, for all atmospheric
conditions, with less than 30 percent cloud fraction. Black Carbon is one of the primary constituent
components of atmospheric aerosols. Black carbon aerosols are highly absorbing and an essential factor
in radiative forcing and radiative transfer. For the study of Black carbon, the M2TMNXAER product has
been selected.

                                                         Page 6/20
Monthly averaged data from January to March are used for the study from the years 2019 and 2020.
During the processing and the interpretation of satellite data, the GIS tool has been used primarily for
mapping and for managing the geographical data information in a database. High-level languages are
used for analyzing and visualizing the satellite-derived data products for the study. MATLAB and ORIGIN
software has been used for numerical computation of the data.
3. Results And Discussion
Three parameters in uencing parameters namely; the ozone (O3), the Nitrogen Dioxide (NO2) and Black
Carbon have harmful impacts on environmental safety due to their toxic effect on fauna and ora. In this
context, it seems important to study their variation before and after the spread of Corona virus and to
predict the main relation between their concentrations and the spread of Corona virus . A comparative
study of the obtained rates before and after the spread of corona virus was reported.
3.1. Ozone (O3)
Ozone is a gas made up of 3 atoms of oxygen. It occurs naturally in the uppermost layer of the
atmosphere, i.e., stratosphere and at ground level due to chemical reactions. Ozone is formed in a lower
atmosphere near the earth's surface by the reaction of air pollutants released from vehicles, industries,
chemical plants, and from other sources. These air pollutants react chemically in the presence of sunlight
and form ozone. Stratospheric ozone is good as it protects us from the harmful ultraviolet radiation
coming from the sun. It forms a protective layer that acts as a barrier against UV rays of the sun.
Exposure of UV radiation can cause skin allergy, irritation in eyes, skin cancer, etc.
Conversely, the ozone layer which is present at ground level is very harmful to us. It acts as an air
pollutant because of its adverse effects on humans and the environment. The life of individuals most at
risk from inhaling air containing harmful ozone includes individuals who have asthma, workers, older
children who are active outdoors. In addition, ground-level ozone affects ecosystems and vegetation,
including forests, grasslands, and parks, including wildlife and wilderness areas.
The O3 level change measured in china from December 2019 to March 2020 is illustrated was studied.
Figure 3 shows the level of O3 fell in China during lockdown because of the COVID-19 spread. In
December 2019, the level of O3 over China was very high due to the high amount of pollutant generated
from practiced human activities. A signi cant decline of O3 was observed in January 2020, the imposing
lockdown of cities and restriction on chemical industries and factories a have positively in uenced the
current situation where a decrease of O3 was obtained. In February 2020, the level is almost the same as
January, whereas there is a signi cant increase in O3 level characterized in March 2020 when the
Government resumed some of the industrial activities. In light of these results, we can highlight the
dependence of the change of O3 level to the industrial activities.
Page 7/20According to gure 4, there is an apparent increase in the mean concentration of ozone from December to
March. As the results point, the mean concentration decreases before December 30, 2018, and again
increases on December 30, 2019. An ozone maximum of 326.91 DU mean concentration was recorded in
March as compared with the lowest 293.20 DU in December. Over the years, the mean concentration of
ozone is increasing in China.
Figure.5 shows a signi cant increase in the mean concentration of Ozone in China during the period of
the lockdown. The mean concentration of ozone varies from 307.87 to 336.60 DU from December to
March. The comparison of the obtained results of the mean concentration of ozone during COVID-19
lockdown with the mean concentration of last year (Fig.4; table 3) reveals that the mean concentration of
ozone is less important during the lockdown, which is certainly due to the decline of human-made
emissions. Whereas, the variation of ozone reached about 11% in January 2020 because of the severe
restrictions imposed by China in this month. In contrast, this percentage has decreased and reached 6%
in February and 3% in March 2020. Some factories were resumed in the late February and March.
Table 3. Mean Concentration and variation of Ozone
Month 2018-2019 2019-2020 Variation %
December 293.20 307.87 14.66 5%
January 294.83 326.38 31.55 11%
February 310.99 330.70 19.71 6%
March 326.91 335.60 8.68 3%
3.2. Nitrogen Dioxide (NO2)
Nitrogen dioxide is one of a component of a bunch of gaseous air pollutants. It is produced by various
human activities like tra c, combustion of nitrogen-containing fuels, and many more.(A.Othmani, et al.,
2019; C. Lopez, et al., 2020). Once nitrogen is released into the air, it reacts with oxygen present in the air
at very high temperatures. Moreover, Nitrogen dioxide reacts with water to form nitric acid, which is
extremely corrosive (.T. M. Guamushig et al.,2019; C.-P. Lopez et al.,2019; Tituana JC. et al.,2018) If
individuals inhale nitrogen dioxide, it proceeds through the upper respiratory tract and reaches lungs
where it can react with water present in the lungs and forms nitric acid, which is extremely toxic in high
quantity and causes tissue damage. Nitrogen dioxide is also one of the greenhouse gases, it contributes
to global warming, and if NO2 reacts in the atmosphere with sulfur dioxide, it forms acid rain, which
contributes to the depletion of the ozone layer.(Jose J et al., 2020)
Unlike in 2019, the level of NO2 did not rise after the Chinese New Year in 2020. As illustrated in Fig.6, the
satellite images of China amid COVID-19 showed a reduction of the level of NO2 over it. The map shows
Page 8/20the variation in NO2 concentration in blue, yellow, green, sea green, orange, and red. Red and blue color
shows a high concentration of NO2, while orange color shows the low concentration. In December 2018,
the blue color was more as compared to December 2019; this shows that the level of NO2 concentration
in December 2018 is higher than in December 2019. The reduction of NO2 started in December 2019 in
Wuhan and then spread to the rest of the country (NASA, 2020). Nevertheless, in February 2019 and
February 2020, no signi cant change is observed. Typically, there are lower levels of NO2 during February
in China around Chinese New Year. These important reduce in percentages can be depending on the
closure of many businesses and factories for celebration. Moreover, there is a large difference seen in
March. Indeed, in March 2020, there is a considerable reduction observed in NO2 concentration compared
to the obtained concentration in March 2019.
The time-series analysis shows the national average monthly mean NO2 from December 2018 to March
2019 in china. The concentration of NO2 was found higher in late January, which can be attributed to the
meteorological conditions in winter and some other anthropogenic activities such as winter heating. In
fact, as heating increases the amount of coal used that adds up in the concentration of NO2. Further, the
large reduction has been observed in February and March due to the environmental effects such as the
seasonal variation, the atmospheric temperature and the humidity. Most of these factors were
comparatively high that accelerate the oxidization of NO2 in the air. (Wang et al., 2020).
From the time series data presented in Figure. 8, it is well noticed that the concentration of NO2 has
decreased gradually in late January following the enforced quarantine measures and widespread
lockdown in the country. However, from the beginning of March, the NO2 levels have risen up again as
china has eased restriction measures and movement ramps up. NO2 is classi ed among the hazardous
air pollutant; its long-term exposure can cause many respiratory diseases including hypertension, heart
and cardiovascular diseases and even death.This pollutant can be primarily generated through
anthropogenic sources such as tra c and power plants including some natural phenomenon like
lightening and soil processes. According to a recent study, the long-term exposure of NO2 may be one of
the most signi cant contributors to deaths caused by COVID-19 pandemic. (Ogen et al., 2020).
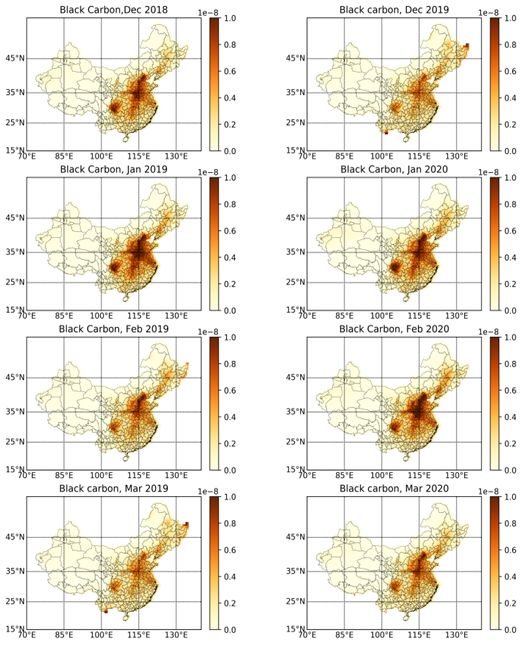
3.3 Black Carbon
Black Carbon is a chemical component, released from diesel engines and gas mainly. It is formed by the
process of incomplete combustion of fossil fuel, biomass and biofuels. Black carbon is considered as a
signi cant contributor to climate change. It is emitted by both natural factors and human activities. It
warms the air by absorbing solar energy and hence counts in one of the signi cant climate change
pollutants. Black Carbon tends to hasten the melting of ice; hence when it falls on snow, it warms the
snow and also its sooty nature darkens the surface of ice and snow. When Black Carbon enters the body,
it causes cancer, cardiovascular disease, and birth defects.
Page 9/20China, along with India, comprises 25-35% of global Black Carbon emission. The usage of biofuels and
coal is very high to satisfy the humankind demand in China, which results in the emission of a
considerable amount of Black Carbon, which has fell in China by around 25% over the four weeks in
January 2020 during the lockdown.
4. Conclusion
This study provides an analysis of changes in Air Quality over China during the COVID-19 pandemic
concerning the period from December 2018 to March 2020. Three parameters were evaluated namely; O3,
NO2 and Black Carbon. Results showed an increase in the mean concentration of O3 during the pandemic
compared to the last year. The increase in the mean concentration of O3 is most signi cant in March
2020, just after the removal of lockdown and other restrictions. O3 levels during COVID-19 over china are
studied by using a TOMS-like OMTO3e product. Whereas the mean concentration of NO2 has decreased
during the lockdown period due to the restrictions imposed by the government and the impediment of
economic activities during the lockdown period. After downsizing the restrictions in some regions, a
progressive increase in pollutants level was obtained. Therefore, more time is required for passing
through this problem.
China is the largest emitter of CO2 and other greenhouse gases. As regards biogenic VOC, isoprene
closely associates with ozone and other pollutants with NO2 and Black Carbon. Up to date, there is no
evidence of a direct relation between climate change and the emergence of transmission of Corona Virus.
However, a deep understanding of the in uence of main impacts of COVID-19 lockdown on other
parameters is de nitively required.
Declarations
Acknowledgements
Analyses and visualization used in this study were produced with online data systems, developed and
maintained by NASA space GES-DISC.
Competing interests: The authors declare no competing interests.
References
1. Othmani, A.Kesraoui, H. Akrout, M. López, M.Seffen, M. Valiente(2019). Use of alternating current for
colored water puri cation by anodic oxidation with SS/PbO2 and Pb/PbO2 electrodes,ESPR.
doi:https://doi.org/10.1007/s11356-019-05722-w.
2. Anjum, N. A. (2020). Good in The Worst: COVID-19 Restrictions and Ease in Global Air Pollution.
3. Apte, J. S., Marshall, J. D., Cohen, A. J., &Brauer, M. (2015). Addressing global mortality from ambient
PM2. 5. Environmental science & technology, 49(13), 8057-8066.
Page 10/204. Apte, K., &Salvi, S. (2016). Household air pollution and its effects on health. F1000Research, 5.
5. Backer, A. (2020). Why COVID-19 May Be Disproportionately Killing African Americans: Black
Overrepresentation among COVID-19 Mortality Increases with Lower Irradiance, Where Ethnicity Is
More Predictive of COVID-19 Infection and Mortality Than Median Income. Where Ethnicity Is More
Predictive of COVID-19 Infection and Mortality Than Median Income (April 8, 2020).
6. Bhardwaj, P., Suresh, A., Jose, J., Nathalia, D., & Jain, V. (2019). Satellite monitoring for spatio-
temporal changes occurring in forest area of Sariska Tiger Reserve by implementing GIS and Remote
Sensing techniques, 10, 26–36.
7. Lopez, M. Santorum, and J. Aguilar, “FAVO: Framework of Autonomous Virtual Organizations based
on Industry 4.0,” Iberian Journal of Information Systems and Technologies., vol. E27, pp. 333–345,
2020.
8. -P. Lopez, M. Santórum, and J. Aguilar, “Autonomous Cycles of Collaborative Processes for
Integration Based on Industry 4.0,” vol. 918, Á. Rocha, C. Ferrás, and M. Paredes, Eds. Cham: Springer
International Publishing, 2019, pp. 177–186.
9. DeVries, D. E., & McGrath, T. J. (2020). U.S. Patent No. 10,604,011. Washington, DC: U.S. Patent and
Trademark O ce.
10. Fantke, P., Jolliet, O., Evans, J. S., Apte, J. S., Cohen, A. J., Hänninen, O. O., ... &Loh, M. M. (2015).
Health effects of ne particulate matter in life cycle impact assessment: ndings from the Basel
Guidance Workshop. The International Journal of Life Cycle Assessment, 20(2), 276-288.
11. Guan, W. J., Zheng, X. Y., Chung, K. F., &Zhong, N. S. (2016). Impact of air pollution on the burden of
chronic respiratory diseases in China: time for urgent action. The Lancet, 388(10054), 1939-1951.
12. Hamra, G. B., Laden, F., Cohen, A. J., Raaschou-Nielsen, O., Brauer, M., & Loomis, D. (2015). Lung
cancer and exposure to nitrogen dioxide and tra c: a systematic review and meta-analysis.
Environmental health perspectives, 123(11), 1107-1112.
13. Hanaoka, T., & Masui, T. (2020). Exploring effective short-lived climate pollutant mitigation scenarios
by considering synergies and trade-offs of combinations of air pollutant measures and low carbon
measures towards the level of the 2 C target in Asia. Environmental Pollution, 261, 113650.
14. Hannah, J. (2019). Iran-backed militias are in Iraq to stay. Foreign Policy.
15. Jose, J., Yuvaraj, E., Kaushik, B., Singh, N., & Suresh, A. (2020). Global tsunami hazard web map for
mitigation and rescue operation. International Journal of Scienti c and Technology Research, 9(1),
1009–1011.
16. Kass, D. M., Kleinboehl, A., Shirley, J. H., Scho eld, J. T., McCleese, D., & Heavens, N. G. (2018).
Overview of the 2018a Global Dust Event from Mars Climate Sounder Observations.AGUFM, 2018,
P34A-02.
17. Lan, X., & Forbes, N. (2006). Will China become a science and technology superpower by 2020? An
assessment based on a national innovation system framework. Innovations: Technology,
Governance, Globalization, 1(4), 111-126
Page 11/2018. Li, Z., Lau, W. M., Ramanathan, V., Wu, G., Ding, Y., Manoj, M. G., ...& Fan, J. (2016). Aerosol and
monsoon climate interactions over Asia. Reviews of Geophysics, 54(4), 866-929.
19. Martelletti, L., Martelletti, P. (2020). Air Pollution and the Novel Covid-19 Disease: a Putative Disease
Risk Factor. SN Comprehensive Clinical Medicine https://doi.org/10.1007/s42399-020-00274-4
20. Ogen, Yaron. "Assessing nitrogen dioxide (NO2) levels as a contributing factor to the coronavirus
(COVID-19) fatality rate." Science of the Total Environment(2020): 138605.
21. Patra, A. K., Gautam, S., & Kumar, P. (2016). Emissions and human health impact of particulate
matter from surface mining operation—A review. Environmental Technology & Innovation, 5, 233-249.
22. Schiavoni, G., D'Amato, G., &Afferni, C. (2017). The dangerous liaison between pollens and pollution
in respiratory allergy. Annals of Allergy, Asthma & Immunology, 118(3), 269-275.
23. SIMA - Società Italiana di Medicina Ambientale; 2020. p. 1–5. http://www.simaonlus.it/wpsima/wp-
content/uploads/2020/03/ COVID19_Position-Paper_Relazione-circa-l’effettodell’inquinamento-da-
particolato-atmosferico-e-la diffusione-divirus-nella-popolazione.pdf.
24. Smit, L. A. M., Bloemsma, L. D., &Hoek, G. (2016). C55 CARDIOPULMONARY EFFECTS OF AIR
POLLUTION: Panel Studies On Acute Effects Of Air Pollution In Patients With COPD: A Systematic
Review And Meta-Analysis. American Journal of Respiratory and Critical Care Medicine, 193, 1.
25. Smith, S. J., van Aardenne, J., Klimont, Z., Andres, R. J., Volke, A., & Delgado Arias, S. (2011).
Anthropogenic sulfur dioxide emissions: 1850-2005. Atmospheric Chemistry and Physics, 11(3),
1101-1116
26. Suresh, A. (2020). Mystery over the Haze during 1st week of November 2019 in Delhi-NC
https://doi.org/10.20944/PREPRINTS202004.0156.V1
27. SutkusJr, D. J., Baughcum, S. L., DuBois, D. P., & Wey, C. C. (2003). Commercial aircraft emission
scenario for 2020: Database development and analysis.
28. M. Guamushig, C. P. Lopez, M. Santorum, and J. Aguilar, “Characterization of a fourth generation
virtual organization based on industry 4.0,” International Conference on Information Systems and
Software Technologies, ICI2ST 2019, pp. 182–186, 2019.
29. Tituana JC., Lopez CP., Guun Yoo S. (2019) Method for the Automated Generation of a Forest Non
Forest Map with LANDSAT 8 Imagery by Using Arti cial Neural Networks and the Identi cation of
Pure Class Pixels. In: Botto-Tobar M., Pizarro G., Zúñiga-Prieto M., D’Armas M., Zúñiga Sánchez M.
(eds) Technology Trends. CITT 2018. Communications in Computer and Information Science, vol
895. Springer, Cham
30. van Rooij, B., de Bruijn, A. L., Folmer, C. R., Kooistra, E., Kuiper, M. E., Brownlee, M., ... & Fine, A. (2020).
Compliance with COVID-19 Mitigation Measures in the United States.
31. Wang, D., Hu, B., Hu, C., Zhu, F., Liu, X., Zhang, J. & Zhao, Y. (2020). Clinical characteristics of 138
hospitalized patients with 2019 novel coronavirus-infected pneumonia in Wuhan, China. JAMA
[Internet]. 2020 Feb [cited 2020 Mar 23]; 323 (11): 1061-9.
32. Wang, Lijun, Ju Wang, Xiaodong Tan, and Chunsheng Fang. "Analysis of NOx Pollution
Characteristics in the Atmospheric Environment in Changchun City." Atmosphere11, no. 1 (2020): 30.
Page 12/2033. World Health Organization. Coronavirus disease (COVID-19) - events as they happen. 2020. Available
at: https://wwwwhoint/emergencies/diseases/novel-coronavirus-2019/events-as-theyhappen.
34. Zhao, S., Lin, Q., Ran, J., Musa, S. S., Yang, G., Wang, W., ...& Wang, M. H. (2020). Preliminary
estimation of the basic reproduction number of novel coronavirus (2019-nCoV) in China, from 2019
to 2020: A data-driven analysis in the early phase of the outbreak. International journal of infectious
diseases, 92, 214-217.
35. Zhou, Y. H., Qin, Y. Y., Lu, Y. Q., Sun, F., Yang, S., Harypursat, V., ...& Li, Y. (2020). Effectiveness of
glucocorticoid therapy in patients with severe novel coronavirus pneumonia: protocol of a
randomized controlled trial. Chin Med J (Engl).
36. Zhu, Q., Li, X., Li, F., & Zhou, D. (2020). The potential for energy saving and carbon emission reduction
in China’s regional industrial sectors. Science of The Total Environment, 716, 135009.
Figures
Figure 1
Pattern of COVID-19 con rmed cases as of 14th April 2020. Note: The designations employed and the
presentation of the material on this map do not imply the expression of any opinion whatsoever on the
part of Research Square concerning the legal status of any country, territory, city or area or of its
authorities, or concerning the delimitation of its frontiers or boundaries. This map has been provided by
the authors
Page 13/20Figure 2
Study Area. Note: The designations employed and the presentation of the material on this map do not
imply the expression of any opinion whatsoever on the part of Research Square concerning the legal
status of any country, territory, city or area or of its authorities, or concerning the delimitation of its
frontiers or boundaries. This map has been provided by the authors
Page 14/20Figure 3
Image showing the status of O3 before and amid COVID-19 restrictions. Note: The designations
employed and the presentation of the material on this map do not imply the expression of any opinion
whatsoever on the part of Research Square concerning the legal status of any country, territory, city or
area or of its authorities, or concerning the delimitation of its frontiers or boundaries. This map has been
provided by the authors
Page 15/20Figure 4
Time Series of Area Averaged Total Column Ozone during Dec 2018- March 2019.
Page 16/20Figure 5
Time Series of Area Averaged Total Column Ozone during Dec2019- March 2020
Page 17/20Figure 6
Image showing the status of NO2 before and amid COVID-19 restrictions Note: The designations
employed and the presentation of the material on this map do not imply the expression of any opinion
whatsoever on the part of Research Square concerning the legal status of any country, territory, city or
area or of its authorities, or concerning the delimitation of its frontiers or boundaries. This map has been
provided by the authors
Page 18/20Figure 7
Time Series of Area Averaged NO2 during Dec 2018- March 2019
Figure 8
Time Series of Area Averaged NO2 during Dec2019- March 2020
Page 19/20Figure 9
Image showing the status of Black Carbon before and amid COVID-19 restrictions. Note: The
designations employed and the presentation of the material on this map do not imply the expression of
any opinion whatsoever on the part of Research Square concerning the legal status of any country,
territory, city or area or of its authorities, or concerning the delimitation of its frontiers or boundaries. This
map has been provided by the authors
Page 20/20You can also read