WORLD AIR QUALITY REPORT - 2018 Region & City PM2.5 Ranking - AirVisual
←
→
Page content transcription
If your browser does not render page correctly, please read the page content below
2018
       WORLD
  AIR QUALITY
      REPORT
Region & City PM2.5 Ranking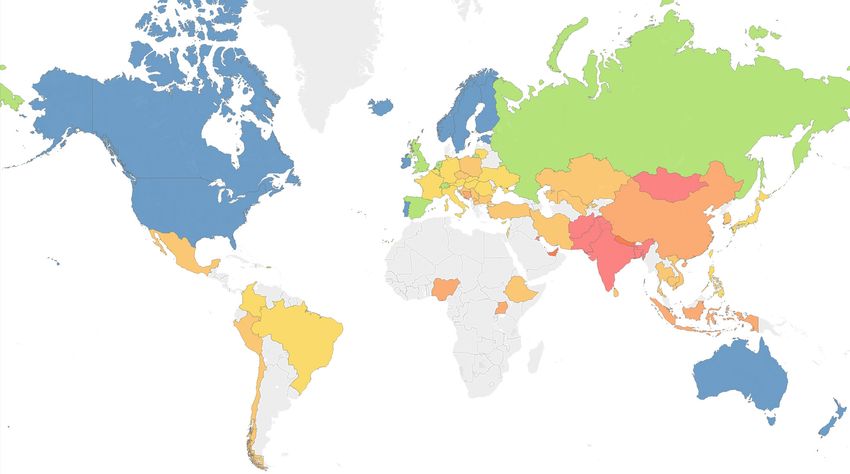
Contents
        About this report .......................................................              3
        Executive summary ...................................................                  4
        Where does the data come from? ................................                        5
           Why PM2.5?
        Data presentation .....................................................                6
           WHO Air Quality Guidelines
           US Air Quality Index (AQI)
        Global overview ........................................................               7
           World country ranking
           World capital city ranking
           Overview of public monitoring status
        Regional Summaries
           EAST ASIA .....................................................................     10
           SOUTHEAST ASIA ...........................................................          11
           SOUTH ASIA ..................................................................       12
           MIDDLE EAST .................................................................       13
           EUROPE .........................................................................    14
           NORTHERN AMERICA ......................................................             15
           LATIN AMERICA & CARIBBEAN ........................................                  16
           AFRICA ..........................................................................   17
        Next Steps ...............................................................             18
           What can I do?
        Methodology ............................................................. 19
           Data sources
           Data calculation
           Data availability
           Disclaimer
        FAQ .......................................................................... 21
        Acknowledgements ................................................... 22

2 |
About this report
      Since 2015, the IQAir AirVisual app and website have provided a centralized platform for global and hyper-local
      air quality information in real-time.

      Through aggregating and validating real-time data from governments and monitors operated by individuals and
      organizations, IQAir AirVisual strives to promote access to real-time air quality information, to allow people to
      take actions to improve air quality and protect their health.

      The 2018 World Air Quality Report presents PM2.5 air quality data as aggregated through the IQAir AirVisual
      platform in 2018. The data included is a subset of information provided through the platform, including only
      PM2.5 measured from ground-based stations with high data availability.

      This report accompanies an extended online interactive display of the world’s most polluted cities, which allows
      further exploration of air quality across different regions and subregions in 2018. The real-time status of all
      included locations, together with many more, can also be explored through the IQAir AirVisual Air Quality Map,
      which brings together live air quality readings in one accessible place.

3 |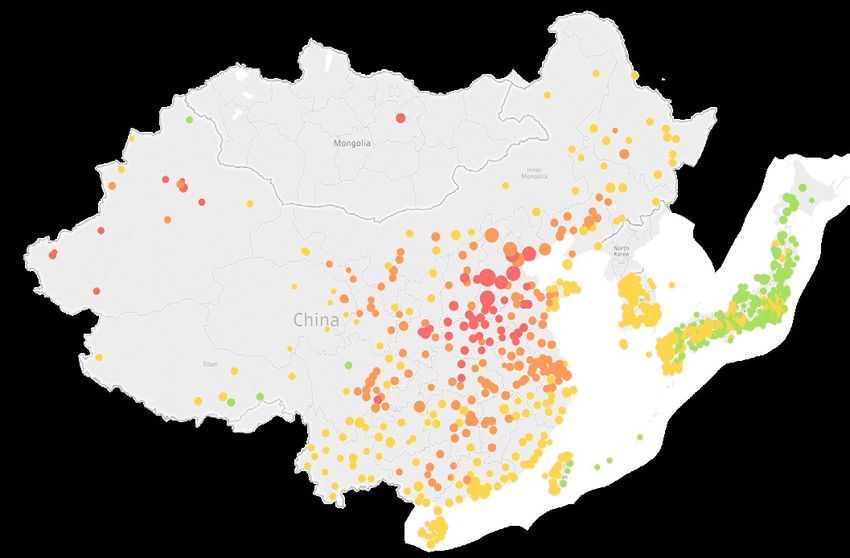
Executive summary
      Air pollution is the greatest environmental risk to health today, estimated to contribute to 7 million premature deaths1
      every year. Polluted air presents the world’s 4th leading contributing cause of early deaths, and burdens the global
      economy with an estimated annual cost of $225 billion (USD)2.

                                                               This report is based on 2018 air quality data from public monitoring
                                                               sources, with a focus on data which has been published in real-time
      Whilst the WHO                                           or near real-time. These sources include government monitoring
                                                               networks, as well as validated data from air quality monitors operated
      estimates that 9 out of                                  by private individuals and organizations.
      10 people worldwide are
                                                               Out of the over 3000 cities included, 64% exceeded the WHO’s annual
      now breathing unsafe                                     exposure guideline for fine particulate matter, also known as PM2.5.
      polluted air, huge parts                                 100% of measured cities within the Middle East and Africa exceeded
                                                               this guideline, while 99% of cities in South Asia, 95% of cities in
      of the world still lack                                  Southeast Asia, and 89% of cities in East Asia also exceed this target.
      access to real-time data.                                As many areas lack up-to-date public air quality information and are
                                                               for this reason not represented in this report, the total number of
                                                               cities exceeding the WHO PM2.5 threshold is expected to be higher.

      The city ranking shows Asian locations dominating the highest 100 average PM2.5 levels during 2018, with cities
      in India, China, Pakistan and Bangladesh occupying the top 50 cities. Numerous cities within the Middle East
      region also rank highly, with Kuwait City, Dubai and Manama all exceeding the WHO guideline by over 500%.

      At a country level, weighted by population, Bangladesh emerges as the most polluted country on average, closely
      followed by Pakistan and India, with Middle Eastern countries, Afghanistan and Mongolia also within the top 10.

      Southeast Asia’s most polluted cities during 2018 were the capitals
      Jakarta and Hanoi, with a number of Thai cities also ranking highly in this
      region. Public awareness of local pollution levels in these countries has                                      Awareness of air
      grown considerably during 2018, as well as in South Korea and Pakistan.                                        pollution remains low
      Public engagement with air pollution also increased in the United States
      and Canada, particularly during the severe wildfires which punctuated                                          in areas where
      part of the region’s generally low PM2.5 levels during August and November.                                    real-time monitoring
      Real-time, public air quality information is essential not only to empower                                     is limited but
      populations to respond to current conditions and protect human health,                                         pollution levels may
      but also is a cornerstone in generating public awareness and driving
      action to combat air pollution in the long-term. More monitoring is needed                                     be high.
      in large parts of the world without access to this information.

      1   https://www.who.int/news-room/detail/02-05-2018-9-out-of-10-people-worldwide-breathe-polluted-air-but-more-countries-are-taking-action
      2   http://www.worldbank.org/en/news/press-release/2016/09/08/air-pollution-deaths-cost-global-economy-225-billion

4 |
Where does the data come from?
Data included in this report has been aggregated from a range of continuous governmental monitoring sources,
as these measurements have been made public in real-time (generally on an hourly basis). In addition, data
from a selection of validated outdoor IQAir AirVisual air quality monitors operated by private individuals and
organizations have been included. Some locations in Europe are supported by additional PM2.5 data provided
by the European Environment Agency, and in some cases other governmental historical data where available.1
Measurements have been collected at a monitoring station level, then grouped into settlements. Whilst the sizes
of these settlements vary, the majority are urban locations, and so for the purpose of this report, all settlements
are hereafter referred to as cities.
Why PM2.5?
The report focuses on PM2.5 as a representative measure of air pollution. PM2.5 refers to particulate matter
(ambient airborne particles) which measure up to 2.5 microns in size, and has a range of chemical makeups and
sources. PM2.5 is widely regarded as the pollutant with the most health impact of all commonly measured
air pollutants. Due to its small size PM2.5 is able to penetrate deep into the human respiratory system and from
there to the entire body, causing a wide range of short- and long-term health effects.
Particulate matter is also the pollutant group which affects the most people globally.
It can come from a range of natural as well as man-made sources. Common sources
of PM include combustion (from vehicle engines, industry, wood and coal burning),
as well as through other pollutants reacting in the atmosphere.
1 Methodology, p.19.
5 |Data presentation
To relate exposure to potential health impacts, this report refers to two guidelines for PM2.5 pollution: the World
Health Organization (WHO) Air Quality Guideline value for PM2.5 exposure and the United States Air Quality
Index (US AQI). The US AQI color scale is used, supplemented by the WHO guideline.
WHO Air Quality Guideline
The WHO recommends an annual mean exposure threshold of 10 μg/m³ to minimize the risk of health impacts
from PM2.5, whilst advising that no level of exposure has been shown to be free of health impacts1.
WHO PM2.5 Target: 10 µg/m³
United States Air Quality Index (US AQI)
The US AQI is one of the most widely recognized AQI systems available. The US AQI converts pollutant concentrations
into a color-coded scale of 0-500, to easily represent the level of associated health risk. The US AQI’s “Good”
range (Global overview
PM2.5
(µg/m³)
250.4
150.4
55.0
45.0
35.4
20.0
12.0
10.0
WHO
guideline
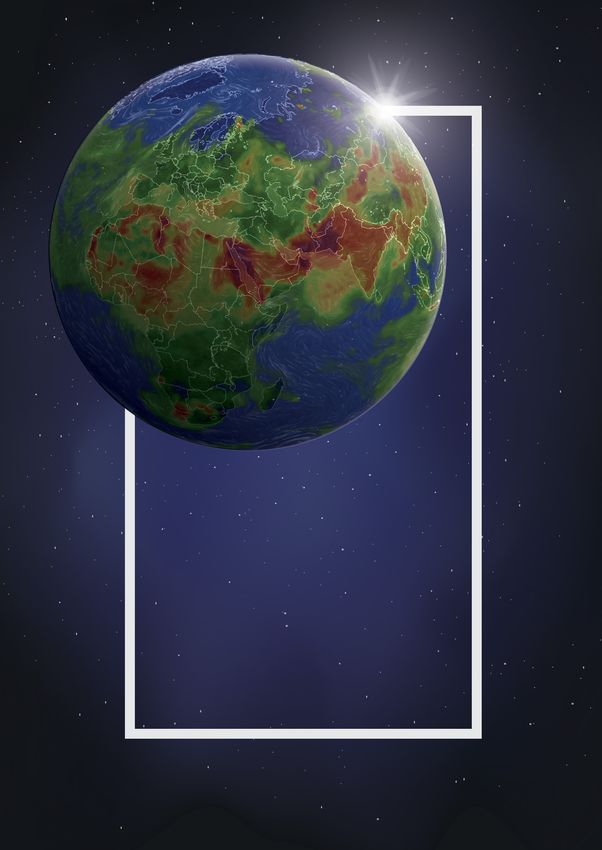
Global map of estimated PM2.5 exposure by country/region in 2018
This global map provides an overview of the average, estimated PM2.5 exposure by country/region in 2018. The
estimation is calculated from available city data as a regional sample and then weighted by population. Countries
and regions that remain grey had no or limited PM2.5 data available for 2018.
World country/region ranking
Sorted by estimated average PM2.5 concentration (µg/m³)
1 Bangladesh 97.1 26 Chile 24.9 51 Puerto Rico 13.7
2 Pakistan 74.3 27 South Korea 24.0 52 Belgium 13.5
3 India 72.5 28 Serbia 23.9 53 France 13.2
4 Afghanistan 61.8 29 Poland 22.3 54 Germany 13.1
5 Bahrain 59.8 30 Croatia 22.2 55 Japan 12.0
6 Mongolia 58.5 31 Turkey 21.9 56 Netherlands 11.7
7 Kuwait 56.0 32 Macau 21.2 57 Switzerland 11.6
8 Nepal 54.2 33 Mexico 20.3 58 Russia 11.4
9 United Arab Emirates 49.9 34 Czech Republic 20.2 59 Luxembourg 11.2
10 Nigeria 44.8 35 Hong Kong 20.2 60 Malta 11.0
11 Indonesia 42.0 36 Cambodia 20.1 61 United Kingdom 10.8
12 China Mainland 41.2 37 Romania 18.6 62 Spain 10.4
13 Bosnia & Herzegovina 40.9 38 Israel 18.6 63 Portugal 10.3
14 Uganda 40.8 39 Taiwan 18.5 64 Ireland 9.5
15 Macedonia 35.5 40 Slovakia 18.2 65 USA 9.1
16 Uzbekistan 34.3 41 Cyprus 17.6 66 Canada 7.9
17 Vietnam 32.9 42 Lithuania 17.5 67 New Zealand 7.7
18 Sri Lanka 32.0 43 Hungary 16.8 68 Norway 7.6
19 Kosovo 30.4 44 Brazil 16.3 69 Sweden 7.4
20 Kazakhstan 29.8 45 Austria 15.0 70 Estonia 7.2
21 Peru 28.0 46 Italy 14.9 71 Australia 6.8
22 Ethiopia 27.1 47 Singapore 14.8 72 Finland 6.6
23 Thailand 26.4 48 Philippines 14.6 73 Iceland 5.0
24 Bulgaria 25.8 49 Ukraine 14.0
25 Iran 25.0 50 Colombia 13.9
7 |World regional capital city ranking
Sorted by average yearly PM2.5 concentration (µg/m³)
[Continued]
1. Delhi, India (113.5) 32. Tel Aviv-Yafo, Israel (19.5)
2. Dhaka, Bangladesh (97.1) 33. Vilnius, Lithuania (18.2)
3. Kabul, Afghanistan (61.8) 34. Cyprus, Nicosia (17.4)
4. Manama, Bahrain (59.8) 35. Prague, Czech Republic (17.4)
5. Ulaanbaatar, Mongolia (58.5) 36. Bratislava, Slovakia (17.2)
6. Kuwait City, Kuwait (56.0) 37. Budapest, Hungary (16.5)
7. Kathmandu, Nepal (54.4) 38. Paris, France (15.6)
8. Beijing, China Mainland (50.9) 39. Vienna, Austria (15.2)
9. Abu Dhabi, UAE (48.8) 40. Taipei, Taiwan (14.9)
10. Jakarta, Indonesia (45.3) 41. Singapore, Singapore (14.8)
11. Kampala, Uganda (40.8) 42. Manila, Philippines (14.3)
12. Hanoi, Vietnam (40.8) 43. Brussels, Belgium (14.1)
13. Islamabad, Pakistan (38.6) 44. Bogota, Colombia (13.9)
14. Sarajevo, Bosnia & Herzegovina (38.4) 45. Kyiv, Ukraine (13.8)
15. Tashkent, Uzbekistan (34.3) 46. Tokyo, Japan (13.1)
16. Skopje, Macedonia (34.0) 47. Bern, Switzerland (12.8)
17. Colombo, Sri Lanka (32.0) 48. London, UK (12.0)
18. Pristina, Kosovo (30.4) 49. Berlin, Germany (11.7)
19. Astana, Kazakhstan (29.8) 50. Lisbon, Portugal (11.7)
20. Santiago, Chile (29.4) 51. Amsterdam, Netherlands (11.5)
21. Sofia, Bulgaria (28.2) 52. Luxembourg City, Luxembourg (11.2)
22. Lima, Peru (28.0) 53. Moscow, Russia (10.1)
23. Tehran, Iran (26.1) 54. Madrid, Spain (10.0)
24. Bangkok, Thailand (25.2) 55. Dublin, Ireland (9.5)
25. Warsaw, Poland (24.2) 56. Washington DC, USA (9.2)
26. Belgrade, Serbia (23.9) 57. Oslo, Norway (8.2)
27. Seoul, South Korea (23.3) 58. Helsinki, Finland (7.2)
28. Bucharest, Romania (20.3) 59. Tallinn, Estonia (7.1)
29. Phnom Penh, Cambodia (20.1) 60. Stockholm, Sweden (6.6)
30. Mexico City, Mexico (19.7) 61. Ottawa, Canada (6.0)
31. Ankara, Turkey (19.6) 62. Wellington, New Zealand (6.0)
0 10 20 30 40 50 60 70 80 90 100 110 0 10 20 30 40 50 60 70
WHO PM2.5 Target WHO PM2.5 Target
This capital city ranking compares annual mean PM2.5 values from the available regional capitals in this report’s
dataset. Countries from Asia and the Middle East occupy most of the top of this regional capital city ranking, with
Delhi and Dhaka’s values both 50% higher than the 3rd ranking capital, Kabul.
Only 9 out of 62 regional capitals included here have an annual mean PM2.5 level within the WHO air quality
guideline of 10µg/m³.
8 |Overview of public monitoring status
Air quality monitoring varies greatly among countries and regions. With regard to continuous monitoring stations
published in real-time, China Mainland, Japan and the United States have the world’s most extensive networks.
The map below shows the global distribution of PM2.5 air quality monitors which met the availability criteria for
this report.
Global distribution of PM2.5 air quality monitoring stations included in this report.
Blue dots indicate government stations. Red dots indicate data from independently operated air monitors.
As this map indicates, many populated areas still lack publicly available real-time or near real-time air quality
information.
Densely populated areas within developed countries tend to have access to a larger network of governmental air
monitors, whilst in many developing countries, access to air quality information is limited.
In countries and regions which lack governmental, real-time monitoring networks, lower cost monitoring sensors
which can be set up quickly and with fewer resources provide an opportunity to accelerate access to air quality
information. Data collected and published from validated IQAir AirVisual monitoring stations operated by private
individuals and organizations is also included in this report. It provides the only real-time public readings for
Pakistan, Afghanistan, Nigeria and Cambodia.
9 |EAST ASIA
China Mainland | Hong Kong | Japan | Macau | Mongolia | South Korea | Taiwan
PM2.5 Country/Region Ranking
(µg/m³)
1. Mongolia (58.5)
250.4
2. China Mainland (41.2)
3. South Korea (24.0)
150.4
4. Macau (21.2)
55.4
5. Hong Kong (20.2)
35.4
6. Taiwan (18.5)
12.0
10.0 7. Japan (12.0)
0 10 20 30 40 50 60 70 80 90 100
Available cities with real time monitoring in 2018 PM2.5 annual mean (µg/m³)
SUMMARY
10.9%
Regional cities which met the
In recent times, East Asia has demonstrated a strong correlation
between rapid economic development and increased air
pollution. However, as the urgency of reducing air pollution
WHO PM2.5 target in 2018 has become apparent in countries such as China Mainland,
extensive monitoring networks and air pollution reduction policies
have been put into place. In mainland China, in particular, this
has led to significant improvements in year-on-year reductions
7.0 116.0 in PM2.5 levels1. Whilst good progress is being made to
improve regional air quality, significant challenges remain, as
Otofuke, Japan Hotan, China Mainland
indicated by the 89% of cities here which exceeded the WHO
guideline during 2018.
WHO target Good Moderate Unhealthy for Sensitive Groups Unhealthy Very Unhealthy Hazardous
Coal burning remains a significant contributor to regional air
Range of annual mean PM2.5 (µg/m³) across regional cities pollution, with high levels of coal production and consumption
in China Mainland and Mongolia in particular2. Transboundary
pollution is also a concern for neighbouring areas such as
Hong Kong, Taiwan and South Korea, including both emissions
Most Polluted Regional Cities Cleanest Regional Cities from human activity as well as seasonal dust storms which
Rank City 2018 AVG Rank City 2018 AVG can affect much of the region3.
1 Hotan, China Mainland 116.0 1 Otofuke, Japan 7.0
2 Kashgar, China Mainland 95.7 2 Sapporo, Japan 7.3 MONITORING STATUS
3 Xingtai, China Mainland 76.7 3 Ebina, Japan 7.5
All countries within the East Asia region, excluding North Korea,
4 Shijiazhuang, China Mainland 76.7 4 Hakuba, Japan 7.6 support public real-time air quality monitoring. As a collective,
5 Aksu, China Mainland 74.1 5 Uchinada, Japan 7.7 the prevalence and quality of public PM2.5 data is among the
best in the world.
6 Handan, China Mainland 74.0 6 Nyingchi, China Mainland 7.8
7 Anyang, China Mainland 72.9 7 Wajima, Japan 7.8 China Mainland has the world’s most numerous and far reaching
monitoring network, with around 1,500 monitors managed by
8 Baoding, China Mainland 70.7 8 Suzu, Japan 7.9 the central government and a total of over 5,000 monitors man-
9 Linfen, China Mainland 68.2 9 Minamiashigara, Japan 8.0 aged at a central, provincial, municipal and county level4.
10 Wujiaqu, China Mainland 67.8 10 Miyakojima, Japan 8.1 Mongolia currently has the most limited monitoring network of
11 Xianyang, China Mainland 67.8 11 Toyama, Japan 8.1 the region by land area, with only a handful of public stations
in Ulaanbaatar, where almost half of the country’s population
12 Jiaozuo, China Mainland 66.9 12 Minami, Yamanashi Japan 8.3 resides.
13 Hengshui, China Mainland 65.7 13 Sakata, Japan 8.3
1 http://www.greenpeace.org/eastasia/press/releases/climate-energy/2018/PM25-
14 Xuzhou, China Mainland 65.5 14 Gojo, Japan 8.3
in-Beijing-down-54-nationwide-air-quality-improvements-slow-as-coal-use-increases/
Cangzhou, China Mainland 2 https://www.worldenergy.org/data/resources/region/east-asia/coal/
15 65.2 15 Kanazawa, Japan 8.4
3 https://taqm.epa.gov.tw/taqm/en/b0301.aspx
4 http://www.gov.cn/xinwen/2018-01/31/content_5262775.htm
10 |SOUTHEAST ASIA
Cambodia | Indonesia | Philippines | Singapore | Thailand | Vietnam
PM2.5 Country/Region Ranking
(µg/m³)
1. Indonesia (42.0)
250.4
2. Vietnam (32.9)
3. Thailand (26.4)
150.4
55.4 4. Cambodia (20.1)
35.4
5. Singapore (14.8)
12.0
10.0 6. Philippines (14.6)
0 10 20 30 40 50 60 70 80 90 100
Available cities with real time monitoring in 2018 PM2.5 annual mean (µg/m³)
SUMMARY
4.5%
Regional cities which met the
Sources of air pollution in Southeast Asia vary between rural
and urban areas in its various countries, with the burning of
biomass, vehicular emissions and transportation as common
WHO PM2.5 target in 2018 leading sources. High regional pollution spikes are often related
to the seasonal agricultural practice of open burning, where
land is burned in order to provide a more nutrient rich envi-
ronment for future crops, particularly within Indonesia1. These
9.3 45.3 emissions often contribute to the spread of transboundary air
Calamba, Philippines Jakarta, Indonesia pollution across the neighboring countries2.
In urban areas, transportation and industry are among the
WHO target Good Moderate Unhealthy for Sensitive Groups Unhealthy Very Unhealthy Hazardous
leading contributors, with high numbers of small vehicles such
Range of annual mean PM2.5 (µg/m³) across regional cities as motorbikes. There is strong correlation between urbanization
and air pollution in this region: Jakarta and Hanoi have the
highest recorded air pollution in the region, and are also
among the most populated cities.
Most Polluted Regional Cities Cleanest Regional Cities
MONITORING STATUS
Rank City 2018 AVG Rank City 2018 AVG
1 Jakarta, Indonesia 45.3 1 Calamba, Philippines 9.3
2 Hanoi, Vietnam 40.8 2 Valenzuela, Philippines 9.9
Samut Sakhon, Thailand Government supported public PM2.5 monitoring is relatively
3 39.8 3 Carmona, Philippines 10.9
sparse in Southeast Asia. Collectively, only 145 monitors
Nakhon Ratchasima,
4
Thailand
37.6 4 Satun, Thailand 11.3 reporting real-time data across the region are included in this
Tha bo, Thailand
report. In response to limited real-time information, many local
5 37.2 5 Paranaque, Philippines 12.2
organizations and concerned citizens have deployed their
6 Saraburi, Thailand 32.6 6 Davao City, Philippines 12.6 own lower cost air quality monitoring devices. As a result of
7 Meycauyan City, Philippines 32.4 7 Makati, Philippines 13.7 these contributions, non-governmental measurements make
up approximately half of the region’s coverage here, notably
8 Samut Prakan, Thailand 32.2 8 Manila, Philippines 14.3 within the Philippines, Thailand, and Indonesia. Non-govern-
9 Ratchaburi, Thailand 32.2 9 Mandaluyong, Philippines 14.5 mental monitors also provide the only real-time data available
in Cambodia.
10 Mae Sot, Thailand 32.2 10 Singapore, Singapore 14.8
11 Caloocan, Philippines 31.4 11 Narathiwat, Thailand 15.2 Whilst Malaysia has run public monitoring networks measuring
other pollutants previously, the local government has also
12 Si Maha Phot, Thailand 30.9 12 Balanga, Philippines 16.1
introduced public PM2.5 monitoring during 2018.
13 Pai, Thailand 29.4 13 Quezon City, Philippines 17.5
14 Chon Buri, Thailand 27.3 14 Nan, Thailand 17.6
1 https://www.unenvironment.org/resources/report/south-east-asia-air-quality-
regional-report
15 Ho Chi Minh City, Vietnam 26.9 15 Las Pinas, Philippines 17.9
2 http://www.ccacoalition.org/en/resources/air-pollution-asia-and-pacific-sci-
ence-based-solutions
11 |SOUTH ASIA
Afghanistan | Bangladesh | India | Iran | Nepal | Pakistan | Sri Lanka
PM2.5 Country/Region Ranking
(µg/m³)
1. Bangladesh (97.1)
250.4
2. Pakistan (74.3)
3. India (72.5)
150.4
4. Afghanistan (61.8)
55.4
5. Nepal (54.2)
35.4
6. Sri Lanka (32.0)
12.0
10.0 7. Iran (25.0)
0 10 20 30 40 50 60 70 80 90 100
Available cities with real time monitoring in 2018 PM2.5 annual mean (µg/m³)
SUMMARY
1.2%
Regional cities which met the
Of the countries and regions with available data for this report
during 2018, four of the five most polluted in the world were
located in South Asia. Of the 84 cities monitored in this area,
WHO PM2.5 target in 2018 99% failed to meet the WHO annual guideline for PM2.5. As a
whole, cities here average a PM2.5 concentration of 60 µg/m³,
6 times the recommended limit of 10 µg/m³.
7.8 135.8 Sources of PM2.5 pollution in this region vary by region and
Qorveh, Iran Gurugram, India city, but common contributors include vehicle exhaust, open
crop and biomass burning, industrial emissions and coal
combustion1.
WHO target Good Moderate Unhealthy for Sensitive Groups Unhealthy Very Unhealthy Hazardous
Range of annual mean PM2.5 (µg/m³) across regional cities Of the cities included in South Asia, it is interesting to note
that, although Delhi typically receives most media coverage
as one of the world’s “pollution capitals”, the Indian capital
“only” ranks 10th for annual PM2.5 concentration. Other cities
Most Polluted Regional Cities Cleanest Regional Cities
across Northern India and Pakistan have a higher recorded
Rank City 2018 AVG Rank City 2018 AVG annual PM2.5 level, with nearby Gurugram narrowly resulting
1 Gurugram, India 135.8 1 Qorveh, Iran 7.8 in the highest annual concentration of any global city recorded
here during 2018.
2 Ghaziabad, India 135.2 2 Tabriz, Iran 12.2
Faisalabad, Pakistan 130.4 Sanandaj, Iran 12.5
MONITORING STATUS
3 3
4 Faridabad, India 129.1 4 Nahavand, Iran 16.1
5 Bhiwadi, India 125.4 5 Zanjan, Iran 18.6
Real-time air quality data coverage is most numerous within
Noida, India Meybod, Iran 21.1
6 123.6 6
India and Iran, and the highest number of public monitors in
7 Patna, India 119.7 7 Abdanan, Iran 21.2 any city here is in Delhi. The majority of South Asia, meanwhile,
including Afghanistan, Bangladesh, Pakistan and Sri Lanka,
8 Lucknow, India 115.7 8 Hashtgerd, Iran 22.1 lack government supported real-time public stations. All mea-
9 Lahore, Pakistan 114.9 9 Karaj, Iran 22.2 surements representing these countries and regions are from
U.S. State department monitors and citizen-led monitoring
Delhi, India 113.5 Sejzi, Iran 22.3
10 10
networks, the most extensive of which is in Pakistan2, covering
11 Jodhpur, India 113.4 11 Isfahan, Iran 23.8 17 locations in 2018.
12 Muzaffarpur, India 110.3 12 Mobarakeh, Iran 24.1
13 Varanasi, India 105.3 13 Kerman, Iran 24.4
Moradabad, India 104.9 1 https://www.researchgate.net/publication/311901640_Fine_particu-
14 14 Tehran, Iran 26.1
lates_over_South_Asia_Review_and_meta-analysis_of_PM25_source_apportion-
104.8 ment_through_receptor_model
15 Agra, India 15 Esfahan, Iran 27.6
2 https://www.airvisual.com/blog/revealing-the-invisible-airvisual-communi-
ty-activism-ignites-action-to-fight-smog-in-pakistan
12 |MIDDLE EAST
Bahrain | Cyprus | Israel | Kuwait | Turkey | United Arab Emirates
PM2.5 Country/Region Ranking *
(µg/m³)
250.4 1. Bahrain (59.8)
2. Kuwait (56.0)
150.4 3. United Arab Emirates (49.9)
55.4 4. Turkey (21.9)
35.4 5. Israel (18.6)
12.0 6. Cyprus (17.6)
10.0
0 10 20 30 40 50 60 70 80 90 100
Available cities with real time monitoring in 2018 PM2.5 annual mean (µg/m³)
SUMMARY
0%
Regional cities which met the
The primary contributor to air pollution in the Middle East is
natural, from windblown dust storms. However, human activity
WHO PM2.5 target in 2018 * also significantly contributes to local air pollution, including
industrial emissions from oil refineries, fossil fueled power
plants, combustion-based transportation and high usage of
private vehicles, and open waste burning1.
12.4 59.8 The Middle East region includes some of the cities and countries
Nesher, Israel Manama, Bahrain
with the highest PM2.5 levels from this 2018 dataset, with
Manama, Kuwait City and Dubai all exceeding the WHO
WHO target Good Moderate Unhealthy for Sensitive Groups Unhealthy Very Unhealthy Hazardous annual guideline by more than 5 times.
Range of annual mean PM2.5 (µg/m³) across regional cities
Most Polluted Regional Cities * Cleanest Regional Cities * MONITORING STATUS
Rank City 2018 AVG Rank City 2018 AVG
1 Manama, Bahrain 59.8 1 Nesher, Israel 12.4 Current levels of governmental air monitoring in this region
2 Kuwait City, Kuwait 56.0 2 Ayia Marina, Cyprus 12.9 are low. Cyprus, Israel and Turkey are the only countries with
domestic governmental monitors contributing real-time air
3 Dubai, UAE 55.3 3 Arnavutköy, Turkey 13.8
quality readings. Israel and Turkey have the highest number
4 Abu Dhabi, UAE 48.8 4 Giresun, Turkey 14.0 of monitoring stations included in this region.
5 Kazimkarabekir, Turkey 42.7 5 Zygi, Cyprus 14.3
The remaining countries (Bahrain, Kuwait, United Arab Emirates)
6 Kesan, Turkey 38.3 6 Edirne, Turkey 15.0 have their real-time air quality data reported here through con-
tributions from the US State Department’s overseas air moni-
7 Sharjah, UAE 37.6 7 Be’er Sheva, Israel 16.1
toring program, along with IQAir AirVisual monitoring stations
8 Amasya, Turkey 34.0 8 Artvin, Turkey 16.4 operated by individuals and NGOs.
9 Barkai, Israel 30.7 9 Sde Yoav, Israel 16.6
10 Pinarhisar, Turkey 30.0 10 Haifa, Israel 16.7
11 Erzincan, Turkey 28.9 11 Acre, Israel 17.2
12 Ein Tamar, Israel 28.4 12 Nicosia, Cyprus 17.4
13 Bursa, Turkey 28.4 13 Şarkikaraağaç, Turkey 17.4
14 Pardes Hanna-Karkur, Israel 26.8 14 Nir Yisrael, Israel 17.5
15 Corum, Turkey 24.8 15 Gvar’am, Israel 17.6
1 https://wedocs.unep.org/bitstream/handle/20.500.11822/20255/NorthAf-
ricaMiddleEast_report.pdf
* Based on available data.
13 |EUROPE
Austria | Belgium | Bosnia and Herzegovina | Bulgaria | Croatia | Czech Republic | Estonia | Finland | France | Germany
Hungary | Iceland | Ireland | Italy | Kosovo | Lithuania | Luxembourg | Macedonia | Malta | Netherlands | Norway
Poland | Portugal | Romania | Russia | Serbia | Slovakia | Spain | Sweden | Switzerland | Ukraine | United Kingdom
PM2.5 Country/Region Ranking
(µg/m³)
1. Bosnia & Herzegovina (40.9)
2. Macedonia (35.5)
3. Kosovo (30.4)
250.4 4. Bulgaria (25.8)
5. Serbia (23.9)
6. Poland (22.3)
7. Croatia (22.2)
8. Czech Republic (20.2)
9. Romania (18.6)
10. Slovakia (18.2)
11. Lithuania (17.5)
12. Hungary (16.8)
13. Austria (15.0)
150.4 14. Italy (14.9)
15. Ukraine (14.0)
16. Belgium (13.5)
17. France (13.2)
18. Germany (13.1)
55.4 19. Netherlands (11.7)
20. Switzerland (11.6)
21. Russia (11.4)
22. Luxembourg (11.2)
23. Malta (11.0)
35.4 24. United Kingdom (10.8)
25. Spain (10.4)
26. Portugal (10.3)
27. Ireland (9.5)
28. Norway (7.6)
12.0 29. Sweden (7.4)
10.0 30. Estonia (7.2)
31. Finland (6.6)
32. Iceland (5.0)
0 10 20 30 40 50 60 70 80 90 100
Available cities with real time monitoring in 2018 PM2.5 annual mean (µg/m³)
SUMMARY
27.3%
Regional cities which met the
Within Europe, Eastern and Southern European locations reported the
highest air pollution levels during 2018. Bosnia and Herzegovina as
well as Macedonia have the highest reported annual levels of PM2.5,
whilst Poland, the Czech Republic, Romania and Bulgaria, joined by
WHO PM2.5 target in 2018 Italy and Kosovo are home of the rest of the 30 most polluted cities.
There is considerable variation between European countries’ and cit-
ies’ main sources of particulate matter. Transportation, agricultural
3.0 55.6 emissions which travel distances to impact cities, and industrial emis-
Bredkalen, Sweden Lukavac, Bosnia & Herzegovina sions are all common contributors across different areas. Residential
heating is an important factor in Eastern European countries as well
as parts of Italy1 and the UK2. Poland’s relatively high pollution level
WHO target Good Moderate Unhealthy for Sensitive Groups Unhealthy Very Unhealthy Hazardous in particular, may be partly attributed to its high consumption of coal
Range of annual mean PM2.5 (µg/m³) across regional cities and wood, commonly burned for household energy and in industry.
Transboundary air pollution is a concern for this closely grouped set
of countries. Transnational policy such as the United Nations Eco-
Most Polluted Regional Cities Cleanest Regional Cities nomic Commission for Europe’s (UNECE) Gothenburg protocol is one
example of policy measures to manage transboundary emissions.
Rank City 2018 AVG Rank City 2018 AVG
MONITORING STATUS
1 Lukavac, Bosnia & 55.6 1 Bredkalen, Sweden 3.0
Herzegovina
2 Zivinice, Bosnia & 54.0 2 Husavik, Iceland 3.1
Herzegovina
3 Tetovo, Macedonia 44.6 3 Santana, Portugal 3.4 Whilst most countries within the EU have a fairly robust system of
public air monitoring and reporting in place, not all monitoring sta-
4 Tuzla, Bosnia & Herzegovina 43.1 4 Grundartangi, Iceland 3.7
tions measure PM2.5 pollution and some areas do not report their
5 Jaworzno, Poland 38.9 5 Kuopio, Finland 3.9 data in real-time. Italy is one example where data is published a day
Sarajevo, Bosnia & later, thus calling into question its usefulness when it comes to guid-
6 38.4 6 Salao, Portugal 4.3
Herzegovina ing people’s decisions to implement personal protection measures or
7 Kumanovo, Macedonia 37.2 7 Vaasa, Finland 4.3 prevent activities that contribute to air pollution.
Bitola, Macedonia 36.3 Hafnarfjoerdur, Iceland 4.3
8 8 Some other European countries outside the EU have modest public
9 Dolni Lutyne, Czech Republic 35.8 9 Alacant, Spain 4.4 governmental monitoring networks. Russia only had public PM2.5
monitoring available within Moscow for this report, while citizens
10 Skopje, Macedonia 34.0 10 Saint-Pierre, France 4.6
have contributed additional IQAir AirVisual monitor networks in other
11 Sassuolo, Italy 31.2 11 Narvik, Norway 4.6 parts of Russia, notably in Krasnoyarsk region, as well as in Ukraine.
Albalat dels Tarongers, Kosovo’s readings are supplied by the US State Department and these
12 Pristina, Kosovo 30.4 12 4.7
Spain privately operated monitors.
13 Katowice, Poland 30.4 13 Umeå, Sweden 4.9
14 Torbole Casaglia, Italy 30.3 14 Norr Malma, Sweden 5.0 1 https://ec.europa.eu/jrc/en/news/air-quality-atlas-europe-mapping-sourc-
es-fine-particulate-matter
La Granja de San 5.0 2 https://www.gov.uk/government/publications/clean-air-strategy-2019/
15 Otwock, Poland 30.2 15
IIdefonso, Spain clean-air-strategy-2019-executive-summary#chapter-6-action-to-reduce-emis-
sions-at-homeShow
14 |NORTHERN AMERICA
United States | Canada
PM2.5 Country/Region Ranking
(µg/m³)
250.4
1. United States (9.0)
150.4
55.4
2. Canada (7.9)
35.4
12.0
10.0
0 10 20 30 40 50 60 70 80 90 100
Available cities with real time monitoring in 2018 PM2.5 annual mean (µg/m³)
SUMMARY
81.7%
Regional cities which met the
Northern America is one of the regions with lowest PM2.5
levels represented in this report, although 18% of cities still
exceeded the WHO annual target in 2018. The region includes
WHO PM2.5 target in 2018 one of the world’s pioneering air quality monitoring systems
within the USA.
Notable sources of air pollution in Northern America include
3.0 27.8 transport emissions, demand for energy production through
Oak Harbor, Anderson, fossil fuels, household energy consumption, and wildfires
USA USA as a prominent natural cause. 2018 saw a series of severe
wildfires particularly in the California and Oregon areas during
WHO target Good Moderate Unhealthy for Sensitive Groups Unhealthy Very Unhealthy Hazardous
August and November, as well as in Canada’s British Columbia
Range of annual mean PM2.5 (µg/m³) across regional cities with the fumes spreading heavily over nearby Alberta during
August1. These events constituted some of the most severe
wildfires in recent years in both areas, temporarily raising
pollution levels far above typical local ranges.
Most Polluted Regional Cities Cleanest Regional Cities
Rank City 2018 AVG Rank City 2018 AVG 16 out of the 20 most polluted cities in Northern America
1 Anderson, USA 27.8 1 Oak Harbor, USA 3.0
were in California. All of the top 40 most polluted cities in
the region are in the Pacific West, where wildfires severely
2 Medford, USA 22.0 2 Wellington, Canada 3.4 impacted typical monthly averages. Los Angeles, known for
3 Three Rivers, USA 20.8 3 Kapolei, USA 3.5 its historic struggles with air pollution and traffic congestion,
ranks 31st in the region. PM2.5 adds to the well documented
4 Yosemite Valley, USA 20.4 4 Perry, USA 3.6
ozone haze2.
5 Portola, USA 20.4 5 Wilmington, NY, USA 3.7
6 Klamath Falls, USA 18.9 6 Santa Fe, USA 3.7
MONITORING STATUS
7 Yuba City, USA 18.2 7 Kahului, USA 3.7
8 Paradise, USA 17.9 8 Reubens, USA 3.8 The United States has one of the world’s most numerous air
monitoring networks with 914 PM2.5 stations nationwide
9 Stockton, USA 17.7 9 Moncton, Canada 3.8 included in this report. In addition, the US State Department’s
10 Chico, USA 17.6 10 Mount Vernon, USA 3.8 overseas air monitoring program brings valuable air quality
readings to numerous cities and countries otherwise lacking
11 Visalia, USA 17.6 11 Southampton, Canada 3.8
this information.
12 Turlock, USA 17.3 12 Honolulu, USA 3.9
13 Gridley, USA 16.9 13 Peterborough, USA 4.1
14 Porterville, USA 16.8 14 Hot Springs, USA 4.1
15 Twisp, USA 16.6 15 Bar Harbor, USA 4.1
1 https://www.bbc.com/news/world-us-canada-45250919
2 https://doi.org/10.1002/jgrd.50472
15 |LATIN AMERICA & CARIBBEAN
Brazil | Chile | Colombia | Mexico | Peru | Puerto Rico
PM2.5 Country/Region Ranking
(µg/m³)
250.4 1. Peru (28.0)
2. Chile (24.9)
150.4 3. Mexico (20.3)
55.4 4. Brazil (16.3)
35.4 5. Colombia (13.9)
12.0 6. Puerto Rico (13.7)
10.0
0 10 20 30 40 50 60 70 80 90 100
Available cities with real time monitoring in 2018 PM2.5 annual mean (µg/m³)
SUMMARY
4.8%
Regional cities which met the
Chile has the highest recorded PM2.5 pollution levels in this
region, providing the top 5 most polluted cities here. Major
regional emission sources contributing to air pollution in all
WHO PM2.5 target in 2018 countries include agriculture, transportation with inefficient
vehicle and fuel standards, as well as biomass fuel burning for
household and commercial heating and cooking.
4.5 43.3 Chile in particular suffers from high levels of particulate pol-
Punta Arenas, Chile Padre las Casas, Chile lution as a result of wood burning for heating1, which govern-
ment policies are aiming to tackle by promoting access to
cleaner heating technologies.
WHO target Good Moderate Unhealthy for Sensitive Groups Unhealthy Very Unhealthy Hazardous
Range of annual mean PM2.5 (µg/m³) across regional cities
MONITORING STATUS
Most Polluted Regional Cities Cleanest Regional Cities Real-time air monitoring coverage in this region remains
Rank City 2018 AVG Rank City 2018 AVG moderately low, with Chile and Mexico supplying the largest
number of measurement points. Brazil’s real-time PM2.5 data
1 Padre las Casas, Chile 43.3 1 Punta Arenas, Chile 4.5
is limited to a network of stations located within Sao Paulo
2 Osorno, Chile 38.2 2 Guanajuato, Mexico 9.0 state, whilst the US State Department program provides air
Coyhaique, Chile Antofagasta, Chile
quality readings for Colombia and Puerto Rico.
3 34.2 3 9.1
4 Valdivia, Chile 33.3 4 Alto Hospicio, Chile 10.5
5 Temuco, Chile 30.4 5 Ribeirao Preto, Brazil 11.3
6 Mexicali, Mexico 30.2 6 Taubate, Brazil 11.4
7 Santiago, Chile 29.4 7 Huasco, Chile 11.5
8 Lima, Peru 28.0 8 Vina del Mar, Chile 11.9
9 Toluca, Mexico 26.4 9 Arica, Chile 12.5
10 Linares, Chile 25.5 10 Catano, Puerto Rico 12.8
11 Ecatepec de Morelos, 24.9 11 Coquimbo, Chile 12.8
Mexico
Tlalnepantla de Baz, 23.7 Abasolo, Mexico
12
Mexico
12 13.0
13 Rancagua, Chile 22.9 13 Pachuca de Soto, Mexico 13.3
14 Nezahualcóyotl, Mexico 22.8 14 Valparaiso, Chile 13.4
15 Puerto Montt, Chile 22.6 15 Piracicaba, Brazil 13.6
1 https://www.unenvironment.org/news-and-stories/story/chile-takes-action-
air-pollution
16 |AFRICA
Ethiopia | Nigeria | Uganda
PM2.5 Country/Region Ranking *
(µg/m³)
250.4
1. Nigeria (44.8)
150.4
2. Uganda (40.8)
55.4
3. Ethiopia (27.1)
35.4
12.0
10.0
0 10 20 30 40 50 60 70 80 90 100
Available cities with real time monitoring in 2018 PM2.5 annual mean (µg/m³)
SUMMARY
0%
Regional cities which met the
The African continent has the most notable lack of accessible
air quality monitoring data, whilst facing numerous challeng-
es related to regional air quality. Africa has one of the fastest
WHO PM2.5 target in 2018 * rates of urbanization of any region, with increasing numbers
of the population moving to large cities, where air pollution
levels tend to be higher. Significant pollution emission sources
include fuels such as coal, wood and kerosene for cooking,
27.1 53.4 made more challenging to tackle in rural areas due to limited
Addis Ababa, Ethiopia Kano, Nigeria infrastructure or accessibility of alternative energy sources.
Waste and agricultural burning and inefficient transportation
also contribute to high PM2.5 levels1.
WHO target Good Moderate Unhealthy for Sensitive Groups Unhealthy Very Unhealthy Hazardous
Range of annual mean PM2.5 (µg/m³) across regional cities
MONITORING STATUS
Most Polluted Regional Cities * Cleanest Regional Cities *
Rank City 2018 AVG Rank City 2018 AVG
Apart from South Africa where there is a deployment of a
substantial network of air quality monitors2, overall, Africa
1 Kano, Nigeria 53.4 1 Addis Ababa, Ethiopia 27.1
suffers from a serious lack of air quality monitoring data,
2 Kampala, Uganda 40.8 2 Port Harcourt, Nigeria 32.7 leaving more than a billion people without adequate air pol-
lution exposure information. Available real-time data included
3 Port Harcourt, Nigeria 32.7 3 Kampala, Uganda 40.8
in this report is supplied by US State department monitors in
4 Addis Ababa, Ethiopia 27.1 4 Kano, Nigeria 53.4 addition to privately operated IQAir AirVisual monitors. This
5 5
lack of data results in low regional levels of awareness about
air pollution, limiting people’s capacity to protect their health.
6 6
7 7
8 8
9 9
10 10
11 11
12 12
13 13
14 14
1 https://www.unenvironment.org/news-and-stories/story/air-pollution-af-
ricas-invisible-silent-killer-1
15 15
2 The aggregated real-time data from the South African monitoring network is
not included here since it did not meet the availability criteria for this report.
* Based on availability of real-time monitoring stations. In Africa (2018), this was limited to 4 cities.
17 |Next Steps
As this report illustrates, while some regions have made considerable progress in providing real-time air quality
monitoring data, many cities and regions remain underrepresented. The scale of the health hazard now posed by
global air pollution stresses the urgent need for more access to timely air quality data that allows citizens and
communities to take informed decisions and actions to protect their health.
In addition to increasing the number of high-cost governmental reference
stations, generating more public data through low-cost sensors is one solution
Making real-time for cities and communities to accelerate access to localized air quality
information.
air quality data
accessible is one Making air quality data accessible is one of the most effective ways to
improve air quality. Public readings generate public awareness, which drives
of the most demand for action. The advances made in air pollution control and reduction
effective ways to since China’s implementation of national air quality monitoring, is just one
example of how access to real-time air quality information can positively
catalyze change. impact a country’s approach to air quality policy and management. Today,
China has one of the most comprehensive air quality monitoring programs
and is leading the way in improving air quality in its major cities.
What can I do?
Reducing personal exposure to air pollution can be achieved through simple
actions. These can include reducing outdoor activities when pollution levels Reducing personal
are high, protecting indoor spaces by closing windows during outdoor air
exposure to air
pollution episodes, and where possible, implementing indoor air purification
and/or personal outdoor respiratory protection. pollution can be
The free IQAir AirVisual Air Quality App provides real-time air quality information,
achieved through
air quality forecasts and actionable health recommendations that allow simple actions
individuals and organizations to reduce their exposure to air pollutants.
Personal choices can also have a significant impact on reducing pollution emissions. Choosing clean modes of
transport (cycling, walking, public transport where available), lowering household energy usage and personal
waste output, and supporting local air quality initiatives can all positively impact the air quality in our communities
and on our planet.
Deploying an air quality monitor in your neighbourhood is also one way to accelerate access to real-time
information, and raise awareness of local conditions within your community1.
1 https://www.airvisual.com/air-pollution-information/blog/join-the-movement-for-a-cleaner-planet-become-a-public-air-pollution-data-contributor-today
18 |Methodology
Data sources
The air quality data included in this report is generated from ground-based monitoring stations that report PM2.5
concentrations.
The majority of data presented here has been aggregated in real-time (on an hourly basis) from data made
publicly available by various governmental agencies.
The real-time aggregated data from government sources within Europe has been combined with historical data
records made available by the European Environment Agency (EEA) for 2018, to provide a fuller dataset where
there may have been delays in some areas’ real-time reporting. Historical data has also been added from some
local government sources not available from the EEA at the time of creating this report, including from Turkey,
Hungary and Romania.
Further PM2.5 data is also included from a selection of validated outdoor IQAir AirVisual PM2.5 monitoring stations
operated by private individuals and organizations, many of which provide the only available, real-time air quality
information for their area.
Data calculation
Data is collected from individual monitoring stations and then grouped under a city. For cities with more than
one monitoring station, city data is averaged by calculating the hourly median between stations in the same
city. These hourly median values are then used to calculate both the city’s monthly and annual mean values,
respectively1.
European data records were combined between the available real-time aggregated history from various public
sources, and the EEA historical record on a city-by-city basis. For any city with a data record provided both by
the real-time aggregated history and the EEA historical data, the record which offers primarily the highest level
of data availability over the year, and secondarily the highest number of stations providing measurements, was
selected to represent that city.
The country/region average values (p.7) are the estimation of the population’s average exposure based on data
sampling. This is calculated using the country or region’s available city data as a sample, weighted by population.
The level of air quality data granularity may vary between country and region, therefore it must be noted that this
ranking is based on data sampling, and while imperfect, it is an attempt to provide a broad global overview and
context between countries and regions.
The calculation used to estimate a country/region’s average PM2.5 exposure based on available data and weighted
by population is:
Σ Regional city mean PM2.5 (µg/m³) x City population
Total regional population covered by available city data
1 Given this calculation method, the annual average may not always be equal to an average of the year’s monthly average values, if some months do not
have a complete record of hourly measurements.
19 |Data availability
Data availability was measured in 2 ways:
• “Calendar availability”: a percentage of days of the year (/365) when the location had at least one reading
from at least one station.
• “Daily average availability”: a mean percentage of hours of the day (/24) which have measurements available,
from those days which have at least one reading from at least one station.
The availability criteria for data included in this report is, that a city has >50% calendar availability during 2018.
In addition, from the cities with >50% calendar availability, any city with 95%
8% 14%
90 - 95% 9% 90 - 95%
19%
72% 64%
75 - 90% 75 - 90%
50 - 75% 41 - 75%
Disclaimer
This report summarizes available PM2.5 data from global locations during 2018, based primarily on public air
quality data aggregated by the IQAir AirVisual information platform and supplemented with additional historical
datasets from government sources where available.
The information presented lays no claim on completeness. Data sources for real-time aggregated data are dis-
played on the IQAir AirVisual website.
We invite suggestions and discussion of the information provided.
IQAir is politically independent and any illustrations or content included in this report are not intended to indicate
any political stance. Regional map images have been generated using OpenStreetMap1.
1 https://www.openstreetmap.org/
20 |FAQ
Why is my area (city / country / region) not listed in this ranking?
• The area lacks available data from governmental or privately operated air quality monitoring stations.
• The area has data from air monitoring stations (such as PM10, Ozone, SO2, etc), but does not include
PM2.5 data. This report only includes stations and cities where PM2.5 data is measured.
• The accessible measurements for the city had insufficient availability over the year 2018 to be
representative1.
Why is there a difference between the information in this
report and the information provided by my government?
• There are different ways to calculate a yearly, monthly, daily and hourly PM2.5 average. This report
aggregates city-level data in cities with multiple stations, by calculating the hourly median value
across stations. Some outlier values may affect the average calculated in a different way.
• Governments may have data from more monitoring stations that are either not published or that IQAir
AirVisual did not collect. Alternatively, IQAir AirVisual may be referencing more stations within a city
or country for its average than a government.
• Different governments may use a different Air Quality Index system to represent air quality readings in
a local context. To make direct comparisons, it is important to compare PM2.5 concentration in µg/m³.
Why are some locations available on the AirVisual website, not
included in this report?
• It is possible that newer data sources have recently been added to the IQAir AirVisual reporting
platform, whilst they may not have been aggregated for long enough to meet this report’s availability
criteria to be representative of 2018.
• Some locations may report other pollutants via the AirVisual website, but not PM2.5, which is a
requirement to be included in this report.
• For some locations which lack real-time PM2.5 information, AirVisual provides an estimated PM2.5
value, which is marked with an asterisk (*)2. Only measured PM2.5, not estimations, have been
included in this report.
I would like to view the whole city ranking, where can I find it?
You can browse through the full interactive air quality data set of the world’s most polluted cities presented on
the IQAir AirVisual website, which also provides monthly mean values for each location, so that seasonal trends
may also be seen.
If you have further questions, you can contact IQAir AirVisual directly.
How precise is the ranking?
The rankings are based on real world monitoring data from a variety of sources. All monitoring methods have a
degree of error. The rankings presented here represent annual average concentrations taken from multiple monitoring
sites, and data is checked and validated. However, even after this process the data may have some uncertainty.
Where cities and countries in the ranking have similar PM2.5 concentrations, the ranking may be affected by
measurement error and the ranking position should be considered to be indicative rather than absolute.
1 See Methodology, “Data availability”, p.20.
2 http://support.airvisual.com/knowledgebase/articles/1885072-what-does-the-asterisk-mean-on-some-locations
21 |Acknowledgements This report is made possible through the efforts of numerous governmental agencies, whose work in publishing real-time air quality data is invaluable to empower people to protect their health and take steps to improve air quality. This report is also made possible through the efforts of countless individuals and NGO data contributors who operate their own air quality monitors and make this data publicly available. About IQAir AirVisual IQAir AirVisual is a global air quality information platform operated by the IQAir Group. By aggregating and validating air quality data from governments, private individuals and non-governmental organizations, IQAir Air- Visual aims to provide global and hyper-local air quality information that allows individuals, organizations and governments to take steps that improve air quality in communities, cities and countries all over the world. Report V1.1. Recent updates are reflected in the Changelog.
You can also read