Erasmus+ staff mobility comparative data analysis - Erasmus ...
←
→
Page content transcription
If your browser does not render page correctly, please read the page content below

Erasmus+ staff mobility
comparative data analysis
An exploratory study of the participants’ motivation, perceived impact, recognition and satisfaction

Queenie K.H. Lam, ACA
                                                         January 2021
Irina Ferencz, ACA

                                                                                             0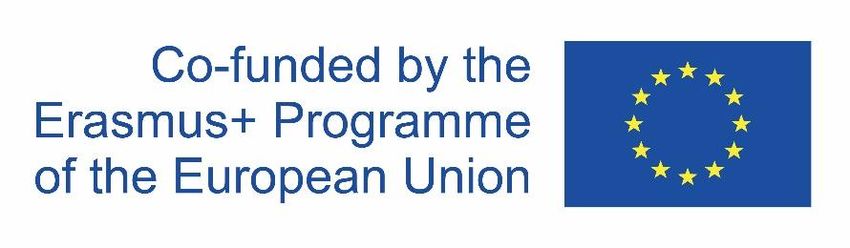
Authors
Queenie K.H. Lam (Academic Cooperation Association – ACA, Belgium)
Irina Ferencz (Academic Cooperation Association – ACA, Belgium)

Data preparation / evaluation
Academic Cooperation Association – ACA
The Agency for Mobility and EU Programmes – AMEUP, Croatia
Centre of the Republic of Slovenia for Mobility and European Educational and Training Programmes –
CMEPIUS, Slovenia
Czech National Agency for International Education and Research – DZS, Czech Republic
The State Scholarships Foundation – IKY, Greece
National Institute for Documentation, Innovation and Educational Research – INDIRE, Italy
Foundation for the Management of European Lifelong Learning Programmes, Cyprus
Austrian Agency for International Cooperation in Education and Research, OeAD, Austria
Tempus Public Foundation – TPF, Hungary
The Icelandic Centre for Research – Rannís, Iceland
Directorate General for Education, Youth, Sport and Culture – DG EAC, European Commission

Special thanks
Veronika Kupriyanova (Academic Cooperation Association - ACA, Belgium)
Aicha Hefiela (Academic Cooperation Association - ACA, Belgium)

Content management
The data providers, authors and the editorial team have compiled the information in this publication with
the utmost care. However, they cannot exclude the possibility that, in exceptional cases, some of the
information was based on erroneous data or may have changed after going to press. Therefore, they
assume no liability of any kind for the completeness and accuracy of the information.

This publication is available for free download at http://www.aca-secretariat.be/
This work is licensed under a Creative Commons Attribution-ShareAlike 4.0 International License.

Disclaimer
This project was produced with the support of Erasmus+ Transnational Cooperation Activities (TCA) funding.
The European Commission's support for the production of this publication does not constitute an
endorsement of the contents, which reflect the views only of the authors, and the Commission cannot be
held responsible for any use which may be made of the information contained therein.

                                                                                                        1
Table of Contents
Acknowledgements .......................................................................................................................... 5
Chapter 1: Introduction and Main Findings...................................................................................... 6
Background of the report.............................................................................................................. 6
Main findings ................................................................................................................................ 7
Context – all programme countries .......................................................................................... 7
Trends and patterns – in the nine participating countries ........................................................ 8
Motivations – in the nine participating countries ...................................................................... 9
Impact – in the nine participating countries.............................................................................. 9
Recognition and satisfaction – in the nine participating countries ......................................... 10
Data – potential for further comparative analysis .................................................................. 10
Chapter 2: Methodology................................................................................................................. 12
Coverage .................................................................................................................................... 12
Datasets ..................................................................................................................................... 14
Data analysis .............................................................................................................................. 15
Chapter 3: Erasmus+ Staff Mobility Trends in Context ................................................................. 16
Erasmus+ staff mobility by action type and activity type ........................................................... 16
Erasmus+ staff mobility geographical spread by action type .................................................... 17
KA103 ..................................................................................................................................... 17
KA107 ..................................................................................................................................... 18
Erasmus+ staff mobility participants among all academics in national systems ....................... 20
Chapter 4: Mobility Trends and Patterns ....................................................................................... 22
Erasmus+ staff mobility reported between 2014-2019 .............................................................. 22
Share of mobility instances by country of origin..................................................................... 22
Share of mobility instances by participant, action and activity types ..................................... 23
Distribution of top destination countries ................................................................................. 29
Chapter 5: Motivations ................................................................................................................... 34
Chapter 6: Impact........................................................................................................................... 38
Overview .................................................................................................................................... 38
Impact on personal and professional development ................................................................... 38
Impact on teaching and learning ................................................................................................ 39
Impact on mobility and internationalisation ................................................................................ 41
Impact on foreign language acquisition and intercultural learning ............................................ 43
Impact on job satisfaction and career opportunities .................................................................. 45
Impact on cooperation with players in the labour market and civil society................................ 46
Chapter 7: Recognition and Satisfaction ....................................................................................... 48
2Recognition ................................................................................................................................ 48
Forms of recognition received ................................................................................................ 48
Forms of recognition desired .................................................................................................. 48
Satisfaction ................................................................................................................................. 49
Satisfaction with the overall mobility experience.................................................................... 49
Satisfaction with recognition received .................................................................................... 50
Chapter 8: Limitations and Potential for Further Analysis ............................................................. 54
Annex: Country Charts................................................................................................................... 56
Austria ........................................................................................................................................ 57
Cyprus ........................................................................................................................................ 61
Czech Republic .......................................................................................................................... 64
Greece ........................................................................................................................................ 67
Croatia ........................................................................................................................................ 71
Hungary ...................................................................................................................................... 74
Iceland ........................................................................................................................................ 77
Italy ............................................................................................................................................. 80
Slovenia ...................................................................................................................................... 83
List of Figures
Figure 1 Number of Erasmus+ staff mobility instances by sending country (national agency) .... 13
Figure 2 Staff mobility instances by action type ............................................................................ 16
Figure 3 Staff mobility instances by action type and activity type ................................................. 17
Figure 4 Top 20 receiving countries for KA103 staff mobility by activity type ............................... 18
Figure 5 Top 20 receiving countries for KA107 staff mobility by activity type ............................... 19
Figure 6 Share of mobility instances by country of origin (the nine participating countries) ......... 22
Figure 7 Share of mobility instances by action type and participant type ..................................... 23
Figure 8 Staff mobility instances by start year and action type ..................................................... 24
Figure 9 Share of mobility instances by country and action type .................................................. 25
Figure 10 Share of mobility instances by country and activity type............................................... 26
Figure 11 Mobility trends by activity type and action type ............................................................. 27
Figure 12 Activities carried out during Erasmus+ staff mobility period by activity type ................ 28
Figure 13 Channels of dissemination activities ............................................................................. 29
Figure 14 Top 10 receiving countries of KA103 mobility instances from the nine countries ........ 29
Figure 15 Top 10 destination countries for KA107 mobility instances .......................................... 32
Figure 16 Common motivations for Erasmus+ staff mobility by action type and participant type
(ranked by first-time participants) .................................................................................................. 35
Figure 17 Common motivations for Erasmus+ staff mobility by action type and mobility type ..... 37
Figure 18 Impact on networking .................................................................................................... 39
Figure 19 Impact on acquisition of good practices abroad ............................................................ 39
Figure 20 Impact on knowledge and skills sharing ........................................................................ 40
Figure 21 Impact on the introduction of new teaching subject(s) at the partner institution ........... 40
Figure 22 Impact on the use of new teaching practices at the sending institution ........................ 41
Figure 23 Impact on the quality of mobility in the sending institution ............................................ 42
3Figure 24 Impact on the internationalisation of the sending institution ......................................... 42
Figure 25 Impact on the cooperation with partner institution ........................................................ 43
Figure 26 Impact on the motivation of non-mobile students to take part in mobility ..................... 43
Figure 27 Impact on foreign language skills .................................................................................. 44
Figure 28 Impact on social, linguistic and/or cultural competences .............................................. 44
Figure 29 Impact on job satisfaction .............................................................................................. 45
Figure 30 Impact on employment and career opportunities .......................................................... 45
Figure 31 Impact on cooperation with players in the labour market.............................................. 46
Figure 32 Impact on cooperation with players in the civil society ................................................. 46
Figure 33 Forms of recognition by activity type ............................................................................. 48
Figure 34 Forms of recognition desired by activity type ................................................................ 49
Figure 35 Satisfaction with the overall mobility experience ........................................................... 49
Figure 36 Satisfaction with the form of recognition received ......................................................... 50
Figure 37 Strategic internationalisation and forms of recognition ................................................. 52
Figure 38 Strategic approach to staff mobility by country ............................................................. 52
Figure 39 Satisfaction with recognition received ........................................................................... 53
List of Tables
Table 1 Top sending (partner) countries for KA107 staff mobility, 2015-2019 ............................. 20
Table 2 Estimated share of mobile staff among all academic staff on tertiary levels ................... 21
Table 3 The top 10 countries of destination of KA103 mobility instances from the nine countries,
2014-2019 ...................................................................................................................................... 31
Table 4 The top 10 receiving countries of KA107 mobility instances from the nine countries, 2015-
2019 ............................................................................................................................................... 33
4Acknowledgements
This exploratory study and the ensuing report were conducted between August 2020 and January
2021, under the coordination of Queenie K.H. Lam (Senior Expert), and Irina Ferencz (Director),
both from the Academic Cooperation Association (ACA), and with funding from the Erasmus+
programme, Transnational Cooperation Activities (TCA).
The analysis would not have been possible without the dedicated work and insight of key experts
from the Erasmus+ national agencies that committed to support this study, who accompanied ACA
for the initial methodological refinement, data delivery and cleaning, contextualisation and
interpretation of findings. Special thanks go to:
• Alenka Flander and Bozidar Grigić (Centre of the Republic of Slovenia for Mobility and
European Educational and Training Programmes – CMEPIUS, Slovenia)
• Rúna Vigdís Guðmarsdóttir (The Icelandic Centre for Research – Rannís, Iceland)
• Jakub Tesař and Roman Klepetko (Czech National Agency for International Education and
Research – DZS, Czech Republic)
• Gerhard Volz and Angelika Zojer (Austrian Agency for International Cooperation in
Education and Research, OeAD, Austria)
• Márton Beke and Tibor Tóth (Tempus Public Foundation – TPF, Hungary)
• Maria Katechi and Elina Mavrogiorgou (The State Scholarships Foundation – IKY, Greece)
• Sara Pagliai, Claudia Peritore and Luisella Silvestri (National Institute for Documentation,
Innovation and Educational Research – INDIRE, Italy)
• Maria Hadjigeorgiou and Polina Stavrou (Foundation for the Management of European
Lifelong Learning Programmes, Cyprus)
• Maja Balen (The Agency for Mobility and EU Programmes – AMEUP, Croatia)
Further on, we’d like to thank Johannes Gehringer, Antoaneta Irikova and Benedicte Einarsen, of
the European Commission, Directorate General for Education, Youth, Sport and Culture, who
gracefully helped with the centralised dataset on Erasmus+ staff mobility.
Last but not least, gratitude goes also to Veronika Kupriyanova and Aicha Hefiela, of ACA, for
proofreading the report and for editorial comments.
Irina Ferencz
ACA Director, Brussels
January 2021
5Chapter 1: Introduction and Main Findings
Background of the report
In the European context, the Erasmus mobility has been the main driver of internationalisation
processes over the past three decades, setting in motion the development of a wide range of
services, activities and strategies that led to an increasing professionalisation of international
cooperation in higher education. Both student and staff mobility have been financially supported
by the programme, which initially facilitated mobility between programme countries only. In the
2014-2020 programme period, it was extended to cover partner countries too, turning Erasmus
from a purely European mobility programme into one with global ambitions and mobility flows.
For the general public, Erasmus is primarily known for its student mobility component, although
the programme plays a key role in supporting staff mobility as well. Within the field of higher
education more is known and has been researched comparatively about the student mobility part
of the programme. To date, staff mobility has been covered in the two Erasmus(+) Higher
Education Impact Studies (2014 and 2019), which give some first insights into the added value of
the programme on mobile staff’s personal development, teaching and employment. Also yearly, a
snapshot picture of staff mobility flows in higher education is given in the Annual Erasmus+ reports
published by the European Commission (the latest one for 2019 and its statistical annex);
occasionally, further analysis is pursued at the national level.
A vast amount of data and information is collected on an annual basis on staff mobility via the
Erasmus+ Participant Reports (EUSurvey), which mobile individuals funded via the programme
have to fill in. Nonetheless, this survey data has not been regularly analysed in-depth until now at
European level to create a comparative picture for all programme countries, beyond the aggregate
data published in the Annual reports on the programme. Interested to explore the potential of this
dataset further, nine Erasmus+ national agencies from nine programme countries (Austria,
Croatia, Cyprus, Czech Republic, Greece, Hungary, Iceland, Italy, and Slovenia) came
together and commissioned the Academic Cooperation Association (ACA) to carry out an
exploratory, data mining study covering almost the entire programme period (2014-2019), to
longitudinally assess:
• The potential of this dataset for better understanding Erasmus+ staff mobility and the
appropriateness of the existing questionnaire for carrying out further, more in-depth analysis,
possibly of a more qualitative nature, exploring for example degree of participation, impact on
mobile students, on teaching and on the institutional level, as well as the influence of strategy
on the satisfaction and recognition of staff mobility.
• The potential added value of comparative analysis of staff mobility flows along some key
dimensions, such as general trends and patterns, motivations, impact, recognition and
satisfaction, guided by a number of key questions: Would such comparisons deepen our
knowledge and understanding beyond what we previously knew about staff mobility within the
Erasmus+ programme? Would it be worthwhile to expand such comparisons at full programme
level and to carry them regularly?
This report conveys thus the results of this research, by first portraying the key findings of the
comparative analysis between the nine participating countries in the areas of: general context,
trends and patterns, motivations, impact, recognition and satisfaction. It then concludes by
assessing the value of comparison and the potential of expansion, by also pointing to a number
of possible methodological improvements and topics for further research.
6Main findings
Context – all programme countries
• There was a continuous growth in the total volume of staff mobility instances in the five-year
reference period (2015-2019), in which the total number of Erasmus+ mobile staff almost
doubled, from 53 474 to 92 659.
• The ratio of KA103 (staff mobility between Erasmus+ Programme Countries) and KA107
(staff mobility to/from Partner Countries) also saw a noticeable change over the years. The
share of K107 mobility increased substantially from 0.63% (337) in 2015 to 28% (26 010) in
2019, while the share of KA103 staff mobility for teaching in particular, dropped from 61% (32
603) in 2015 to 35% (31995) in 2019. The share of KA103 staff mobility for training remained
stable over the reference period in the range of 35-38%, with constant growth in absolute
numbers from 20 534 to 34 654.
• For KA103 mobilities, Spain was the top receiving/destination country1 of staff mobility
instances in total both for teaching and training in this period, followed by Italy, Germany, and
the United Kingdom (UK), in this order. While most of the top receiving countries received more
mobility instances for teaching, the UK, Sweden and the Netherlands had received more staff
mobility instances for training. Almost 70% of staff mobility instances destined for the UK was
mobility for training. To a lesser extent, 59% and 55% of the staff mobility instances destined
for Sweden and the Netherlands respectively were for training purpose.
• Programme countries may support outgoing as well as incoming mobilities in KA107. The top
receiving countries of KA107 mobilities were slightly different in order, with Germany
hosting the largest volume of mobility instances, followed by Poland. Spain was only the third,
with the Russian Federation as fourth and Italy as fifth. Among the top receiving countries, staff
mobility for training accounts for more than 50% of all mobility instances in Germany (60%),
Spain (64%), France (59%), the UK (68%), Portugal (60%), Turkey (55%), and the Netherlands
(71%).
• Looking at the top sending partner countries (KA107), excluding programme countries, 13
countries had more than 1 000 mobility instances during the period 2015-2019. Together, 64%
of mobility instances originated from them. The Russian Federation, Ukraine, Serbia2, Israel
and Bosnia and Herzegovina were the top five. Except for China, the United States (US) and
Kazakhstan, the top sending countries were the neighbouring countries of the EU.
• Using 2018 statistics (EUROSTAT), the share of all academic staff who took part in
Erasmus+ staff mobility in the nine study countries was estimated within the range of 4%
(Austria) and 23% (Czech Republic) in this given year. Iceland was an outlier with 45%
because of the small number of academic staff and the lack of a precise number of academic
staff for the entire system.
1 Receiving country and destination country are used inter-changeably in this study to refer to the host countries of outbound
mobile staff. Receiving country is used from the perspective of the host and destination country is used from the perspective of
the outbound mobile staff.
2 Serbia became a Programme Country in 2019. Some outbound mobility activities towards Serbia in 2019 were recorded under
KA107 and some under KA103. In this study, because of the small number of cases involved, all outbound mobility activities
towards Serbia were labeled KA107 for the sake of simplicity in the analysis and representation.
7Trends and patterns – in the nine participating countries
• Based on the responses of the survey in the reference period 2014-2019, an average of 63%
mobility instances were reported by participants who were recurrent recipients of Erasmus+
Programme (or its predecessor Lifelong Learning Programme) fund, while some 38% (28 095)
was reported by first-time participants. However, there were country differences: Cyprus and
Croatia reported substantially more mobility instances undertaken by first-time participants at
56% and 52% respectively. On the contrary, the Czech Republic, Greece, Hungary and
Slovenia had some 65% or more mobility instances undertaken by recurrent participants.
• The vast majority of staff mobility instances in Erasmus+ were found under KA103, as KA107
received a much smaller budget despite the oversubscription of the action observed in the
period 2015-20193. Mobility activities recorded under KA107 started in 2015 and picked up
momentum only from 2016. Since then, the annual share of KA107 mobility instances had
increased from 5% (in 2016) to over 12% in 2019, although both KA103 and KA107 were both
on the rise in absolute numbers. Continuous growth in the share of KA107 mobility was
observed in Austria, Cyprus and Italy.
• Overall, the ratio of staff mobility for teaching to staff mobility for training was 3:2 in the
reference period for the sampled countries and the entire Erasmus+ staff mobility programme.
However, country differences were observed: Iceland, Croatia, Cyprus reported larger shares
of mobility instances for training than for teaching, with training representing some 60% or
more of all. On the contrary, Italy, Austria, the Czech Republic and Hungary, reported some
60% or more staff mobility for teaching. 67% of mobility instances from Italy were for teaching
purpose. Only two countries, Greece and Slovenia, reported an almost balanced share of
50:50 for teaching and training.
• The growth in numbers was, however, much more visible in staff mobility for training rather
than teaching, especially under KA103.
• “Lectures” were the most frequently undertaken activities overall, and they were clearly
related to staff mobility for teaching. On the other hand, an activity much more related to
training was “Job-shadowing”.
• The top ten destinations for KA103 in absolute terms (among staff from the nine countries
and not controlled by country size) were Spain (9 201), Germany (6 264), Poland (4 542), UK
(4 000), Slovakia (3 914), Italy (3 866), France (3 851), Romania (3 847), Portugal (3 636) and
Finland (2 176).
• Geographical proximity could play a key role in staff mobility patterns as well, with large
shares going to neighbouring countries. For example, the largest volume of mobility
instances from Austria was received by Germany. The same was found between the Czech
Republic and Slovakia, Hungary and Romania, to name a few.
• The top destinations for KA107 mobilities out of the nine study countries were Serbia (692),
followed closely by the Russian Federation (688). Israel (571) was the third, followed at quite
some distance by China (334), Ukraine (327) and Albania (300). Only then came the US (248)
which hosted a similar number of mobilities as Bosnia and Herzegovina (231). Among the top
ten were also Georgia and Armenia which received a substantial number of mobility instances
from Italy and Hungary among the sampled countries.
3 In EU from Call 2015 to Call 2019: 4 727 approved projects out of 6 916 received ones (68.3%). Source: Erasmus+ Dashboard.
8Motivations – in the nine participating countries
• The most common motivations, taking into account all the mobility instances concerned,
were for professional networking and the acquisition of good practice abroad, followed by the
reinforcement of institutional cooperation and the development of field-related competences.
On the contrary, the least common motivations were to receive an Erasmus+ grant and to
build up cooperation with the labour market.
• The top four motivations remain the same for both first-timers4 and recurrent participants,
but the first-timers were more likely to be motivated by the acquisition of knowledge and know-
how abroad while the recurrent participants were more likely motivated to reinforce institutional
partnership. It’s clear that networking was the most frequently indicated motivation by both
groups.
• The motivations driving staff mobility for teaching and staff mobility for training were
markedly different. Regarding common motivation driving staff mobility for teaching, sharing
knowledge and skills with students was primarily the motivation of mobility for teaching
(86.66% of all responses citing this motivation). Motivations more related to staff mobility for
training were to improve the services of the sending institution (61%) or to gain job-related
practical skills (60%).
Impact – in the nine participating countries
• There appears to be a clear alignment between the reported motivations and perceived
impact. Stronger impact was reported on short-term and personal/professional development
as opposed to long-term or institutional impact in general. The perceived impact on mobility
and internationalisation was largely positive on both personal and institutional level.
• Overwhelmingly positive impact was reported on networking and the learning of good
practices abroad. Despite slight country differences, some 90% of the respondents, on average,
indicated that they “strongly agree” or “rather agree” to the statements that they have
reinforced/extended their professional network or learned from good practices abroad. On
average, over 60% and some 55% “strongly agreed” to the two statements respectively.
• On teaching and learning: Another overwhelmingly positive direct impact of Erasmus+ staff
mobility seems to lie in sharing one’s own knowledge and skills with students and/or other
persons for staff who took part in mobility for teaching. On average, 97% of the responses
from mobility instances for teaching purpose indicated “rather agree” or “strongly agree” to this
statement.
• On mobility and internationalisation: impact on the quality of mobility, internationalisation,
institutional cooperation and the motivation of non-mobile students was generally positive, with
more than 70% of positive responses on average. As to the perceived impact on the sending
institution, 76.5% of all responses indicated “strongly agree” or “rather agree” to the statement
“I contributed to increasing the quality and quantity of student or staff mobility to and from my
sending institution”. A slightly lower average of 72.6% indicated “strongly agree” or “rather
agree” to the statement that the mobility has led to the internationalisation of the home
institution. Similarly, around 73% of the responses indicated “strongly agree” or “rather agree”
to the statement that the mobility “Has led to new/increased cooperation with the partner
4The term first-timers in this study refers to participants who reported in the survey that the mobility in question was the first staff
mobility period financed by the Erasmus+ or Lifelong Learning Programmes. In the Erasmus+ framework, they are also known
as newcomers.
9institution/organisation(s)”. When it comes to the perceived impact on the receiving institution,
the impact of staff mobility on motivating students to take part in mobility is just as strong with
75.7% indicated “strongly agree” or “rather agree” that the mobility “Has enhanced the
motivation of non-mobile students to study/ do a traineeship abroad”.
• On foreign language acquisition and intercultural learning: There are noticeable country
differences in terms of the perceived impact on the acquisition of foreign language skills, but a
largely positive impact across the board on increased social, linguistic and/or cultural
competences was reported. More than 80% of the responses indicated “strongly agree” or
“rather agree” to this question.
• On job satisfaction and career opportunities: Comparing the impact on “job satisfaction”
and the impact on “employment and career opportunities”, the former was felt more strongly
by the mobile staff than the latter.
• On cooperation with the labour market and civil society: Great uncertainties were reflected
both in the impact on cooperation with players in the labour market and the civil society, with
large shares of “neither agree or disagree” responses across the board (30-45%), and small
shares of positive responses, counting both “strongly agree” and “rather agree” (below 20%),
in most countries.
Recognition and satisfaction – in the nine participating
countries
• The most frequently mentioned form was recognition as part of the participant’s yearly work
plan. This applies to both mobility instances for teaching and for training. For training,
informal recognition by the management was the second most mentioned, while for teaching
mobility, the second most mentioned form of recognition was inclusion in the participant’s
annual performance assessment.
• The satisfaction with the different forms of recognition received, formal or informal, were
only of small difference in percentage terms, between 65 and 71%. What is worth noting is the
much higher share of unsatisfied respondents (31.87%) who mentioned that their mobility
experience was not recognised at all.
• On satisfaction with the mobility experience, over 99% of the responses said they were
“very satisfied” or “rather satisfied” with the overall mobility experience, with some country
variation.
• Overall, a strategic approach to internationalisation appears to be positively correlated to
more formal forms of recognition and thus indirectly to higher satisfaction. This could be
an interesting area to be further investigated.
Data – potential for further comparative analysis
• On the added value of comparative analysis, this report has provided the most
comprehensive overview on the motivation, impact, recognition and satisfaction of staff mobile
with the Erasmus+ programme from the nine participating countries. This pilot pointed to
similarities as well as differences between participating countries that can help deepen the
understanding of staff mobility patterns and country differences. It seems reasonable to expect
that extending such an analysis to the entire programme level would provide an even more
complete and insightful picture on the perceived impact of the programme, and that such in-
depth analysis of the national datasets on the one hand and comparisons across programme
10countries on the other could be done at regular intervals, for a more longitudinal perspective
on the programme.
• On the potential of the dataset for further research, the analysis shows that this potential is
immense, and that it could be further maximised via: a number of methodological
improvements in the current Participant Report survey, by linking collected data to other
datasets (at national and at EU levels, subject to compliance with private data protection
regulations, and by supplementing them with new types of data (e.g. tracer studies) to give a
more nuanced picture on the longer-term and institutional level impact of the programme (e.g.
on new cooperation and enhanced mobility experiences). The impact of incoming enterprise
participants could also be further explored from the perspective of the host institutions.
11Chapter 2: Methodology
Coverage
The nine countries that took part in this comparative study represent a diverse geographical spread
as well as a broad variety in size, measured through the volume of finalised mobility instances5,
although this was somewhat coincidental, as the nine countries volunteered to take part in this
comparative analysis (see Figure 1 below). The nine countries are: Austria (AT), Cyprus (CY),
Czech Republic (CZ), Greece (EL), Iceland (IS), Italy (IT), Hungary (HU), Croatia (HR), and
Slovenia (SI). The group covers countries from the Northern/Western (IS), Central/Eastern (CZ,
HU), Central/Western (AT), Central/Southern (HR, SI) and Southern (IT, CY, EL) parts of the
European Union (EU).
In terms of the volume of mobility activities, if we leave aside Poland, Germany and Spain which
have substantially larger volume of mobility instances than the other programme countries, the
Czech Republic, Italy and Hungary are countries with a relatively large volume of mobility instances
funded by Erasmus+. At the other end of the spectrum, Cyprus and Iceland represent smaller
countries and higher education systems with fewer mobility instances. The rest – Austria, Greece,
Croatia and Slovenia – can be considered mid-range countries in terms of the volume of Erasmus+
mobility instances. For a pilot study, this coverage provides a rather good basis for generating
initial insights for designing a fully representative study that would cover all the Erasmus+
programme countries.
5 As it is shown in this study, it is not uncommon for staff members to take part in EU-funded mobility programmes (Erasmus+
and its predecessor Lifelong Learning Programme) more than once. Each of the survey response corresponds to one mobility
occurrence, termed as a “mobility instance” in this study, instead of one unique person who may have returned more than one
response in a given year or the selected reference period.
12Figure 1 Number of Erasmus+ staff mobility instances by sending country (national agency)
Number of Erasmus+ staff mobility instances
by sending country (national agency)
2014-2019 (N=389 251)
Austria - AT01
Belgium - BE01
Belgium - BE02
Belgium - BE03
Bulgaria - BG01
Croatia - HR01
Cyprus - CY01
Czech Republic - CZ01
Denmark - DK01
Estonia - EE01
Finland - FI01
France - FR01
Germany - DE01
Greece - EL01 2014
Hungary - HU01 2015
Iceland - IS01 2016
Ireland - IE02 2017
Italy - IT02 2018
Latvia - LV01 2019
Liechtenstein - LI01
Lithuania - LT01
Luxembourg - LU01
Malta - MT01
Netherlands - NL01
Norway - NO01
Poland - PL01
Portugal - PT01
Romania - RO01
Slovakia - SK01
Slovenia - SI01
Spain - ES01
Sweden - SE01
The Republic of North Macedonia…
Turkey - TR01
United Kingdom - UK01
0 10000 20000 30000 40000 50000 60000
13Datasets
Analysis in this study was based on two major sets of quantitative data: survey data collected via
the Participant Report Form in each of the nine participating countries, and administrative data
centrally extracted by the European Commission from the Mobility Tool+.
First, survey data was extracted from the Erasmus+ reporting tool by the nine participating
National Agencies. This survey data covers the reference years 2014-2019 (calendar year) during
which the mobility instances started. This dataset contains exclusively anonymised survey
responses from the “Participant Report Form – Call (Year) – KAI – Mobility of Staff in higher
education - Staff mobility for teaching and training activities” that mobility participants were obliged
to return after completing the mobility. During the reference period, the questionnaire remained
largely unchanged except the introduction of Not Applicable as a response option for Question 5
“Personal and professional development and impact” and the slight rewording of the sub-question
concerning “strategy” as shown below:
From: Question 2.7 Is mobility of staff actively encouraged by your institution as part of its strategy for
internationalisation? (Report Form of Call Year 2015)
To: Question 2.9 Is mobility of staff actively encouraged by your institution as part of its institutional
strategy (such as its overall strategy, staff development or internationalisation strategy)? (Report Form of
Call Year 2016 onwards)
The survey instrument was thus stable enough to return comparable data for longitudinal studies
on major dimensions of staff mobility covered over the years. The use of the standardised
questionnaire among all participating countries of Erasmus+ programme and the mandatory nature
of the post-mobility survey also ensure the availability of a rich dataset for further comparative
studies.
The survey data gathered in this study are, however, not without flaws. As with most large-scale
datasets, there is a tradeoff between data accuracy and timeliness. The crowd-sourced data for
the recent years, covering up to 2020 calendar year in some countries, may not have been
validated and may still be subject to changes. While it is possible to obtain validated data of the
same survey from the European Commission covering all countries, the centralised database
provides only validated data for the period 2014-2016. Any comparative analysis looking at more
recent data would have to decide between timeliness and accuracy.
Another potential flaw of the data from a mandatory post-mobility survey with an average of 99%
response rate is a positive bias about the EU-funded mobility experience and a potential bias
towards personal impact. Such potential survey biases should be taken into account when
interpreting the responses or when improving the survey instrument for the new funding
programme.
Second, administrative data was extracted by the European Commission’s centralised
Erasmus+ reporting tool. In addition to the anonymised survey data crowd-sourced from the nine
National Agencies, administrative data covering the whole population of Erasmus+ staff mobility
were obtained from the European Commission to contextualise this pilot study. The administrative
data include validated data covering all countries for the period 2014-2016 and non-validated data
for the period 2017-2018 (call year).
Although it is not possible in this study to join the anonymised administrative data with the
anonymised survey data, the centralised dataset of the European Commission confirms that the
survey data represents an average of 99% of all the mobilities undertaken in the Erasmus+
framework, i.e. almost perfect coverage of all mobility instances. In some countries, the number of
the survey responses even exceeds that of the number of records in the centralised database.
14This is a reflection of the timeliness and accuracy issue mentioned above which may only be
resolved over time when both the survey data and administrative data on the national and EU-
levels are validated and tallied in the same reporting system.
In this study, no attempt has been made to join or tally the two datasets. For future study on the
impact of staff mobility, a more centralised approach to extract both the survey and administrative
data from one system, if possible, would allow for more efficient and in-depth correlation analysis
while preserving the anonymity of the survey respondents.
Other than the survey data and administrative data, reference data of the number of academic
staff was also extracted from EUROSTAT to indicate the share of university teachers participated
in Erasmus+ staff mobility programme. However, it must be noted that the share derived from the
calculation could only be, at most, indicative because of the different definitions of “academic staff”
and missing national data for comparison in the relevant databases.
Data analysis
Intended as an exploratory pilot study, this study cross-tabulated almost all the variables of the
survey responses except those concerning personal data and financial data which were excluded
from the dataset. The analysis conducted was primarily quantitative and based on the survey data
and administrative data although some contextual qualitative feedback and input were collected
from the National Agencies and the European Commission to inform the interpretation of the data.
For more in-depth analysis, especially on the differences observed on country level, more
qualitative data (e.g. interviews with data collectors, funding programme coordinators,
policymakers and a sample of mobile staff, or document analysis of policy papers, funding guides
and priorities) would be necessary for explaining the trends and patterns observed in the trend and
pattern analysis (e.g. Why do the Cypriot staff members have a preference over the UK as a
destination?).
15Chapter 3: Erasmus+ Staff Mobility Trends in
Context
The analysis of the staff mobility survey responses in this study was based on the data centralised
from nine countries only. To put the analysis in the broader context of Erasmus+ staff mobility, the
research team requested additionally anonymised administrative data from the European
Commission to triangulate the national data on one hand and to assess the potential of upscaling
the pilot study to the European level on the other.
Erasmus+ staff mobility by action type and activity type
Based on the administrative data of all the programme countries participating in Erasmus+ staff
mobility in the period 2015-20196, there was a continuous growth in the total volume of staff mobility
instances which almost doubled in the five-year period from 53 474 to 92 659. The ratio of KA103
(staff mobility between Erasmus+ Programme Countries) and K107 (staff mobility to/from Partner
Countries) also saw a noticeable change over the years as the share of K107 mobility increased
substantially from 0.63% (337) in 2015 to 28.07% (26 010) in 2019 (Figure 2), in line with the
increase in funding for this activity, although the growth in total staff mobility instances from 2018
to 2019 was only marginal (Figure 3).
Figure 2 Staff mobility instances by action type
Staff mobility instances by action type
2015-2019 (N=380 615)
337
100.00%
7003
90.00% 16903 23275 26010
80.00%
70.00%
60.00%
50.00% 53137
56185 KA107
40.00% 61975 69141 66649
30.00% KA103
20.00%
10.00%
0.00%
2015 2016 2017 2018 2019
KA107 0.63% 11.08% 21.43% 25.19% 28.07%
KA103 99.37% 88.92% 78.57% 74.81% 71.93%
A more detailed look into the respective shares of mobility instances by action type and activity
type in the period 2015-2019 (Figure 3) shows that KA107 mobility, both for teaching and training,
had increased at the expense of KA103 staff mobility for teaching, which dropped from 60.97% (32
603) in 2015 to 34.53% (31 995) in 2019. The share of KA103 staff mobility for training remained
6 For trend analysis in this study, the data of 2014 were excluded in most cases because half of the year fell under the previous
funding cycle of the Lifelong Learning Programme.
16stable over the reference period in the range of 35-38%, with constant growth in the absolute
numbers from 20 534 to 34 654 over the years.
Figure 3 Staff mobility instances by action type and activity type
Staff mobility instances
by action type and activity type
2015-2019 (N=380 615)
100000
90000
12.08% 13.75%
80000
4.43% 9.83% 13.11% 14.32%
70000
0.30% 11.60%
60000 6.65%
36.02%
50000 35.34% 37.40%
38.40% 36.29%
40000
30000
20000 38.79%
60.97% 52.62% 43.23% 34.53%
10000
0
2015 2016 2017 2018 2019
KA107 Staff mobility for Training 163 2800 7751 11163 12744
KA107 Staff mobility for Teaching 174 4203 9152 12112 13266
KA103 Staff mobility for Training 20534 22933 27874 33290 34654
KA103 Staff mobility for teaching 32603 33252 34101 35851 31995
Erasmus+ staff mobility geographical spread by action type
KA103
Without much surprise, for mobility amongst programme countries (KA103), Spain was the top
receiving country of staff mobility instances in total and in both activity types (teaching and training)
in the period 2015-19. Following that were Italy, Germany and the United Kingdom (UK) in
descending order of the total volume (Figure 4). The UK received, however, more staff mobility
instances for training than Germany and Italy. While most of the top receiving countries received
more mobility instances for teaching, the UK, Sweden and the Netherlands had received more
staff mobility instances for training than for teaching. Almost 70% of staff mobility instances
destined for the UK was mobility for training. To a lesser extent, 59% and 55% of the staff mobility
instances destined for Sweden and the Netherlands respectively were for training purposes.
Among other top 5 receiving countries in total volume, Italy and France had hosted noticeably more
staff mobility instances for teaching than for training, which account for about 60% of the total staff
mobility instances received by them. Other countries that hosted significantly more staff mobility
instances for teaching (65% or more of the country’s total volume received) than training were:
Poland, Romania, Slovakia, and Bulgaria.
17Figure 4 Top 20 receiving countries for KA103 staff mobility by activity type
Top 20 receiving countries for KA103 staff mobility
by activity type
2015-2019 (N=269 224)
ES - Spain 53.56% 46.44%
IT - Italy 59.49% 40.51%
DE - Germany 55.78% 44.22%
UK - United Kingdom 31.02% 68.98%
FR - France 60.71% 39.29%
PL - Poland 66.59% 33.41%
PT - Portugal 55.85% 44.15%
CZ - Czech Republic 58.95% 41.05%
FI - Finland 51.03% 48.97%
Staff mobility
RO - Romania 69.04% 30.96% for teaching
SK - Slovakia 67.87% 32.13%
between
Programme
HU - Hungary 56.98% 43.02% Countries
NL - Netherlands 44.54% 55.46%
Staff mobility
BE - Belgium 54.16% 45.84% for training
between
AT - Austria 53.25% 46.75%
Programme
EL - Greece 58.70% 41.30% Countries
LT - Lithuania 63.50% 36.50%
TR - Turkey 59.96% 40.04%
58.79%
SE - Sweden 41.21%
35.04%
BG - Bulgaria 64.96%
0 5000 10000 15000 20000 25000 30000 35000 40000
KA107
Programme countries may support outgoing as well as incoming mobilities in KA107. During the
same reference period 2015-2019, the top receiving countries for incoming staff mobility from
partner countries (KA107) were slightly different in order, with Germany hosting the largest volume
of mobility instances, followed by Poland. Spain was only the third. Italy was the fifth, following the
Russian Federation, which was the fourth. Among the top receiving countries, staff mobility for
training accounts for more than 50% of all mobility instances in Germany (60%), Spain (64%),
France (59%), the UK (68%), Portugal (60%), Turkey (55%), and the Netherlands (71%) (Figure
5). Comparatively speaking, it was more likely for countries to receive incoming KA107 mobility for
training than teaching when compared to KA103 mobility in which only three countries hosted more
training mobility than teaching mobility.
18Figure 5 Top 20 receiving countries for KA107 staff mobility by activity type
Top 20 receiving countries for KA107 Staff Mobility
by activity type
2015-2019 (N=46 032)
DE - Germany 40.32% 59.68%
PL - Poland 58.31% 41.69%
ES - Spain 36.22% 63.78%
RU - Russian Federation 60.37% 39.63%
IT - Italy 54.30% 45.70%
RO - Romania 55.30% 44.70%
FR - France 41.10% 58.90%
UK - United Kingdom 31.61% 68.39%
RS - Serbia 63.31% 36.69%
IL - Israel 50.00% 50.00%
UA - Ukraine 68.79% 31.21% Staff mobility for Teaching
To/From Partner Countries
PT - Portugal 39.96% 60.04% Staff mobility for Training To/From
Partner Countries
TR - Turkey 45.21% 54.79%
CN - China (People's Republic of) 59.62% 40.38%
NL - Netherlands 28.72% 71.28%
BA - Bosnia and Herzegovina 54.47% 45.53%
EL - Greece 52.61% 47.39%
HU - Hungary 67.78% 32.22%
GE - Georgia 60.25% 39.75%
CZ - Czech Republic 57.56% 42.44%
0 1000 2000 3000 4000 5000 6000
Looking at the top sending countries among partner countries (excluding outward mobility from
programme countries), 13 countries had more than 1 000 mobility instances during the period
2015-2019 (Table 1). Together, 64% of mobility instances originated from them. The Russian
Federation, Ukraine, Serbia7, Israel, and Bosnia and Herzegovina were the top five. Except for
China, the United States (US) and Kazakhstan, the top sending countries are the neighbouring
countries of the EU. It must be noted, however, that the figures reflected not merely the popularity
of the Erasmus+ programme countries among staff from these countries but the policy and funding
priorities of the EU programmes in incentivising the cooperation with these countries.
7 Serbia became a Programme Country in 2019. Some outbound mobility activities towards Serbia in 2019 were recorded under
KA107 and some under KA103. In this study, because of the small number of cases involved, all outbound mobility activities
towards Serbia were labeled KA107 for the sake of simplicity in the analysis and representation.
19Table 1 Top sending (partner) countries for KA107 staff mobility, 2015-2019
Top sending (partner) country Count of mobility % of Grand Total
instances (1 000+)
RU – Russian Federation 4057 5.52%
UA – Ukraine 3590 4.88%
RS – Serbia 3426 4.66%
IL – Israel 2222 3.02%
BA – Bosnia and Herzegovina 1778 2.42%
AL – Albania 1718 2.34%
GE – Georgia 1653 2.25%
MA – Morocco 1179 1.60%
CN – China (People's Republic of) 1158 1.57%
TN – Tunisia 1056 1.44%
US – United States 1033 1.40%
KZ – Kazakhstan 1028 1.40%
EG – Egypt 1003 1.36%
Grand Total 73528 100.00%
Erasmus+ staff mobility participants among all academics
in national systems
Staff mobility did not only take place within the Erasmus+ framework. The contribution of Erasmus+
staff mobility varied across countries. Despite the lack of a full picture covering all staff mobility
activities in the national systems, a rough estimate of the share of academic staff who took part in
Erasmus+ mobility may be derived from the number of Erasmus+ registered participants (excluding
non-teaching staff) and the number of academic staff on tertiary levels (6-8) captured in
EUROSTAT database.
Using the 2018 statistics of these two datasets as the basis, the share of all academic staff who
took part in Erasmus+ staff mobility was estimated within the range of 4-23% (Table 2). Iceland
was an outlier with 45% because of the small number of academic staff and the lack of a precise
number of academic staff for the entire system.
To arrive at a more precise staff mobility rate, it would be necessary, however, to align the data
definitions of “academic staff at tertiary education” in both datasets.
For the mobility rate of non-teaching/administrative staff, there is currently no comparable
reference data on the national or international level. Although some universities have reported
such data to the European Tertiary Education Register (ETER), the amount of data in the register
is not sufficient to reflect the picture on the national level. Like credit mobility statistics for students,
mobility rate of non-teaching staff would first need a massive data collection exercise to establish
a set of comparable reference data.
20Table 2 Estimated share of mobile staff among all academic staff on tertiary levels
Estimated share of mobile staff among all academic staff on tertiary levels
Country 2018 2018 (Eurostat % of mobile
(E+ registered teachers & teachers/academic
participants)# academic staff)* staff
AT – Austria 2147 53003 4%
HR – Croatia 1395 16625a 8%
CY – Cyprus 295 2634 11%
CZ – Czech Republic 4303 18712 23%
EL – Greece 1950 17288 11%
HU – Hungary 3500 20739b 17%
c
IS – Iceland 273 606 45%
IT – Italy 4992 92744 5%
SI – Slovenia 1268 5745 22%
Notes: a. EUROSTAT data 2017; b. EUROSTAT data 2016; c. University of Iceland tenured
teachers 2018
Data sources: # European Commission; *EUROSTAT classroom teachers and academic staff at tertiary education (levels 6-8)
21Chapter 4: Mobility Trends and Patterns
Erasmus+ staff mobility reported between 2014-2019
The analysis in this chapter was based on the survey data extracted from the Erasmus+ reporting
tool by the nine participating National Agencies. After data cleaning, there are 75 023 unique
records captured in the reference years 2014 to 2019 (calendar years when mobility activities
funded by Erasmus+ started) (see Figure 6). These are responses of individual Erasmus+ staff
mobility participants who were obliged to return the report after undertaking outgoing mobility
activities, including KA103 and KA107 mobility for teaching and training. The average response
rate is estimated to be 99% based on the survey data and the reference data obtained from the
European Commission.
Share of mobility instances by country of origin
Among the 75 023 records sampled from the nine participating countries, the largest shares of
records came from the Czech Republic (24%), Italy (23%) and Hungary (17%). Austria and Greece
each accounted for about 10%, being the mid-size countries in terms of the volume of mobility
instances. Slovenia and Croatia each accounted for 6%, representing the small countries, but the
smallest countries in the sample are Iceland (2%) and Cyprus (1%).
Figure 6 Share of mobility instances by country of origin (the nine participating countries)
Share of Erasmus+ mobility instances
by country of origin
2014-2019, (N=75 023)
CY
SI AT 1063 AT
4432 8588 1%
6% 11% CY
IT
17192 CZ
23% EL
CZ
17807 HR
24%
IS HU
1125 IS
2% HU
EL
12885 HR 7243 IT
17% 4688 10% SI
6%
22You can also read