Europe's War against COVID-19: A Map of Countries' Disease Vulnerability Using Mortality Indicators - MDPI
←
→
Page content transcription
If your browser does not render page correctly, please read the page content below
International Journal of
           Environmental Research
           and Public Health

Article
Europe’s War against COVID-19: A Map of Countries’
Disease Vulnerability Using Mortality Indicators
Alexandra Horobet 1 , Anca Angela Simionescu 2, *, Dan Gabriel Dumitrescu 1 and
Lucian Belascu 3
 1    Department of International Business and Economics, The Bucharest University of Economic Studies,
      010374 Bucharest, Romania; alexandra.horobet@rei.ase.ro (A.H.); dan.dumitrescu@rei.ase.ro (D.G.D.)
 2    Carol Davila University of Medicine and Pharmacy, Department of Obstetrics and Gynecology,
      Filantropia Hospital, 020021 Bucharest, Romania
 3    Department of Management, Marketing and Business Administration, Lucian Blaga University of Sibiu,
      550024 Sibiu, Romania; lucian.belascu@ulbsibiu.ro
 *    Correspondence: anca.simionescu@umfcd.ro; Tel.: +40-021-318-8937

 Received: 8 August 2020; Accepted: 7 September 2020; Published: 9 September 2020

 Abstract: Specific and older age-associated comorbidities increase mortality risk in severe forms
 of coronavirus disease (COVID-19). We matched COVID-19 comorbidities with causes of death
 in 28 EU countries for the total population and for the population above 65 years and applied a
 machine-learning-based tree clustering algorithm on shares of death for COVID-19 comorbidities and
 for influenza and on their growth rates between 2011 and 2016. We distributed EU countries in clusters
 and drew a map of the EU populations’ vulnerabilities to COVID-19 comorbidities and to influenza.
 Noncommunicable diseases had impressive shares of death in the EU but with substantial differences
 between eastern and western countries. The tree clustering algorithm accurately indicated the presence
 of western and eastern country clusters, with significantly different patterns of disease shares of death
 and growth rates. Western populations displayed higher vulnerability to malignancy, blood-related
 diseases, and diabetes mellitus and lower respiratory diseases, while eastern countries’ populations
 suffered more from ischaemic heart, cerebrovascular, and circulatory diseases. Dissimilarities between
 EU countries were also present when influenza was considered. The heat maps of EU populations’
 vulnerability to diseases based on mortality indicators constitute the basis for more targeted health
 policy strategies in a collaborative effort at the EU level.

 Keywords: COVID-19; comorbidities; mortality; Europe; eastern countries; western countries

1. Introduction
      Coronavirus disease (COVID-19) impact has brutally revealed vulnerabilities in countries’
responses, evident in the disease’s spread and virulence, and in terms of health policy measures. As of
July 10, 2020, Europe held the second-highest number of deaths caused by the disease (196,475, 35.09%
of all deaths) and the third-highest number of cases (2,558,747, 20.51% of the total, after America and
Asia) [1]. With 3423.7 cases, 262.6 deaths per million inhabitants, and a case fatality ratio (CFR) of
7.67%, Europe is facing a critical situation. In the European Union, there were 179,192 COVID-19
deaths—a mean of 200.21 deaths per million inhabitants (p < 0.05), varying between 5.00 (Slovakia)
to 844.00 (Belgium). Five countries (Belgium, United Kingdom, Spain, Italy, and Sweden) had more
than 500 deaths per million inhabitants, and another three countries had more than 200 deaths (France,
Netherlands, and Ireland). A stark contrast between the EU’s western and eastern parts was calculated;
eastern countries had a mean of 41.36 deaths per million inhabitants (p < 0.05), while their western
counterparts had a mean of 303 deaths (p < 0.05)—based on [1].

Int. J. Environ. Res. Public Health 2020, 17, 6565; doi:10.3390/ijerph17186565   www.mdpi.com/journal/ijerph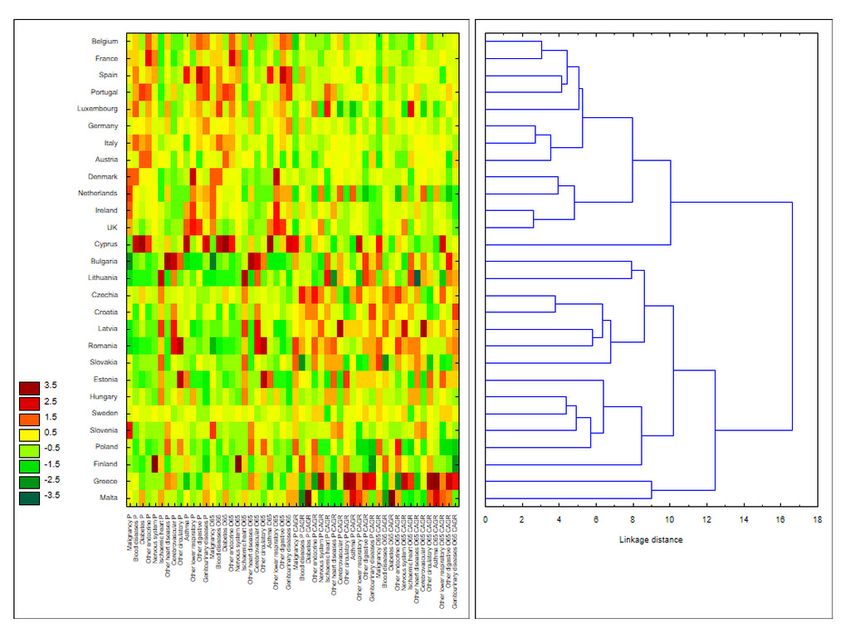
Int. J. Environ. Res. Public Health 2020, 17, 6565                                                  2 of 19

      Mathematical models have demonstrated the swift, exponential spread of Severe Acute Respiratory
Syndrome Coronavirus 2 (SARS-CoV-2) and have shown that the viral latency period and disease
contagion are positively correlated [2]. Clinical features are very different, from asymptomatic to
symptomatic cases. After an incubation period of 5 days, it is estimated that 81% of infected persons
develop symptoms [2–4]. Death occurs in the symptomatic cases, and the time from symptom onset to
death follows a log-normal distribution, with a mean of 20.2 days [5]. For those over 70 years and who
have associated comorbidities, a rapid potential for progression to death from the onset of fever has
also been estimated [6].
      Financial efforts to fight the disease are remarkable: the World Health Organization Global
Fund initiative (USD$1 billion funding) [7] or the EU research funds of €352.5 million [8], including
vaccine, treatment, and test development. Customary epidemic community measures were also taken,
including social distancing, wearing a mask, washing hands, quarantine, self-isolating, and partial or
total lockdown [9], with disastrous economic and social consequences, and financial losses.
      Using the model of influenza pandemics, clinical data reporting on severe forms of COVID-19
have highlighted associated cardiovascular diseases, neoplasia, diabetes, obesity-related comorbidities,
and an age above 65 years as significant mortality risk factors [10–13]. The concept of “vulnerability”
has been introduced since the early 1990s to study the impact of natural disasters on populations, as a
test of society’s ability to make vulnerable populations resilient when disaster strikes [14,15]. In order
to address populations’ vulnerabilities to diseases, the WHO has developed tools and guidance to
support countries’ efforts against the expansion of noncommunicable diseases [16]. EU health policies
have focused so far on reducing known risk factors associated with chronic diseases, smoking, obesity,
and binge drinking as significant determinants of the leading causes of death: cardiovascular diseases
and cancer. At the same time, the EU has implemented guidelines and have encouraged the finding of
new treatment molecules.
      Still, new causes of death and risk factors were reported, yet there are unexpected connections
between communicable (CDs) and noncommunicable diseases (NCDs) [17,18]. NCDs hold a higher
toll on the number of deaths than CDs; 71% of all deaths globally occur from NCD diseases, of which
15 million people are between 30 and 69 years [19]. NCDs have overtaken CDs and are the leading
causes of global mortality and morbidity; according to WHO data, 71% of all deaths at the global level
were caused by NCDs in 2018 [20]. While significant advances against CDs have been made, there is
insufficient progress in preventing and controlling NCDs [21]. The time spent when placed in special
measures for the vulnerable population may be associated with the proportion of intensive care units
(ICU) admissions and deaths associated with the COVID-19 pandemic [22].
      Our study’s objectives reside in mapping EU countries based on their populations’ vulnerability
to COVID-19 comorbidities and in further associating these vulnerabilities with COVID-19 and
influenza incidence. Influenza’s importance as a cause of death might provide valuable insight
into countries’ preparedness before the COVID-19 outbreak. To our present knowledge, this is the
first systematic and statistically enforced approach towards grasping EU countries’ vulnerability to
COVID-19 comorbidities as a useful tool for appropriate management strategies to be implemented.

2. Methods
     Causes of death for the 28 EU member countries (as of December 31, 2019) from the European
Mortality Database and Eurostat between 2011 and 2016 were matched with 13 comorbidities for
hospitalized patients for COVID-19 disease [23,24]. The total population we cover in this study is
507,070,197, of which 5,590,916 are deaths (as 2011–2016 averages). We have selected 13 comorbidities
described in Tomlins et al. (2020) found in the case of 95 sequential hospitalized patients in the United
Kingdom diagnosed with COVID-19 [12]. Further, we matched them to the best with the causes of
death for which data was available, using the International Statistical Classification of Diseases and
Related Health Problems 10th Revision (ICD-10) [25]; see Table 1. Moreover, we have collected data
on influenza-caused deaths (influenza (including swine flu) J09-J11 ICD-10 code) for 27 out of 28 EU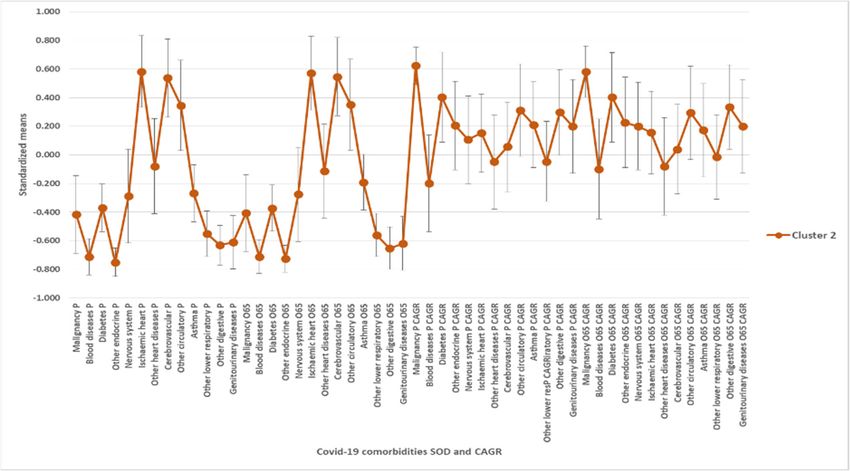
Int. J. Environ. Res. Public Health 2020, 17, 6565                                                                     3 of 19

countries—Malta was excluded due to lack of data availability (i.e., the Malta has not provided data on
deaths caused by influenza between 2011 and 2016). Data on causes of death was collected for the total
population and the population aged 65 years for the 2011–2016 period, for all genders.

                              Table 1. Comorbidities and causes of death used in the study.

 Comorbidity Identified in            Cause of Death—ICD-10         Cause of Death—ICD-10 Code          Cause of Death
 Tomlins et al. (2020) [12]                    Code                   Included in the Research           in the Study
                                        I10–I15 Hypertensive        Other diseases of the circulatory
         Hypertension                                                                                   Other circulatory
                                              diseases               system (remainder of I00–I99)
                                       I20–I25 Ischaemic heart         Ischaemic heart diseases
   Ischaemic heart disease                                                                              Ischaemic heart
                                               diseases                       (I20–I25)
        Cardiac failure                    I50 Heart failure         Other heart diseases (I30–I51)
                                          I49 Other cardiac                                               Other heart
          Arrhythmia                                                 Other heart diseases (I30–I51)        diseases
                                            arrhythmias
         Valve disease               I30–51 Other heart diseases     Other heart diseases (I30–I51)
                                       I60–69 Cerebrovascular          Cerebrovascular diseases
       Cerebrovascular                                                                                  Cerebrovascular
                                              diseases                        (I60–I69)
                                     J45–46 Asthma and status       Asthma and status asthmaticus
            Asthma                                                                                          Asthma
                                            asthmaticus                      (J45–J46)
     Chronic obstructive            J44 Other chronic obstructive   Other lower respiratory diseases
     pulmonary diseases              pulmonary disease (COPD)                (J40–44_47)
                                                                    Other lower respiratory diseases      Other lower
         Bronchiectasis                   J47. Bronchiectasis
                                                                             (J40–44_47)                  respiratory
                                                                    Other lower respiratory diseases
  Obstructive sleep apnoea               G47.3. Sleep apnoea
                                                                             (J40–44_47)
                                      Disease of the digestive       Other diseases of the digestive    Other digestive
   Gastrointestinal disease
                                     system, unspecified K92.2      system (remainder of K00–K93)          diseases
                                                                    Another endocrine, nutritional
      Endocrine disease             E34–35 Endocrine disorders         and metabolic diseases
                                                                      (remainder of E00–E90)            Other endocrine
                                                                    Another endocrine, nutritional         diseases
                                        Obesity and other
            Obesity                                                    and metabolic diseases
                                    hyperalimentation (E65–E68)
                                                                      (remainder of E00–E90)
            Diabetes                 Diabetes mellitus (E10–14)       Diabetes mellitus (E10–14)            Diabetes
                                        Malignant neoplasms
          Malignancy                                                Malignant neoplasms (C00–C97)         Malignancy
                                             (C00–C97)
                                      Diseases of the nervous
                                                                    Diseases of the nervous system
     Neurological disease           system and the sense organs                                         Nervous system
                                                                    and the sense organs (G00–H95)
                                            (G00–H95)
                                       Diseases of kidney and        Diseases of the genitourinary
         Renal disease                                                                                   Genitourinary
                                          ureter N00–N29                  system (N00–N99)
                                                                       Diseases of the blood and
                                     D80-D89 Certain disorders
                                                                      blood-forming organs and
    Immunocompromised                 involving the immune                                                   Blood
                                                                    certain disorders involving the
                                           mechanism
                                                                    immune mechanism (D50–89)
                                    J09–J11 Influenza (including    Influenza (including swine flu)
           Influenza                                                                                       Influenza
                                             swine flu)                        (J09–J11)

     We calculated the mean share of death (SOD)—the percentage of deaths attributed to a specific
cause of death in the total number of deaths—and its compound annual growth rate (CAGR) between
2011 and 2016. The CAGR was calculated as follows: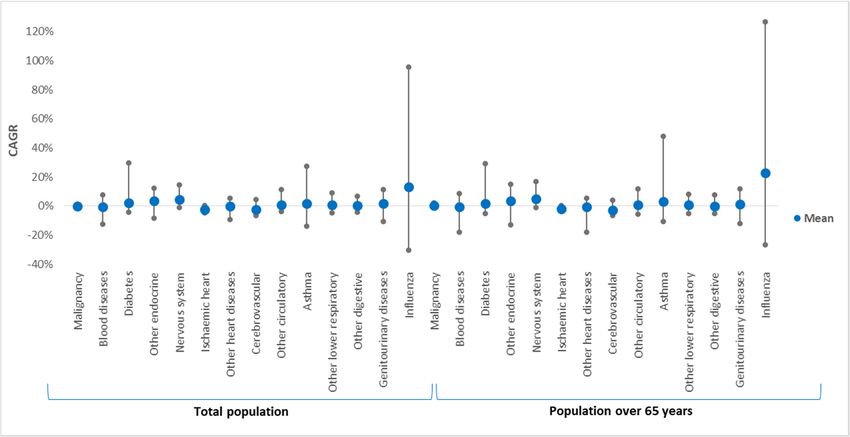
Int. J. Environ. Res. Public Health 2020, 17, 6565 4 of 19
Share of death2016 (1/5)
CAGR = − 1
Share of death2011
We further used them to apply a tree clustering algorithm to identify similarities and differences
between EU countries based on two data sets, without knowing a priori the belonging of countries to
these clusters:
(1) thirteen COVID-19 comorbidity SODs and their corresponding annual growth rates, for the total
population and the population aged 65, and
(2) influenza SODs and their corresponding annual growth rates, for the total population and the
population aged 65.
The tree classification implemented in a C&RT (Classification and Regression Tree) framework [26]
iteratively builds the clusters and provides a heat map of the resulting clusters based on the values of
the variables included in the analysis, i.e., SODs and their corresponding CAGRs. Thus, we found
the distribution of EU countries in clusters by taking into account the importance of COVID-19
comorbidities as SOD, which further allows us to draw the map of EU in terms of populations’
vulnerabilities to COVID-19 comorbidities. Moreover, we applied the same clustering algorithm to
influenza SOD and CAGR and further contrasted the results with COVID-19 impact across EU countries.
The algorithm uses Euclidean distances and Ward’s amalgamation method for identifying clusters.
These are two frequently used parameters of statistical clustering algorithms. The Euclidean distance
was calculated as the geometric distance between variables x and y in a multidimensional space:
X 2 1/2
Distance(x, y) = xi − yi
i
where i designates the case for which the distance is calculated. Ward’s method of amalgamation uses
an analysis of variance (ANOVA) approach to assess the distance between the clusters; specifically,
the method minimizes the sum of squares (SS) of any clusters that can be potentially formed at each step
of the algorithm [27,28]. All data have been standardized before applying the tree clustering algorithm.
The optimal number of clusters for each data set was determined by observing the dendrogram
resulting from iterative clustering and by using the Pseudo F Index [29]. The Pseudo F statistic is the
ratio of between-cluster variance to within cluster variance:
GSS/(k − 1)
Pseudo F =
WSS/(n − k)
where n is the number of observations, k is the number of clusters formed at any step in the hierarchical
clustering, GSS designates the between-group sum of squares, and WSS represents the within group
sum of squares. This is one of the best techniques for determining the optimal number of clusters in a
dataset and is widely used in healthcare research [30].
3. Results
In the EU, NCDs had impressive shares of death between 2011–2016, particularly for diseases of
the circulatory system (39%), malignancy (27%), and diseases of the respiratory system (8%), but with
rather wide variations between countries (Figure 1A,B). Eastern countries recorded 53% SOD for
circulatory system diseases compared to their Western counterparts (36%) but lower SOD for malignant
neoplasms (24% against 29%). Some countries recorded soaring SOD values for the first two most
important comorbidities: circulatory system diseases in Bulgaria (66.24%) and Romania (59.51%),
and malignancy in Slovenia (31.41%) and the Netherlands (30.86%).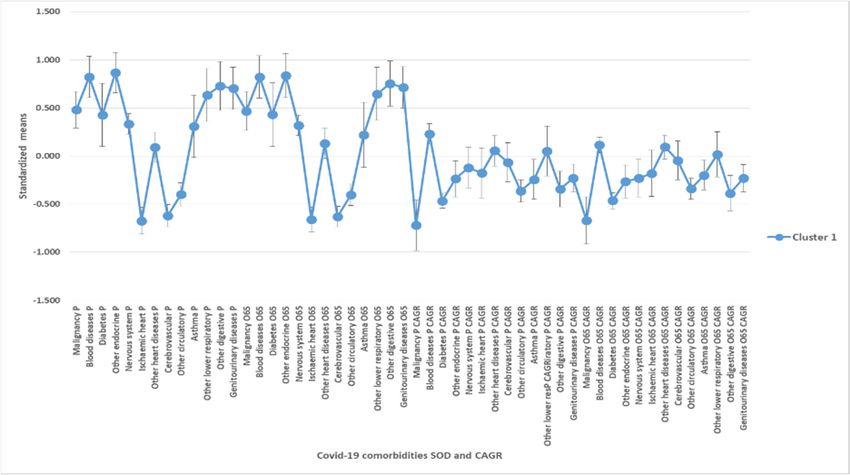
Int. J. Environ. Res. Public Health 2020, 17, x FOR PEER REVIEW                                                      5 of 20
Int. J. Environ. Res. Public Health 2020, 17, 6565                                                                  5 of 19

                  (A) Causes of death in the EU (percentage of total deaths)—mean of 2011–2016.

  (B) Distribution of the shares of death for the main three diseases across EU countries (2011–2016 means).
      Figure
       Figure1.1.Causes
                  Causesof death in the
                           of death  in European  Union,
                                        the European      2011–2016.
                                                        Union,        (1) Noncommunicable
                                                               2011–2016.                   diseases held
                                                                             (1) Noncommunicable          high shares
                                                                                                      diseases   held
      of death in the EU between 2011–2016, mostly for diseases of the circulatory system (39%), malignancy (27%),
       high shares of death in the EU between 2011–2016, mostly for diseases of the circulatory system (39%),
      and diseases of the respiratory system (8%). Eastern countries recorded 53% share of death (SOD) for circulatory
       malignancy (27%), and diseases of the respiratory system (8%). Eastern countries recorded 53% share
      system diseases compared to their Western counterparts (36%) but lower SOD for malignant neoplasms (24%
      of death (SOD) for circulatory system diseases compared to their Western counterparts (36%) but
      lower SOD for malignant neoplasms (24% against 29%). (2) Causes of death for all European Union
      countries were collected from the Eurostat and European Mortality Database, according to the codes of
      the International Classification of Diseases, 10th Revision (ICD-10). They cover all ages and genders,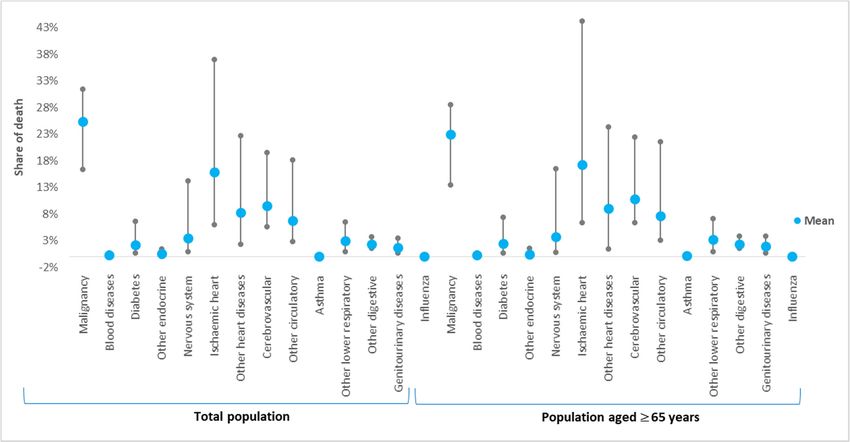
Int. J. Environ. Res. Public Health 2020, 17, 6565                                                             6 of 19

      on a population of 507,070,197 persons (mean of 2011–2016). The mean annual number of deaths
      in the European Union for all causes (except injury, poisoning, and certain other consequences of
      external causes (S00–T98)) is 5,590,916 people. There were 28 European member countries at the end of
      2016, divided into two groups: the Western group (17 countries: Austria, Belgium, Cyprus, Denmark,
      Finland, France, Germany, Greece, Ireland, Italy, Luxembourg, Malta, Netherlands, Portugal, Spain,
      Sweden, and United Kingdom), with an average population between 2011 and 2016 of 403,478,671
      persons, and the Eastern group (11 countries: Bulgaria, Croatia, Czechia, Estonia, Hungary, Latvia,
      Lithuania, Poland, Romania, Slovakia, and Slovenia), with an average population between 2011 and
      2016 of 103,591,526 persons. Panel A presents the distribution of causes of death among all EU countries,
      in Western EU countries, and in Eastern EU countries (from left to right). Panel B shows the distribution
      of the leading three causes of deaths as a percentage of the total number of deaths (all age groups and
      all genders) across the 28 EU countries. (3) Share of death represents the percentage of deaths attributed
      to a specific cause of death in the total number of deaths (measured in %).

3.1. COVID-19 Comorbidities—Data Description
      Of the 13 studied comorbidities, the SODs were above 5% for malignancy, ischemic heart diseases,
other heart diseases, cerebrovascular diseases, and other circulatory diseases, for both population
categories. Malignancy had the highest SOD across EU populations, with means of 25.39% (p < 0.05)
for the total population and 22.98% (p < 0.05) for the population over 65, followed by ischemic heart
diseases (means of 15.86% (p > 0.05) for the total population and 17.31% (p > 0.05) for population
above 65 years) (Table 2). The t-test statistic applied to dependent samples for each disease in the
total population and the population over 65 has shown that SOD means are statistically significantly
different between the total population and the population aged over 65 years for 10 out of the 13
COVID-19 comorbidities as well as for influenza. The exceptions were blood diseases, nervous system
diseases, and asthma.
      Comorbidities with low SOD were asthma (0.13% (p < 0.05) and 0.14% (p > 0.05)) and other
endocrine diseases (0.55% (p > 0.05) and 0.51% (p > 0.05)). Generally, SODs for COVID-19 comorbidities
were higher as mean and median in the population aged 65. Cerebrovascular diseases, other circulatory
diseases, and other lower respiratory diseases have shown higher SODs for the population aged 65
for all 28 EU countries, and 27/28 countries had higher SODs for blood diseases and genitourinary
diseases in the population aged 65. All countries had higher malignancy SODs for the total population
compared to the population aged 65.
      SOD variance ranking across countries was similar between the two categories of population
(Figure 2A). SOD variabilities for ischemic heart diseases, other heart diseases, and other circulatory
diseases were the highest across EU countries (Table 2 and Figure 2A). Asthma and blood diseases had
the lowest variability.
      The growth rate of comorbidities’ SODs (CAGRs) varied between countries and comorbidities
(Table 3 and Figure 2B). Three diseases have shown, on average, a decline in SOD for both population
categories: cerebrovascular diseases (−2.406% (p > 0.05) and −2.890% (p > 0.05)), ischemic heart
diseases (−2.324% (p > 0.05) and −2.044% (p > 0.05)), and blood diseases (−0.356% (p > 0.05) and
−0.615% (p > 0.05)). The remaining ten comorbidities had, on average, increasing SODs; the highest
was for other endocrine diseases (3.489% (p > 0.05) and 3.689% (p > 0.05)). For asthma, nervous
system diseases, malignancy, ischemic heart diseases, and other endocrine diseases, SOD mean and
median growth rates in the total population were higher than the growth rate for the population
over 65 years. The t-test statistic applied to dependent samples has shown that CAGR means were
statistically significantly different between the total population and the population aged over 65 years
for 8 out of the 13 COVID-19 comorbidities and for influenza. The exceptions were other endocrine
diseases, other heart diseases, asthma, other digestive diseases, and genitourinary diseases.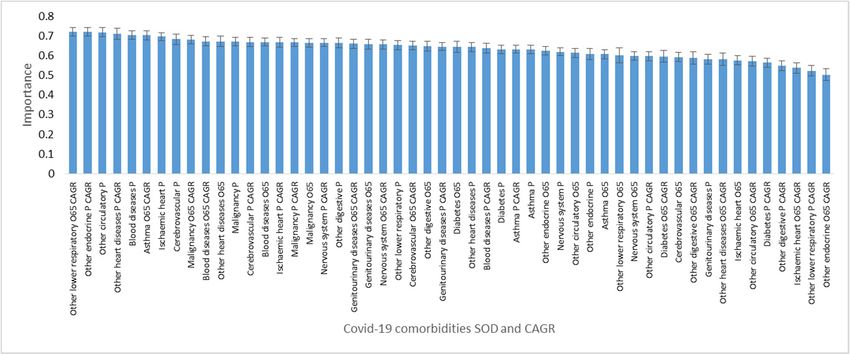
Int. J. Environ. Res. Public Health 2020, 17, 6565                                                                                         7 of 19
     Int. J. Environ. Res. Public Health 2020, 17, x FOR PEER REVIEW                                                                   7 of 20

      (A) Variability of COVID-19 comorbidity SODs across EU countries for the total population and the population aged
      65 (percentages), average 2011–2016.

      (B) Variability of COVID-19 comorbidity SOD annual compound growth rates (CAGRs) across EU countries for the
      total population and the population aged 65 (average 2011–2016).

           Figure 2. Variability of 13 COVID-19 comorbidities and influenza shares of death (SODs) and compound annual
      Figure 2. Variability of 13 COVID-19 comorbidities and influenza shares of death (SODs) and compound
          growth rates between 2011 and 2016 (CAGR) across 28 European Union countries and for two population
      annual    growth rates between 2011 and 2016 (CAGR) across 28 European Union countries and for
          categories: the total population and the population aged above 65 years. (A) (1) Share of death represents the
      twopercentage
            population      categories:
                       of deaths            the
                                   attributed  to total  population
                                                  a specific            and in
                                                             cause of death    the
                                                                                 thepopulation
                                                                                      total numberaged      above
                                                                                                     of deaths        65 years.
                                                                                                                 (measured   in %).(A)(2) (1)
      Share
          Theoft-test
                 death   represents
                      statistic  appliedthe   percentage
                                          to dependent       of deaths
                                                          samples         attributed
                                                                    has shown            to a specific
                                                                                   that SOD    means are cause    of death
                                                                                                            statistically     in the total
                                                                                                                          significantly
          different
      number         between(measured
                of deaths       total population
                                            in %).and(2) population  aged ≥ 65applied
                                                         The t-test statistic      years for
                                                                                           to10  out of the samples
                                                                                              dependent       13 coronavirus    diseasethat
                                                                                                                         has shown
      SOD (COVID-19)
             means arecomorbidities
                           statisticallyand    for influenza
                                           significantly       (p < 0.05).
                                                            different       The exceptions
                                                                       between                are blood and
                                                                                    total population      diseases,   nervous aged
                                                                                                                population      system  ≥ 65
          diseases, and asthma (p > 0.05). (B) (1) SOD variabilities for ischemic heart diseases, other heart diseases, and
      years for 10 out of the 13 coronavirus disease (COVID-19) comorbidities and for influenza (p < 0.05).
          other circulatory diseases were the highest across EU countries, while asthma and blood diseases had the lowest
      The exceptions are blood diseases, nervous system diseases, and asthma (p > 0.05). (B) (1) SOD
          variability. The growth rate of comorbidities’ SOD (CAGR) varied between countries and comorbidities; only
      variabilities   for have
          three diseases   ischemic     heart
                                 seen, on      diseases,
                                          average,          other
                                                     a decline     heart
                                                               in SOD  fordiseases,     and other
                                                                            both population          circulatory
                                                                                              categories:            diseases
                                                                                                           cerebrovascular       were the
                                                                                                                              diseases,
      highest
          ischemic heart diseases, and blood diseases. (2) Compound annual growth rate (CAGR) representsgrowth
                across   EU   countries,    while    asthma    and  blood    diseases    had   the  lowest   variability.    The     the
      ratecompound
            of comorbidities’      SOD rate
                       annual growth      (CAGR)      varied
                                               in shares       between
                                                          of death  betweencountries
                                                                                2011 and and   comorbidities;
                                                                                            2011.                  only three
                                                                                                  (3) The t-test statistic       diseases
                                                                                                                            applied    to
          dependent    samples    has  shown    that  CAGR    means   are  statistically significantly
      have seen, on average, a decline in SOD for both population categories: cerebrovascular diseases, different   between   the  total
      ischemic heart diseases, and blood diseases. (2) Compound annual growth rate (CAGR) represents the
      compound annual growth rate in shares of death between 2011 and 2011. (3) The t-test statistic applied
      to dependent samples has shown that CAGR means are statistically significantly different between
      the total population and the population aged ≥ 65 years for 8 out of the 13 COVID-19 comorbidities
      and for influenza (p < 0.05). The exceptions are other endocrine diseases, other heart diseases, asthma,
      other digestive diseases, and genitourinary diseases (p > 0.05).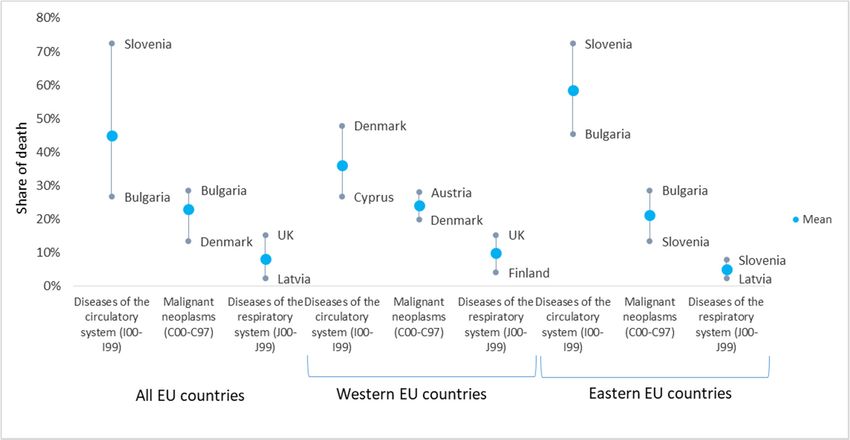
Int. J. Environ. Res. Public Health 2020, 17, 6565                                                                                                                                               8 of 19

            Table 2. Descriptive statistics of COVID-19 comorbidities shares of death for 28 countries in the European Union—an average of 2011–2016 (percentages).

                                                                Total Population                                                                    Population Aged 65
           Diseases
                                  Mean       Median   Minimum      Maximum         SE of Mean    IQR     Std.Dev.   Mean      Median     Minimum       Maximum       SE of Mean     IQR      Std.Dev.
         Malignancy               25.391     25.491    16.424        31.410          0.643      3.176      3.400    22.983     23.105      13.439        28.534          0.650      3.384     3.441
        Blood diseases             0.263     0.228     0.054          0.705          0.031      0.240      0.165    0.264      0.219       0.043          0.710          0.033      0.265     0.176
            Diabetes              2.246       1.974     0.741         6.595          0.236      1.247      1.247     2.411      2.128      0.749          7.402          0.265      1.388     1.405
       Other endocrine             0.553     0.462     0.037          1.506          0.080      0.659      0.425    0.512      0.387       0.027          1.600          0.084      0.652     0.443
       Nervous system              3.530     3.125     0.975         14.281          0.491      2.835      2.600    3.692      3.198       0.887         16.486          0.576      3.202     3.049
       Ischaemic heart            15.863     13.266     5.987        36.983          1.505      12.545     7.962    17.311     13.792      6.363         44.269          1.831      14.591    9.686
     Other heart diseases          8.354      7.638     2.289        22.696          0.818       5.438     4.326     9.114      8.323      1.473         24.385          0.942      6.503     4.983
       Cerebrovascular             9.556      8.427     5.673        19.613          0.729      4.416      3.857    10.876      9.528       6.394        22.423          0.877      5.062     4.643
       Other circulatory           6.770     5.439     2.862         18.131          0.739      3.363      3.911    7.645      5.908       3.080         21.550          0.907      3.959     4.799
            Asthma                 0.132      0.120     0.015         0.320          0.012      0.057      0.064     0.136      0.121      0.014          0.378          0.014      0.052     0.074
    Other lower respiratory        2.980      2.671     0.933         6.565          0.265      1.806      1.404     3.266      2.901       0.966         7.190          0.290      1.989     1.535
       Other digestive             2.338      2.348     1.630         3.700          0.098      0.721      0.518     2.396      2.384       1.527         3.899          0.113      0.834     0.600
    Genitourinary diseases         1.751      1.658     0.642         3.424          0.134      1.026      0.711     1.989      1.960       0.732         3.888          0.155      1.299     0.820
           Influenza               0.072      0.059    0.009          0.181          0.009      0.060      0.048    0.065      0.050       0.004          0.178          0.010      0.061     0.052
      Notes. (1) Bold figures indicate statistically significant means at 5% (p-value < 0.05). (2) Causes of death for all European Union countries were collected from the Eurostat and European
      Mortality Database, according to the codes of the International Classification of Diseases, 10th Revision (ICD-10). They cover all ages and genders, on a population of 507,070,197 persons
      (mean of 2011–2016). The mean annual total number of deaths (total population) in the European Union for all causes (except injury, poisoning, and certain other consequences of external
      causes (S00–T98)) is 5,590,916 people. The mean annual number of deaths (2011–2016) in the population above 65 years was 4,132,253. (3) The t-test statistic applied to differences in means
      for each disease for the total population compared to the population aged ≥ 65 years has shown that SOD means are statistically significantly different for 10 out of the 13 COVID-19
      comorbidities and for influenza (p < 0.05). The exceptions are blood diseases, nervous system diseases, and asthma (p > 0.05). The t-test was applied for dependent samples.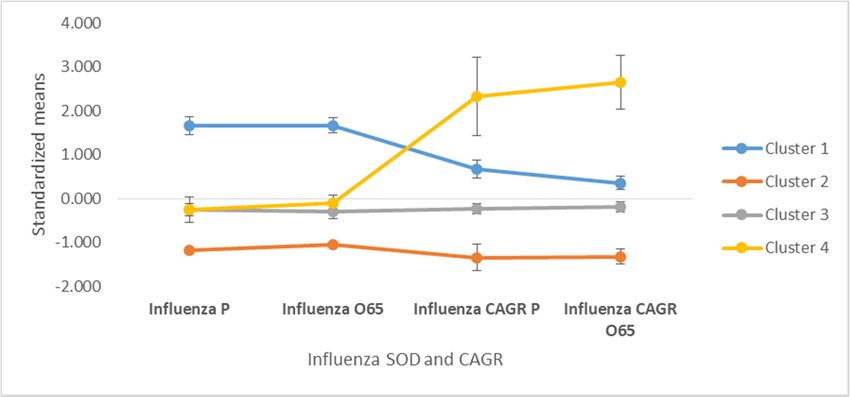
Int. J. Environ. Res. Public Health 2020, 17, 6565                                                                                                                                              9 of 19

              Table 3. Descriptive statistics of COVID-19 comorbidity SOD CAGRs for 28 countries in the European Union—an average of 2011–2016 (percentages).

                                                                Total Population                                                                   Population Aged 65
           Diseases
                                  Mean       Median   Minimum      Maximum         SE of Mean   IQR      Std.Dev.   Mean     Median     Minimum       Maximum       SE of Mean     IQR     Std.Dev.
         Malignancy               0.123       0.238   −0.873          1.434          0.123      1.093     0.653      0.406     0.553     −0.845          2.224          0.175     1.415      0.925
        Blood diseases            −0.356      0.306   −12.237        7.891           0.867      4.684     4.587     −0.615    0.093      −17.871         8.631          1.190     6.015      6.296
            Diabetes              2.101       0.704   −4.231         29.480          1.190      3.338     6.295      1.868     0.602     −4.934         29.287          1.205     3.876      6.375
       Other endocrine             3.489     3.091    −8.126         12.368          0.947      7.234     5.014      3.689     3.716     −13.003        14.980          1.156     6.427      6.117
       Nervous system              4.564     4.109    −0.958         14.782          0.654      4.533     3.460      5.189     4.437     −0.887         17.092          0.848     5.096      4.487
       Ischaemic heart            −2.324     −2.538   −4.490          0.550          0.286      2.746     1.512     −2.044    −2.211     −3.902          0.471          0.234     1.968      1.237
     Other heart diseases         0.103       0.483   −9.167          5.511          0.686      3.956     3.628     −0.487    0.133      −17.935         5.391          0.899     3.699      4.759
       Cerebrovascular            −2.406     −2.374   −6.396          4.352          0.415      2.751     2.198     −2.890    −2.775     −6.635          4.117          0.427     2.659      2.259
       Other circulatory           1.033     0.760    −3.568         11.220          0.562      2.709     2.975      0.717     0.362     −5.603         11.710          0.628     3.110      3.325
            Asthma                 1.569     0.715    −13.648        27.244          1.542      5.207     8.157      2.940     0.861     −10.800        47.750          2.239     6.046      11.845
    Other lower respiratory        0.979     1.140    −4.496          8.991          0.553      3.114     2.925      0.624     0.770     −5.150          8.017          0.582     3.254      3.079
       Other digestive            0.240       0.155   −4.299          6.736          0.473      2.769     2.501      0.109    −0.259     −5.104          7.863          0.543     3.172      2.871
    Genitourinary diseases         1.582      2.098   −10.691        11.418          0.919      6.527     4.865      1.469    1.962      −12.027         11.895         0.988      6.993      5.226
           Influenza              13.136     11.272   −30.435        95.694          4.929      28.678    25.613    22.740    23.493     −26.633        126.523         6.101     33.284     31.702
      Notes. (1) Causes of death for all European Union countries were collected from the Eurostat and European Mortality Database, according to the codes of the International Classification of
      Diseases, 10th Revision (ICD-10). They cover all ages and genders, on a population of 507,070,197 persons (mean of 2011–2016). The mean annual total number of deaths (total population)
      in the European Union for all causes (except injury, poisoning, and certain other consequences of external causes (S00–T98)) is 5,590,916 people. The mean annual number of deaths
      (2011–2016) in the population above 65 years was 4,132,253. (2) The t-test statistic applied to differences in means for each disease for the total population compared to the population
      aged ≥ 65 years has shown that CAGR means are statistically significantly different for 8 out of the 13 COVID-19 comorbidities and for influenza (p < 0.05). The exceptions are other
      endocrine diseases, other heart diseases, asthma, other digestive diseases, and genitourinary diseases (p > 0.05). The t-test was applied for dependent samples.
Int. J. Environ. Res. Public Health 2020, 17, 6565 10 of 19
Asthma had the highest SOD growth rate in both population sets in Greece (27.24% and 46.75%),
and diabetes had the highest in Malta (29.84% and 29.29%). Greece also had a very high CAGR in
both population categories for nervous system disease SOD (14.78% and 17.09%) and other circulatory
diseases (11.22% and 11.71%). Czechia recorded the highest CAGR for other endocrine diseases SOD
for the total population, and Poland had the highest for the population aged 65. Several countries
have shown substantial progress in managing these diseases, as their SOD between 2011 and 2016
has declined. Blood diseases’ SOD had the highest negative CAGR for Slovakia (−12.24% for the total
population and −17.87% for the population above 65 years), and asthma SOD had the highest negative
growth rate for Luxembourg (−13.64% and −10.8%). Overall, eastern EU countries have recorded
higher mean CAGRs for 10/13 SODs in the total population and 11/13 SODs in the population above
65 years.
3.2. Influenza—Data Description
The mean SODs for influenza across EU countries were low, 0.0725% (p < 0.05) for the general
population and 0.065% (p < 0.05) for the population aged 65 years, but the medians were smaller for
both populations. Sweden recorded the highest influenza SOD (0.18% and 0.17%), and Romania had
the lowest (0.009% and 0.004).
The mean influenza SOD growth rates in the EU were 13.13% (p < 0.05) for the total population
and 22.73% (p < 0.05) for the population aged 65 years; 20/27 countries recorded positive growth rates
of influenza SOD for the total population, and 21/27 countries recorded positive growth rates for the
population aged 65. Slovenia had the highest growth rate for both populations: 95.69% and 126.52%,
respectively. Seven countries have decreased influenza SOD for their total population, and six countries
had decreases for the population aged 65. Cyprus is an interesting case, as influenza SOD for the total
population declined (−13.57% CAGR) but that for the population aged 65 increased (7.31% CAGR).
Although influenza SOD was generally higher for the total population compared to the population
aged 65 in most EU countries (except Belgium, France, Luxembourg, and Slovenia), the growth rate
of influenza SOD for the population aged 65 was higher for 23/27 EU countries (except for Bulgaria,
Czechia, Latvia, and Luxembourg).
3.3. Results of Tree Clustering Algorithms
3.3.1. Clusters Based on COVID-19 Comorbidity SOD and CAGR
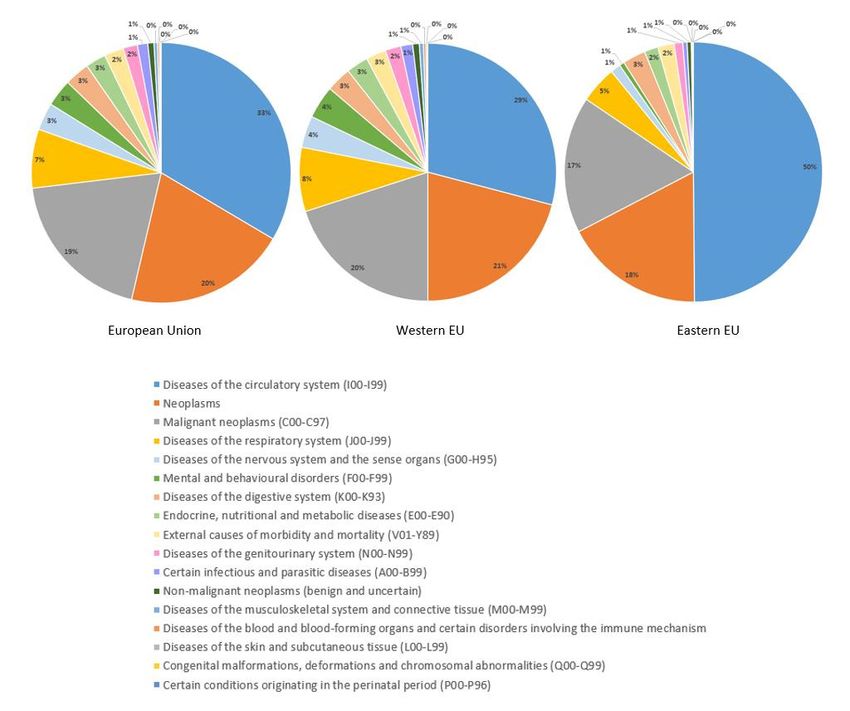
Our tree clustering algorithm indicated the presence of two clusters (Figure 3A). The first cluster
included 13 western EU countries, and the second cluster was formed of 11 eastern countries and
4 western countries (Sweden, Malta, Finland, and Greece). These two clusters were clearly differenced
by their attributes (Figure 3B). The first cluster showed higher SODs for all diseases, compared to
the second cluster, except for ischemic heart, cerebrovascular diseases, and other circulatory diseases.
Countries in the first cluster had lower growth rates of disease SOD, except for blood diseases,
other heart diseases, and other lower respiratory diseases, for both population sets.
In the first half of the amalgamation schedule, the majority of country pairs were between western
countries (Ireland–United Kingdom, Germany–Italy, and Belgium–France), suggesting stronger
similarities between them compared to eastern countries. This result has confirmed that disease SOD
patterns were significantly different in the two parts of the EU.
Overall, SODs were more important than their CAGRs for country assignments to clusters
(Figure 3C). The highest power of differentiation between western and eastern EU countries came from
diseases with high CAGRs among the elderly population: other lower respiratory diseases, asthma,
malignancy, and blood diseases. They were accompanied by other endocrine diseases’ CAGR in the
total population and SOD in the total population for other circulatory diseases, ischemic heart, blood
diseases, and other circulatory diseases.Int.Int. J. Environ.
J. Environ. Res.Public
Res. PublicHealth
Health2020,
2020,17,
17, 6565
x FOR PEER REVIEW 12 of
1120
of 19
(A) Heat map and tree clusters dendrogram for COVID-19 comorbidities in EU countries.
(B) Standardized means for clusters of EU countries based on COVID-19 comorbidities.
Figure 3. Cont.Int. J. Environ. Res.
Res. Public
Public Health
Health 2020, 17, x6565
2020, 17, FOR PEER REVIEW 12
13 of 19
20
(C) Variable importance in COVID-19 comorbidities’ amalgamation.
Figure 3. Results
Resultsofoftree
tree clustering
clustering of of
COVID-19
COVID-19 comorbidities
comorbidities for 28
forEuropean
28 European Union countries:
Union heat
countries:
maps, cluster attributes, and variable importance. Tree clustering results are based on
heat maps, cluster attributes, and variable importance. Tree clustering results are based on Euclidian
distances and the Ward’s
Ward’s amalgamation
amalgamation method applied on shares of death death (SOD)
(SOD) and compoundcompound
annual growth rates (CAGR)
(CAGR) for for all 28 EU countries, on mean values between between 2011 2011 and
and 2016.
2016. Panel A
depicts on the left the heat map map of of EU
EU countries
countries inin terms
terms of of SOD
SOD and and CAGR—greener
CAGR—greener cells indicate indicate
lower standardized values, and darker red cells indicate higher standardized values—for each of the
13 COVID-19
COVID-19 comorbidities. Areas Areas of of the
the heat
heat map
map coloured
coloured in in green
green indicate
indicate lower
lower vulnerability,
and areas coloured in red indicate higher vulnerability to diseases, measured measured in in SOD
SOD and/or
and/or CAGR.
CAGR.
The right side
side of
ofthe
thepanel
panelshowsshowsthe thedendrogram
dendrogram ofof countries’
countries’ distributions
distributions in clusters
in clusters basedbased on
on the
the linkage distance (the distance between clusters’ members). Panel
linkage distance (the distance between clusters’ members). Panel B presents the standardized (or B presents the standardized
(or normalized
normalized means,
means, i.e.,i.e.,
meansmeans onon adjusted
adjusted valuestotoscale)
values scale)ofofclustering
clusteringvariables
variables (SOD(SOD and CAGR
for
for the
the13
13COVID-19
COVID-19comorbidities)
comorbidities) forfor
thethe
twotwostatistically significant
statistically clusters
significant and the
clusters anderror
the bars
errorbased
bars
on standard
based error. error.
on standard Cluster 1 has 113has
Cluster members, and cluster
13 members, 2 has215
and cluster hasmembers.
15 members. Panel C presents
Panel the
C presents
variables’ importance for predicting cluster membership via the C&RT/boosted
the variables’ importance for predicting cluster membership via the C&RT/boosted tree algorithm, tree algorithm, based on
100 repeatedly drawn samples via bootstrapping. The closer to 1 the variable
based on 100 repeatedly drawn samples via bootstrapping. The closer to 1 the variable is, the higheris, the higher its importance
for countries’ inclusion
its importance in one of
for countries’ the two in
inclusion clusters.
one of Error
the twobarsclusters.
in panelErrorC are bars
basedinon standard
panel C aredeviations
based on
of variabledeviations
standard importance. of There
variableare importance.
two clusters of EU countries
There based onof
are two clusters their
EUpopulations’
countries based vulnerability
on their
to COVID-19 comorbidities: cluster 1 includes 13 western EU countries,
populations’ vulnerability to COVID-19 comorbidities: cluster 1 includes 13 western EU countries, and cluster 2 includes 11
eastern countries and 4 western countries (Sweden, Malta, Finland, and
and cluster 2 includes 11 eastern countries and 4 western countries (Sweden, Malta, Finland, and Greece). Countries in cluster
1Greece).
have higher SOD of
Countries in all diseases
cluster thanhigher
1 have clusterSOD
2, except
of all for ischemic
diseases than heart, cerebrovascular
cluster 2, except for diseases,
ischemic
and other circulatory diseases, but lower growth rates of diseases
heart, cerebrovascular diseases, and other circulatory diseases, but lower growth SOD, except forrates
blood of diseases,
diseases
other
SOD, except for blood diseases, other heart diseases, and other lower respiratory diseases, forSODs
heart diseases, and other lower respiratory diseases, for both population sets. Overall, both
were more important
population thanSODs
sets. Overall, their CAGR
were more for countries’
importantassignments
than their CAGRto clusters, but the highest
for countries’ power of
assignments to
differentiation
clusters, but thebetween
highestwestern
power and eastern EU countries
of differentiation between belongs
western to and
diseases withEU
eastern high CAGRsbelongs
countries among
the elderly population.
to diseases with high CAGRs among the elderly population.
3.3.2. Clusters of Influenza SOD and CAGR
3.3.2. Clusters of Influenza SOD and CAGR
There were four clusters based upon influenza SOD and CAGR (Figure 4). Cluster 1 included
There were four clusters based upon influenza SOD and CAGR (Figure 4). Cluster 1 included 5
5 western countries (Belgium, France, Netherlands, Finland, and Sweden), with the highest influenza
western countries (Belgium, France, Netherlands, Finland, and Sweden), with the highest influenza
SOD and second-highest CAGR of influenza SOD, for both population sets. The second cluster included
SOD and second-highest CAGR of influenza SOD, for both population sets. The second cluster
three eastern countries (Bulgaria, Hungary, and Slovakia), with the lowest influenza SOD and CAGR
included three eastern countries (Bulgaria, Hungary, and Slovakia), with the lowest influenza SOD
for both population categories. Cluster 3 consisted of the remaining countries, except for Slovenia and
and CAGR for both population categories. Cluster 3 consisted of the remaining countries, except for
Ireland, with low influenza SOD but very high SOD growth rate, which are highly dissimilar to the
Slovenia and Ireland, with low influenza SOD but very high SOD growth rate, which are highly
other EU countries (cluster 4). Cluster 3 was the “average” cluster, with the second-lowest influenza
dissimilar to the other EU countries (cluster 4). Cluster 3 was the “average” cluster, with the second-
SOD and CAGR, formed of 10 eastern and 7 western countries; see Figure 4A,B.
lowest influenza SOD and CAGR, formed of 10 eastern and 7 western countries; see Figure 4A,B.
In the first half of the amalgamation schedule, we found six pairs of western countries, three pairs
In the first half of the amalgamation schedule, we found six pairs of western countries, three
of eastern countries, and four mixed pairs of western–eastern countries. The highest similarity was
pairs of eastern countries, and four mixed pairs of western–eastern countries. The highest similarity
recorded for Hungary–Slovakia, and the highest dissimilarity was recorded for Belgium and Bulgaria.
was recorded for Hungary–Slovakia, and the highest dissimilarity was recorded for Belgium and
Bulgaria. Of the four clustering variables, influenza SOD and CAGR for the population above 65
years have slightly higher predictive power for countries’ assignments into clusters (Figure 4C).Int. J. Environ. Res. Public Health 2020, 17, 6565 13 of 19
Of the four clustering variables, influenza SOD and CAGR for the population above 65 years
Int. J. Environ. Res. Public Health 2020, 17, x FOR PEER REVIEW
have
14 of 20
slightly higher predictive power for countries’ assignments into clusters (Figure 4C).
(A) Heat map and tree clusters dendrogram for influenza in EU countries.
(B) Standardized means for clusters of EU countries based on influenza SOD and CAGR.
(C) Variable importance in influenza amalgamation.
Figure
Figure 4. Results
4. Results of of C&RT
C&RT tree
tree clusteringof
clustering ofinfluenza
influenza for
for 28
28European
EuropeanUnion
Union countries: heatheat
countries: maps,
maps,
cluster attributes, and variable importance. (1) Tree clustering results are based on Euclidian distances
cluster attributes, and variable importance. (1) Tree clustering results are based on Euclidian distances
and and the Ward’s amalgamation method applied on shares of death (SOD) and compound annual
the Ward’s amalgamation method applied on shares of death (SOD) and compound annual growthInt. J. Environ. Res. Public Health 2020, 17, 6565 14 of 19
rates (CAGR) for 27 EU countries (Malta was excluded due to lack of data availability) on mean
values between 2011 and 2016. Panel A depicts on the left the heat map of EU countries in terms
of SOD and CAGR—greener cells indicate lower standardized values, and darker red cells indicate
higher standardized values—for influenza. Areas of the heat map coloured in green indicate lower
vulnerability, and areas coloured in red indicate higher vulnerability to diseases, measured in SOD
and/or CAGR. The right side of the panel shows the dendrogram of countries’ distribution in clusters
based on the linkage distance (the distance between cluster members). Panel B presents the standardized
(or normalized means, i.e., means on adjusted values to scale) of clustering variables (SOD and CAGR
for influenza) for the two statistically significant clusters and the error bars based on standard errors.
Cluster 1 includes 5 members, cluster 2 includes 3 members, cluster 3 includes 17 members, and cluster
4 has 2 members. Panel C presents the variables’ importance for predicting cluster membership via the
C&RT/boosted tree algorithm, based on 100 repeatedly drawn samples via bootstrapping. The closer to
1 the variable is, the higher its importance for countries’ inclusion in one of the two clusters. Error bars
in Panel C are based on standard deviations of variable importance. (2) There are four clusters based
upon influenza SOD and CAGR. Cluster 1 includes 5 western countries, with the highest influenza
SOD and second-highest CAGR of influenza SOD, for both population sets. Cluster 2 includes 3 eastern
countries, with the lowest influenza SOD and CAGR for both population categories. Cluster 3 includes
17 countries, except for Slovenia and Ireland, with low influenza SOD but very high SOD growth rate,
which belong to cluster 4. Of the four clustering variables, influenza SOD and CAGR for the population
above 65 years have slightly higher predictive power for countries’ assignments into clusters.
4. Discussion
Our study shows that EU countries display different health patterns and even country-specific
patterns in eastern versus western countries. In eastern countries, populations die mostly of circulatory
system diseases, and in Western countries, populations die mostly of malignancy. In eastern countries,
incidence of circulatory disease is higher, and in Western countries, incidence of malignancy is higher.
We demonstrate that disease SOD in EU populations is heterogeneous. Western, more developed EU
countries had higher SOD for almost all comorbidities compared to eastern, less developed countries.
Still, their growth rate in eastern EU is higher compared to the western EU. This indicates a higher
vulnerability of the EU’s western populations to the COVID-19 pandemic. Significant differences
between eastern and western European countries have been demonstrated since five decades ago,
regarding death rates, prevalence of comorbidities, and life expectancy [31]. After the creation of the
European Economic Community in 1957 and its further expansion, culminating with the European
Union established in 1992, one would have expected these differences to fade and to lose strength
as a result of economic convergence policies. Still, the average life expectancy is higher in western
Europe compared to its eastern part (82.1 against 77.3 years, on average, in 2018), although the western
population became younger and more fertile due to migration of the labour force from east to west.
At the same time, excess mortality due to malignancy can be detected for all age groups above 65 years
in western versus eastern populations. The reverse is true for diseases of the circulatory and respiratory
systems—based on SOD for each age group for the population above 65 years [24].
Except SARS and influenza, most epidemics of the 21st century have taken place outside the
European continent. Nevertheless, specific measures to prevent influenza and the occurrence of severe
forms of these diseases in the general population and the specific vulnerable populations as well as
treatment-directed measures have been taken at the European level [20,32]. For example, EU health
reports indicate that Hungary, Germany, Greece, Iceland, Slovakia, Malta, Poland, and the Netherlands
recommended influenza vaccination for the aged population [11].
Moreover, the comorbidities’ SOD growth rate is higher in the east, so eastern countries are
“recovering” the difference from the west. Grouping countries in clusters considering comorbidities’
SOD and their CAGRs demonstrates the presence of a distinctly different vulnerability to diseasesInt. J. Environ. Res. Public Health 2020, 17, 6565 15 of 19
in eastern versus western EU countries, except for Sweden, Malta, Finland and Greece, which are
included in the eastern category.
The values of excess mortality for malignancy range between 0.28% and 1.57% on average across
populations in the two parts of EU, indicating that western populations are more vulnerable than
eastern populations to malignancy—calculations based on [24]. Although screening policies are better
implemented in western Europe, along with social policies aimed at controlling risk factors and with
treatments and health expenditures holding higher shares in GDP, it seems that they have not led to
the expected mortality by cancer improvements. For example, lung cancer is the leading cause of death
in cancers, and tobacco use is the main risk factor. Joossens et al., in a study based on a questionnaire
in 30 European countries, showed that lung cancer prevalence decreases in the United Kingdom,
Norway, France, and Ireland as a result of tobacco control policies [33]. Also, breast cancer is among
the more prevalent cancers in western European countries, such as Belgium, France, Netherlands,
United Kingdom, and the Nordic countries [34]. Screening policies have been introduced for over
20 years. Substantial progress in diagnosis and management of breast cancer as well as the result of
health policies are noted, but the incidence of breast cancer is higher in western European countries
than in eastern European countries [24].
The excess mortality in Eastern EU for circulatory system diseases ranges between 0.92% and
13.78% (the latter for the 65–69 years age group), showing that older populations in eastern EU are
more vulnerable than their peers in western Europe to these diseases—calculations based on [24].
The excess mortality values for respiratory system diseases are much smaller, ranging between 0.36%
and 0.90% (eastern against western populations above 65 years) [24]. This indicates a slightly higher
vulnerability to these diseases of Eastern EU populations.
Better control of risk factors for cardiovascular disease (sex, age, hypercholesterolemia,
cardiovascular disease, high blood pressure, diabetes, and obesity) as well as the response to health
policies, better prophylaxis, and more effective treatments were obtained in western European countries.
To this, we add policies for screening of cardiovascular diseases and improvements in lifestyle factors
(diet and physical activity) [35].
Across the EU, the population above 65 years has higher and statistically significant SODs for
COVID-19 comorbidities that are critical to patients’ fate, i.e., cardiovascular and circulatory diseases.
At the same time, the SOD means for malignancy and diabetes as well as influenza are statistically
significantly higher in the total population compared to population above 65 years, which might indicate
cloudy prospects for the current younger EU population at older ages. The European map of most
pandemic-threatened aged rural regions [36] is completed by our results that show that EU populations
above 65 years had higher SODs for 11/13 comorbidities in Western countries and 8/13 comorbidities
in Eastern countries when compared to the total population. The growth rates of comorbidities’
SOD identify malignancy and nervous system diseases as having statistically significant higher SOD
increases in the population above 65 years between 2011 and 2016. On the bright side, though, the SOD
for blood and cerebrovascular diseases have decreased at a rapid pace in the population above 65 years
compared to the total population, which signals increased potential vulnerability to communicable
diseases in the current younger population. Also, the growth rate of influenza SOD is higher in the
population over 65 than in the total population, which implies that population aging is a significant
risk factor for COVID-19 deaths, we note that 19.45% of EU populations (19.88% in the west and 17.77%
in the east) were above 65 years in 2017 [24]. This population, with more chronic diseases, is the main
vulnerable category to severe forms of the disease and is prone to amount variation due to differences
in size and structure from younger population cohorts reaching old age.
Far less than expected, influenza SOD and its growth rate are not perfect predictors of COVID-19
death distribution across EU. Clustering shows that 5 Western EU countries included in cluster 1
(Belgium, France, Sweden, the Netherlands, and Finland) have high SOD and CAGR. Belgium, France,
the Netherlands, and Sweden are among the hardest affected countries by the COVID-19 pandemic in
deaths per million inhabitants. Surprisingly, some other most-affected countries, Italy and Spain, areInt. J. Environ. Res. Public Health 2020, 17, 6565 16 of 19
in the “average” cluster 3, which might point towards a possible lack of reaction against COVID-19
spread in the initial stages based on lower previous influenza vulnerability.
5. Conclusions
Our study argues that a possible explanation for the higher COVID-10 mortality in western
compared to eastern EU countries resides in the higher vulnerability of western EU populations to
malignancy in COVID-19 comorbidity that has a higher SOD in these countries. Moreover, the cluster
that includes 14 western countries has higher average malignancy SOD compared to eastern countries
cluster. Worryingly, Europe contained 9% of the world population in 2018 but had a 25% share of
the global cancer burden [24,34]; our study adds here that malignancy SOD is higher for the older
population in all EU countries, which raises serious health alarms across the EU and signals that
this population is at high risk not only from the malignancy burden per se but also from exposure
to communicable diseases. The heat maps of EU countries based on populations’ vulnerability to
COVID-19 through comorbidities could serve as a model for earliest screening of vulnerable populations
(for example, in western EU countries in people with cancer and in eastern countries screening in the
population with cardiovascular diseases). Moreover, clinical surveillance for the rapid detection of
infected and symptomatic patients in vulnerable populations could more quickly select the group to
which applied timely treatment measures are appropriate. Guidelines written in pandemics are of
paramount value, but in emergency situations, the time to adapt them to various comorbidities can be
a decisive factor in saving lives. Judicial hospitalization based on screening for the vulnerable and
infected could more efficiently allocate hospital beds. There is much to be studied, still, about the
relationship between COVID-19 and comorbidities and the implications for increasing mortality in
vulnerable population.
Although the geographical, historical, religious, and cultural boundaries between eastern and
western Europe are hard to delineate, the frontier between east and west for health care system
performances is obvious. EU countries were included in 2020 by the World Bank in the high and
upper-middle-income categories [37]. Nevertheless, grouping countries into a western category
(with more developed and longer-time EU members) and an eastern-located category (including
less developed and later EU members) is more useful, given the different institutional characteristics
between their health systems [38]. This involves understanding optimal resource allocation within
countries, regions, hospitals, and clinics as well as the factors that influence hospital labour and materials
supply (in terms of both quantity and quality). It also means planning adaptive policies to respond
to the exposure of sections of the broader labour force to COVID-19 and potential similar disease
complications. Additionally, economic and socially challenging problems may be avoided by targeting
measures in vulnerable populations associated with reasonable measures in the non-vulnerable
population (cleaning hands more often than usual, wearing face masks, avoiding meetings, etc.). To our
present knowledge, this is the first systematic and statistically enforced proposal towards grasping EU
countries’ vulnerability to comorbidities. Comorbidities’ interconnectedness emphasizes the need for
an integrated approach.
There are some limitations to our approach. First, raw data are lacking or of limited quality in
some countries. Second, although the use of ICD-10 is a long-standing and widely accepted practice,
diseases are complex and often attended by coexisting conditions. Moreover, disease interconnectivity
makes data on shares of deathless reliability of specific illnesses.
In conclusion, the heat maps of Europe’s vulnerability to diseases based on mortality indicators
constitute the basis for more targeted health policy strategies in a collaborative effort at the EU level.
In the contemporary, powerful world of science, understanding countries’ specific comorbidities and
disease patterns may be a compelling strategy against pandemic wars and not only.You can also read