Consumer Food Environment Healthiness Score: Development, Validation, and Testing between Different Types of Food Retailers - MDPI
←
→
Page content transcription
If your browser does not render page correctly, please read the page content below
International Journal of
               Environmental Research
               and Public Health

Article
Consumer Food Environment Healthiness Score: Development,
Validation, and Testing between Different Types
of Food Retailers
Camila Aparecida Borges * , Kamila Tiemann Gabe and Patricia Constante Jaime

                                          Center for Epidemiological Research in Nutrition and Health, Department of Nutrition, Faculty of Public Health,
                                          University of Sao Paulo, Av. Dr. Arnaldo, 715-Cerqueira César, Sao Paulo 01246-904, Brazil;
                                          ktgabe@usp.br (K.T.G.); constant@usp.br (P.C.J.)
                                          * Correspondence: camila.borges@usp.br

                                          Abstract: The aim of this study was to develop and validate a scoring system, based on AUDITNOVA,
                                          to assess the healthiness of the consumer food environment, considering food availability, price,
                                          advertising, and placement strategies. Audited data of 650 food retailers were used to develop,
                                          validate, and test the consumer food environment healthiness score. To compose the score, the
                                          reference was the Dietary Guidelines for the Brazilian Population. The total and subscores were
                                          standardized for a scale from 0 to 100. Construct validity was assessed using the Kruskal–Wallis Dunn
                                          tests. Cronbach’s alpha coefficients were calculated to determine the consistency of the scores. The
                                          median score was 33.7 (p25 = 26.9; p75 = 42.1). The public and private specialized indoor fresh food
                                          markets showed the highest medians; otherwise, bakeries and food retailers with the predominant

                                   sale of ultra-processed foods showed the lowest. The score was able to satisfactorily classify the
Citation: Borges, C.A.; Gabe, K.T.;
                                          extreme food retailer groups by the predominant sale of fresh or minimally processed foods and
Jaime, P.C. Consumer Food                 the predominant sale of ultra-processed foods. The results of Cronbach’s alpha showed excellent
Environment Healthiness Score:            internal consistency (α = 0.91). The score helped to provide an overall assessment of consumer food
Development, Validation, and Testing      environment healthiness and was able to classify food retailer groups as healthy and unhealthy
between Different Types of Food           according to the degree of processing of the available foods.
Retailers. Int. J. Environ. Res. Public
Health 2021, 18, 3690. https://           Keywords: nutrition consumer environment; food retailer; score; healthiness
doi.org/10.3390/ijerph18073690

Academic Editors: Daniel J. Graham
and Paul Ward                             1. Introduction
                                               Access to adequate and healthy food is influenced by socioeconomic, behavioral, and
Received: 27 January 2021
Accepted: 30 March 2021
                                          cultural factors which are influenced by the environment [1]. Different theoretical models
Published: 1 April 2021
                                          on food environment have converged in recognizing its complexity, multidimensionality,
                                          and potential influence on food choices and practices of individuals and collectivity [2–5].
Publisher’s Note: MDPI stays neutral
                                          In this context, the ecological model of Glanz et al. (2005) stands out [3], proposing
with regard to jurisdictional claims in
                                          that health-related behavior and, in particular, eating practices, are influenced by political,
published maps and institutional affil-   environmental, and individual components. According to this model, the food environment
iations.                                  encompasses four aspects: community nutrition environment, organizational nutrition
                                          environment, consumer nutrition environment, and information environment, which, in
                                          turn, are influenced by government policies and the food industry.
                                               The food environment, broadly conceptualized to include any opportunity to obtain
Copyright: © 2021 by the authors.
                                          food [1], is increasingly being recognized as critical to health [5]. Further, also according to
Licensee MDPI, Basel, Switzerland.
                                          Glanz et al. [3], the food environment could be understood as a determinant of nutrition
This article is an open access article
                                          and health outcomes due to the variety of food available at different places (households,
distributed under the terms and           markets, restaurants, and companies) which may be poorer quality depending on the
conditions of the Creative Commons        economic, social, and racial context. Although most research on the food environment has
Attribution (CC BY) license (https://     focused on assessing the community nutrition environment [6,7], the number of studies
creativecommons.org/licenses/by/          investigating the effects of the consumer nutrition environment on health outcomes has
4.0/).                                    also grown [8].

Int. J. Environ. Res. Public Health 2021, 18, 3690. https://doi.org/10.3390/ijerph18073690                      https://www.mdpi.com/journal/ijerph
Int. J. Environ. Res. Public Health 2021, 18, 3690 2 of 14
The term consumer nutrition environment [3] or consumer food environment [1], used
nowadays, is characterized by a set of factors that refer to foods available, such as how they
are supplied or presented (their size, packaging, and portion size), the way they are placed
and/or served, their nutritional quality, labeling, and nutrition claims, as well as their
prices and promotions [3]. Studies have shown that price reductions [9], promotions [10],
healthy food available near the entrance of the store and in cash registers [11,12], variety,
tastings, and offers of free samples [13] have been positive strategies in increasing the
acquisition of foods considered as healthy, such as fruits and vegetables at supermarkets.
The classification of food retailers as more or less healthy has been an important
consideration in tool developed to assess the consumer food environment, such as the
Nutrition Environment Measures Survey in Stores (NEMS-S) [14]; Nutrition Environment
Measures Survey in Restaurants (NEMS-R) [15]; and another study in Australia [16], which
considers, in the development of a scoring system, indicators such as food availability, food
quality, variety, and food price.
In Brazil, assessing the healthiness of food retailers is challenging due to the diversity
among retailers [17], and the lack of audit data on the consumer food environment, which
would allow the inside of the stores to be checked in detail. Borges and Jaime (2019)
developed and validated an audit tool for the consumer food environment–AUDITNOVA—
based on the classification of foods according to the extent and purpose of their processing
(NOVA classification system) [18]. This is an instrument that was innovated by using
NOVA as a technical framework, since this classification also guides the recommendations
of the Dietary Guidelines for the Brazilian Population. Additionally, there is growing
evidence associating the consumption of ultra-processed foods, one of NOVA’s groups,
with negative health outcomes, such as chronic noncommunicable diseases, overweight,
and obesity [19,20].
The creation of a health index for food retailers can contribute to the advancement
of research that shows the relationship among the consumer food environment, obesity,
and other noncommunicable diseases, also supporting the development of public policies
that regulate availability and food advertising in these spaces. AUDITNOVA allows us to
audit the interior of different types of food retailers (grocery/supermarket and convenience
stores, bakeries, butcheries, and others), except restaurants, fast-food restaurants, and bars,
because it does not include specific variables for assessing these groups of retailers [18].
However, there is still no scoring system that classifies food retailers as more or less
healthy from the data collected by AUDITNOVA in Brazil. Evidence shows that food
availability, price, advertising, and placement strategies (special floor displays, end-of-aisle
displays, cash register displays, island bins, and others), influence food purchases [21,22]
and, therefore, should be considered when creating such indicators. Therefore, the present
study aimed to develop and validate a scoring system, based on AUDITNOVA, to assess
the healthiness of the consumer food environment, considering food availability, price,
advertising, and placement strategies.
2. Materials and Methods
2.1. Study Type and Location
This is a methodological study that aimed to develop and validate a scoring system to
assess the healthiness of the consumer food environment, considering different types of food
retailers and indicators, such as availability, price, advertising, and placement strategies.
The study was approved by the Research Ethics Committee of the School of Public Health
under number 69045917.5.0000.5421. All those responsible for food retail were correctly
informed about the research and signed the Free and Informed Consent Form.
To develop and validate the score proposed in this study, a data set from an audit
process carried out inside food retailers was used. This data set was collected in the
municipality of Jundiai, located in the state of Sao Paulo, Southeastern Brazil. According
to the Brazilian Institute of Geography and Statistics (IBGE), Jundiai has approximatelyInt. J. Environ. Res. Public Health 2021, 18, 3690 3 of 14
418,962 inhabitants (in 2019) with a Human Development Index (HDI) of 0.82 (very high)
and a total area of 431.207 km2 divided into 684 urban and rural census sectors.
2.2. Audit of the Consumer Food Environment
An internal audit of food retailers from 573 census tracts in the urban area of the city
(representing 83.8% of the territory) was carried out. All retail food stores found on this route
were audited, excluding restaurants, fast food restaurants, bars, and street markets. A total of
650 food retailers were audited and grouped into 8 categories according to the proposal of Costa
et al. (2013) [17] and Machado et al. (2017) [23]: public specialized indoor fresh food markets
(farmers and municipal markets); private specialized indoor fresh food markets; supermarkets;
grocery stores; butchers and fishmongers, food retailers with the predominant sale of beverages;
food retailers with the predominant sale of ultra-processed foods (conveniences, pharmacies,
sweets and confectionery stores, and supplement stores), and bakeries.
The audit was carried out by 6 researchers (nutrition students) previously trained
according to the research protocol [24]; three nutritionists worked as field supervisors.
The training lasted 4 h and covered aspects such as personal presentation, filling the
AUDITNOVA checklist, learning about technical specifications of food, learning the food
classification system according to NOVA proposed by Monteiro et al. [25], and presentation
of the Informed Consent Form. The auditing process lasted 4 months, starting in December
2017 and ending in April 2018.
The audit was performed using the AUDITNOVA tool, which allows the collection
of availability and price information for 66 types of food (selected using food acquisition
data in Brazil from the Household Expenditure Survey—2008/2009), of which 35 were
fresh and minimally processed foods, 6 were culinary ingredients, 7 were processed foods,
and 18 were ultra-processed foods [18]. Information on different advertising claims was
also collected both for fresh and minimally processed and ultra-processed foods. Among
the types of advertising claim, we can list health and well-being, practicality, distribution
of free samples, highlight taste, color and texture, nutritional and functional properties,
among others that were measured at strategic points (near the store entrance, near the
cash register, end-of-aisle, island bins, and special floor displays). It should be noted that
AUDITNOVA is just a tool to collect data and does not have a scoring system to classify
food retailers as healthy. In this sense, to be able to generate the score proposed in this
study, data must be collected by the AUDITNOVA tool.
2.3. Development of the Consumer Food Environment Healthiness Score (CFEHS)
To elaborate the Consumer Food Environment Healthiness Score (CFEHS), the vari-
ables collected using the AUDITNOVA served as the basis for creating a set of indicators
classified into two dimensions: 1. food dimension, composed of the indicator availability
and promotional price, and 2. environmental dimension, composed of the indicators adver-
tising/information and placement. Methodologically, the choice of these specific indicators
and dimensions occurred as systematic reviews highlight availability, price, advertising, as
well placement strategies as the key determinants of food purchases in the consumer food
environment [7,26].
In each dimension, a set of indicators composed of a subset of dichotomous variables
(yes or no) selected from AUDITNOVA was created; Table 1 shows more details. A
score interval was attributed to each indicator, depending on their healthiness in the food
consumer’s environment. These healthiness scores were based on the recommendations of
the Dietary Guidelines for the Brazilian Population [27]. According to the guidelines, foods
from NOVA’s first three groups—fresh or minimally processed foods, culinary ingredients,
and processed foods—can compose healthy eating patterns, since they are part of culinary
preparations and balanced meals, thus receiving a positive score in this study. The Brazilian
Guidelines also recommend prioritizing vegetable origin foods rather than animal origin
foods. For ultra-processed foods (Group 4), the recommendation is to avoid them, which is
why they received a negative score.Int. J. Environ. Res. Public Health 2021, 18, 3690 4 of 14
Table 1. Indicators comprising the food and environment dimensions of the Consumer Food Environment Healthiness Score and total scores assigned according to NOVA food
classification groups.
Food Dimension (Availability and Promotional Price)
CFEHS Indicators (in bold) SCORE Indicator Total Score
NOVA Group
AUDITNOVA Variables (in italic) Availability Promotional Price
Fruits 12
1 to 2 items = 3
Orange; banana; papaya; apple; watermelon; other fruits (yes or no) 3 to 5 items = 6 > 2 promotional items = 3
6 items = 9
Vegetables 12
1 to 3 items = 3
Tomato (for salad); onion; crisp lettuce; carrots; Brazilian zucchini; chayote; parsley and
4 to 7 items = 6 > 2 promotional items = 3
Vegetable origin, fresh or chives; other vegetables (yes or no)
8 items = 9
minimally processed (base = 3
points) Roots, tubers, and corn 9
1 item = 3
Potatoes; cassava; other roots and tubers; corn on the cob (yes or no) 2 to 3 items = 6
4 items = 9
Beans and rice
Rice only = 3
At least 1 bean with
Kidney beans; black beans; white rice (yes or no) Beans only = 3
promotional price = 3
Rice and beans = 6
Meat and eggs 8
Beef only = 2 Chicken or eggs (at
Large white chicken egg; other types of eggs; prime beef (flank); beef (neck); whole chicken Fish with promotional price
Animal origin, fresh or least 1 type; regardless of beef) = 4
(with bone and skin); chicken breast; fish (any species) (yes or no) =2
minimally processed (base = 2 Fish (regardless of other meats) = 6
points)
Milk 2
UHT a whole cow’s milk Whole cow’s milk = 2
Culinary Ingredients
Culinary Ingredients (base = 1
1 item = 1
point) Salted Butter; soy oil; extra virgin olive oil; refined salt; coarse sugar; white or refined table
2 to 4 items = 2 3
sugar (yes or no)
5 to 6 items = 3
Processed bread 1
Processed (base = 1 point)
Freshly baked Bread (yes or no) Bread = 1Int. J. Environ. Res. Public Health 2021, 18, 3690 5 of 14
Table 1. Cont.
Food Dimension (Availability and Promotional Price)
CFEHS Indicators (in bold) SCORE Indicator Total Score
NOVA Group
AUDITNOVA Variables (in italic) Availability Promotional Price
Ultra-processed foods and beverages
Hot dog sausage; pork sausage; fermented milk drink strawberry flavor; instant noodles At least one soft drink with
Ultra-processed (base = −3 promotional price = −3
(chicken flavor); powdered seasoning; sliced bread; breakfast cereals (corn flakes); pizza −1 for each available item −27
points) Soft drink or nectar with
ready to heat; ice cream; regular soft drinks (350mL can and 2L); zero, light or diet soft
drinks; nectar in Tetra Pak box; powdered soft drink; corn snack; chocolate filled cookie; promotional price = −3
milk chocolate; candies (yes or no) At least one treat with a
promotional price = −3
Total Food Dimension Variation −27 a 56
Environment dimension (advertising and placement strategies)
CFEHS indicators (in bold)
NOVA Group SCORE Indicator total score
AUDITNOVA variables (in italic)
Presence of fruit and vegetables at the store entrance
Is the fruit and vegetable section located near the main entrance in the store?b (yes or no) Yes = 3 3
Advertisement of fresh/minimally processed foods at the store entrance
Is there advertisement of fresh/minimally processed foods at the store entrance? (yes or no) Yes = 3 3
Fresh or minimally processed Advertisement of fresh/minimally processed foods at the store outside
foods (base = 3 points) Is there advertisement of fresh/minimally processed foods at the store outside? (yes or no) Yes = 3 3
Advertisement of fresh/minimally processed foods inside the store 9
Flags; posters/banners; displays; tabloids with information about prices or promotions; folders or leaflets with recipes and culinary tips;
1 type = 3
or the following types of advertisements: showing some functional property; associating with physical activity; highlighting health and
2 to 3 types = 6
well-being; appealing practicality; “3 for the price of 2” type; highlighting sensorial proprieties; highlighting new launches; offering free
4 or more types = 9
gifts (tie-in sale) (yes or no)Int. J. Environ. Res. Public Health 2021, 18, 3690 6 of 14
Table 1. Cont.
Food Dimension (Availability and Promotional Price)
CFEHS Indicators (in bold) SCORE Indicator Total Score
NOVA Group
AUDITNOVA Variables (in italic) Availability Promotional Price
Advertisement of ultra-processed foods at the store entrance Yes = −3 points −3
Is there advertisement of ultra-processed foods at the store entrance? (yes or no)
Advertisement of ultra-processed foods at the store outside Yes = −3 points −3
Ultra-processed (base = −3 Is there advertisement of ultra-processed foods at the store outside? (yes or no)
points)
Presence of ultra-processed foods at the store check-out (cash register)? Yes = −3 points −3
Are there ultra-processed foods available at the store check-outs (cash register)?
Presence of advertisement of ultra-processed foods inside the store −9
Food tasting counter; free sample distribution; displays; island bins; end-of-aisle; or the following types of advertisements: claiming 1 a 3 types = −3
health and well-being; appealing practicality; claiming functional properties; “3 for the price of 2”; emphasizing sensorial proprieties; 4 a 5 types = −6
highlighting new launches; offering free gifts (tie-in sale) (yes or no) 6 or more types= −9
Total Environment Dimension Variation −18 to 15
Total Cfehs Variation −46 to 71
a Ultra-high-temperature (UHT) pasteurization involves heating milk or cream from 138 to 150 ◦ C (280 to 302 ◦ F) for one or two seconds; b could be understood as a display of fruits or vegetables near their cash
registers [28], or strategic placement of healthy foods at supermarket [29]. NOVA = NOVA food classification proposed by Monteiro et al. [25] which classify foods in four groups: 1. unprocessed or minimally
processed foods, 2. Culinary ingredients, 3. Processed Foods and, 4. Ultra-processed Foods.Int. J. Environ. Res. Public Health 2021, 18, 3690 7 of 14
In the food dimension, the total point on each indicator considers food availability
and, in some cases, if the retailer offers promotional prices. This factor was accounted only
for foods that are markers of healthy eating (fruits, vegetables, beans, and fish) or unhealthy
eating (soft drinks, nectar, and sweets) according to Brazilian national studies [30].
For example, in the food dimension, the indicator “Fruits” is composed of a variable set
on the availability of different types of fruits (orange, banana, papaya, apple, watermelon,
and other fruits) collected by AUDITNOVA at the food retailer. In the case of the availability
of 1 or 2 fruits, three points should be accounted for: for 3 to 5 fruits, 6 points; for 6 fruits,
9 points. Since fruits are markers of healthy eating, if there are at least 3 items with a
promotional price, 3 extra points should be accounted for. Opposite points are attributed
to the indicator “Ultra-processed foods”, considering the total counting of items collected
by AUDITNOVA (Table 1).
For the environment dimension, points were awarded according to the scoring param-
eter related to the Dietary Guidelines; that is, if advertising and placement strategies in
the consumer food environment were related to the group of fresh or minimally processed
foods, the score was positive; if it was related to the group of ultra-processed foods, it
was negative. The full list of variables used to compose the Consumer Food Environment
Healthiness Score (CFEHS) in the food and environment dimensions can be seen in Table 1.
2.4. Statistical Analysis
The scores for the food and environment dimensions were computed using the simple
sum of the indicators for each dimension, standardized for the scale from 0 to 100 points.
The higher the score is (closer to 100), the healthier the food retailers are. To obtain the
total CFEHS, the average between the scores of the two dimensions was calculated, so
that they both had the same weight in the final score. Descriptive analysis was performed,
and the distribution of variables was verified by the Kolmogorov–Smirnov test. The total
CFEHS variables, food score, and environment score were described by the median and
interquartile range (P25–P75). To analyze the statistical measures of the data set, such
as variability, mean, and outliers, Box-Plot graphs of the total CFEHS variables, food
dimension score, and environment dimension score according to types of food retailers
were constructed.
To compare the median of CFEHS and its dimensions between types of food retailers,
the Kruskal–Wallis test for nonparametric variables was used.
The construct validity of the CFEHS was evaluated to identify whether the score
reflected the desired theoretical concept, in this case, the healthiness of the consumer
food environment [31]. For this, it was analyzed if the score could classify three food
retailer groups previously proposed to identify food deserts in Brazil [32], which were
adapted for this study: Group 1. food retailers with the predominant sale of fresh or
minimally processed foods (composed of public specialized indoor fresh food markets;
private specialized indoor fresh food markets, and butchers and fishmongers); Group
2. mixed food retailers (composed of bakeries, supermarkets, and grocery stores); and
Group 3. food retailers with the predominant sale of ultra-processed foods (composed of
conveniences, pharmacies, sweets and confectionery stores, supplement stores, and food
retailers with the predominant sale of beverages). The scores of the three categories in the
CFEHS and its dimensions were compared using the Kruskal–Wallis test and the Dunn test.
To confirm the validity of the CFEHS and its dimensions, it was expected that they could
discriminate between the three categories of establishment, so that category 1 retailers had
higher scores than those in category 2, and that both categories had higher scores than
those in category 3.
Cronbach’s alpha (α) coefficients were calculated to determine the internal consistency
of the total CFEHS and its comprising dimensions. Cronbach’s α values > 0.70 indicate
good internal data consistency [33].
All analyses were conducted in the STATA 15 statistical package. Statistically signifi-
cant differences were considered to be p < 0.01.Int. J. Environ. Res. Public Health 2021, 18, 3690 8 of 14
3. Results
Of the 650 commercial retailers studied, 39.9% were food retailers with the predomi-
nant sale of ultra-processed foods and 25.2% were grocery stores, which together accounted
for over 65% of the retailers selling food in the region; of the remaining 35.0%, around
14.0% were bakeries, 6.0% were butchers and fishmongers, 6.0% were private and pub-
lic specialized indoor fresh food markets, 5.0% were supermarkets, and 4.0% were food
retailers with the predominant sale of beverages (Table 2).
The CFEHS presented a median value of 33.7 (p25 = 26.9 and p75 = 42.1). The food
retailers with the highest CFEHS medians were public and private specialized indoor fresh
food markets, and those with the lowest medians were bakeries and food retailers with
the predominant sale of ultra-processed of foods. When analyzing the food dimension
score, public specialized indoor fresh food markets have a higher score, followed by private
fresh food markets and supermarkets. For the environment dimension, public and private
specialized indoor fresh food markets also have higher scores (Table 2).
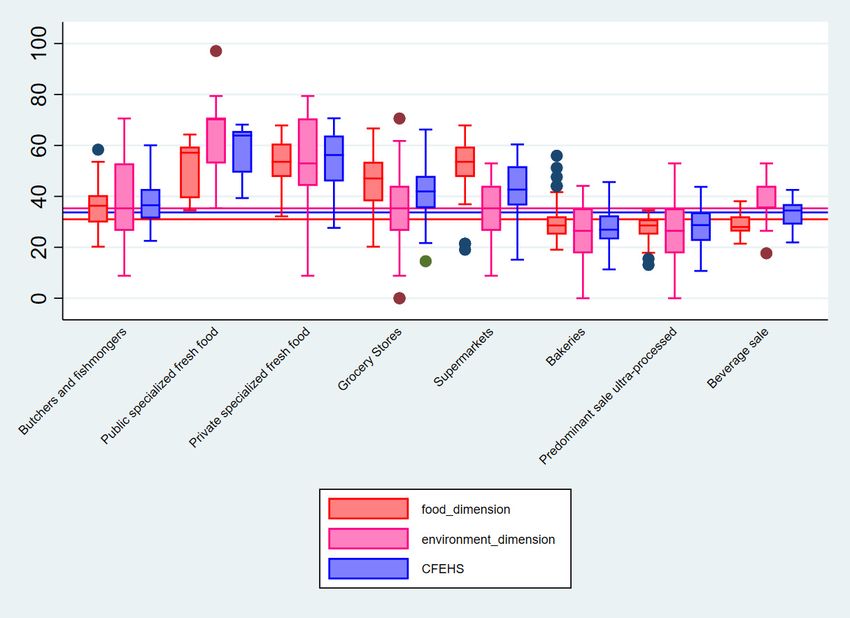
Figure 1 illustrates the Box Plot with the extent and variability of data according
to the different types of food retailers. It is possible to visualize in the box the median,
minimum and maximum values, and interquartile ranges for the scores. It is also possible
to verify variations in the CFEHS score and its dimensions within the same category of
establishments and between different types. The three continuous straight lines in the
x-axis show the mean score in their three dimensions. In the food dimension, we observed
outliers (extreme values) for both butchers and fishmongers as well as for bakeries and
food retailers with the predominant sale of ultra-processed food; still, in this dimension,
we also observed that the public specialized indoor fresh food markets have the highest
median. In the environment dimension, we observed outlier values into two categories
as public specialized indoor fresh food markets (also with this higher median size) and
grocery stores. In CFEHS outliers, we found that grocery stores and the public specialized
fresh-food market showed the high median.
In the construct validation analysis, it was observed that CFEHS could satisfactorily
classify the extreme groups 1 (predominance of fresh and minimally processed foods)
and 3 (predominance of ultra-processed foods) and groups 2 (mixed food retailers) and 3,
but not groups 1 and 2. For the food dimension, the same associations as the total CFEHS
were identified; however, the environment dimension adequately classified all groups
(Table 3).
The results of Cronbach’s alpha showed excellent internal consistency for the total
CFEHS (α = 0.91) and for the food dimension (α = 0.91), whereas the values for the
environment dimension (α = 0.60) were lower.Int. J. Environ. Res. Public Health 2021, 18, 3690 9 of 14
Table 2. Consumer Food Environment Healthiness Score median (p25 and p75) and its food and environment dimensions according to different categories of commercial retailers in Brazil.
Total Percent Food Dimension Score Environment Dimension Score CFEHS (Environment and Food)
Food Retailers
N % Median * P25 p75 Median * P25 P75 Median * P25 P75
Public specialized indoor fresh food markets 15 2.3 57.1 39.3 59.5 70.6 52.9 70.6 63.9 49.3 65.7
Private specialized indoor fresh food markets 23 3.5 53.6 47.6 60.7 52.9 44.1 70.6 56.2 45.9 63.9
Supermarket 31 4.8 53.6 47.6 59.5 35.3 26.5 44.1 42.7 36.5 51.8
Grocery Stores 164 25.2 47.0 38.1 53.6 35.3 26.5 44.1 41.9 35.4 48.0
Butchers and fishmongers 38 5.9 36.3 29.8 40.5 35.3 26.5 52.9 36.5 31.3 42.9
Food retailers with predominant sale of beverages 26 4.0 28.0 26.2 32.1 35.3 35.3 44.1 34.4 29.0 36.9
Food retailers with predominant sale of
259 39.9 28.6 25.0 31.0 26.5 17.7 35.3 28.7 22.5 33.7
ultra-processed foods **
Bakeries 94 14.5 28.6 25.0 32.1 26.5 17.7 35.3 26.9 23.1 32.5
TOTAL 650 100.0 31.0 27.4 44.1 35.3 26.5 44.1 33.7 26.9 42.1
CFEHS: Consumer Food Environment Healthiness Score; * p-value < 0.0001 using the Kruskal–Wallis method, showing a significant difference in all scores between types of retailers; ** conveniences, pharmacies,
sweets and confectionery stores, and supplement stores.
Table 3. Mean (SD) and median (p25 and p75) of the Consumer Food Environment Healthiness Score and its food and environment dimensions according to three groups of commercial retailers in
Brazil.
Group1 vs. Group1 vs. Group2 vs.
Group 1 (n = 76) Group 2 (n = 289) Group 3 (n = 285)
Total Score and Dimensions Group2 Group3 Group3
Mean (SD) Median Mean (SD) Median Mean (SD) Median p-Value * p-Value p-Value p-Value
Food Dimension Score 44.0 (12.3) 42.3 41.4 (12.4) 40.5 28.0 (3.7) 28.6 0.000 * 0.081 0.000 ** 0.000 **
Environment Dimension Score 49.7 (18.6) 52.9 32.4 (13.3) 35.3 29.7 (13.7) 35.3 0.000 * 0.000 ** 0.000 ** 0.000 **
Total Score (Environment and
46.8 (13.4) 44.7 36.9 (10.7) 36.7 28.8 (7.9) 28.9 0.000 * 0.292 0.000 ** 0.000 **
Food)—CFEHS
Group 1. food retailers with predominant sale of fresh or minimally processed foods (public specialized indoor fresh food markets; private specialized indoor fresh food markets; butchers and fishmongers);
Group 2. mixed food retailers (bakeries, supermarkets, grocery stores); Group 3. food retailers with predominant sale of ultra-processed foods (conveniences, pharmacies, sweets and confectionery stores,
supplement stores and food retailers with predominant sale of beverages); * Kruskal–Wallis test for nonparametric variables, ** Dunn test; SD: standard deviation; p25: 25th percentile; p75: 75th percentile.
CFEHS: Consumer Food Environment Healthiness Score.Int. J. Environ. Res. Public Health 2021, 18, 3690 10 of 14
Int. J. Environ. Res. Public Health 2021, 18, x 9 of 14
Figure 1. Consumer
Figure 1. Consumer Food
Food Environment
EnvironmentHealthiness
HealthinessScore
ScoreBox
BoxPlot
Plotand
anditsitsfood
foodand
and environment
environment dimensions
dimensions according
according to
to different categories of food retailers. Brazil.
different categories of food retailers. Brazil.
In the construct validation analysis, it was observed that CFEHS could satisfactorily
4. Discussion
classify the extreme groups 1 (predominance of fresh and minimally processed foods) and
This study developed, validated, and tested a Consumer Food Environment Health-
3 (predominance of ultra-processed foods) and groups 2 (mixed food retailers) and 3, but
iness Score (CFEHS) composed of two dimensions, one related to the availability and
not groups 1 and 2. For the food dimension, the same associations as the total CFEHS were
promotional price, named the food dimension, and the other related to advertising and
identified; however, the environment dimension adequately classified all groups (Table
placement strategies, named the environment dimension. In the construction of these
3).
indicators, high internal consistency of the data was observed, except for the environmen-
tal dimension.
Table 3. Mean (SD) and median (p25 and p75)CFEHS
of theshowed
Consumer theFood
ability to classifyHealthiness
Environment food retailers
Scorethat
andwere previously
its food and
reported in the literature to map food deserts
environment dimensions according to three groups of commercial retailers in Brazil. in Brazil [32]. Additionally, when creating
this score, the key determinants of consumer food choices in food retailers were considered,
the availability of food [11,12] and advertising [14] coupled placement Group1 strategies
Group1 [34].Group2This
Group
was 1
the (n =
first76) Group
Brazilian 2
study(n = 289)
to Group
consider the 3 (n =
degree285)of food vs.
processing as a vs.
theoretical vs.
basis
Total Score and Dimensions
for the development of a healthiness score for the consumer food Group2 Group3 Group3
environment.
Studies thatMean
assess Me-
the healthiness Me-
Mean (SD) Median (SD) Mean of (SD)the consumerp-Value food environment
* p-Value p-Value consider
p-Value as
healthy the food retailers thatdian dian considered empowering for healthy
presents a set of factors
Food Dimension Score 44.0 (12.3)
food 42.3 such41.4
choices, (12.4)
as offering 40.5 28.0variety
a greater (3.7) of 28.6
fresh0.000
foods;* having
0.081 a fruit
0.000 ** vegetable
and 0.000 **
Environment Dimension section
49.7 (18.6) at52.9
the entrance of the 35.3
32.4 (13.3) store and
29.7 or in a special
(13.7) 35.3 0.000floor*display;
0.000 **carrying
0.000 **out 0.000
healthy**
Score food price promotions; and, at the same time, presenting an internal environment with
Total Score (Environment
a (13.4)
46.8 lower number
44.7 of advertisements
36.9 (10.7) [14,16,35–38].
36.7 28.8 (7.9) 28.9 In 0.000
this study,
* we chose
0.292 0.000to** study
0.000two
**
and Food)—CFEHS
dimensions in addition to the total score because of the complexity of the determinants
Group 1. food retailers with predominant sale of fresh or minimally processed foods (public specialized indoor fresh food
of food choices in food retailers. In this sense, a retailer may present a high availability of
markets; private specialized indoor fresh food markets; butchers and fishmongers); Group 2. mixed food retailers (baker-
healthy foods, but a massive presence of advertising and many placement strategies to
ies, supermarkets, grocery stores); Group 3. food retailers with predominant sale of ultra-processed foods (conveniences,
pharmacies, sweets and confectioneryunhealthy
promote food products,
stores, supplement making
stores and the retailer
food retailers withless likely to promote
predominant good nutrition
sale of beverages); *
Kruskal–Wallis test for nonparametric variables, ** Dunn test; SD: standard deviation; p25: 25th percentile; p75: 75th per-
centile. CFEHS: Consumer Food Environment Healthiness ScoreInt. J. Environ. Res. Public Health 2021, 18, 3690 11 of 14
and health. For a food retailer to be considered healthy using the scores proposed in this
study, its scores should be close to 100 for both the food dimension and the environment
dimension, since both are related to the consumer’s food choices in these spaces.
In the international scenario, the study proposed by Glanz et al. (2007) [14], named
the Nutrition Environment Measures Survey in Stores (NEMS-S), developed a health score for
food retailers ranging from 0 to 50 points. In the construction of this score, information
on availability, price, and quality of the food offered was used. Placement strategies and
advertising are left out in the NEMS-S, and the scoring method adopted was also developed
for an international context, with the food pyramid as its theoretical framework for healthy
eating [14]. The NEMS-S health score considers healthy foods as those with a reduction in
some macronutrients (example: lean meat and low-fat dairy) or whole versions (example:
whole grain bread) and does not consider the degree of food processing.
In the study of the Obesogenic Environment of Sao Paulo (ESAO-SP), carried out
by Duran et al. (2015) [38], an instrument for assessing the consumer food environment
was developed and validated, and a scale to measure the availability of healthy foods in
food retailers, named Healthy Food Store Index (HFSI), was proposed. This index comprises
different indicators of the consumer food environment, and it varies from 1 to 16; the higher
the value is, the better the availability of healthy foods is, and, consequently, the lower
the availability of ultra-processed foods is. This indicator also assesses the advertising
of ultra-processed foods and the presence of vegetables near the entrance of the store,
items also considered in the construction of CFEHS. The main differences between CFEHS
and HFSI are in the incorporations of the new food group markers of a healthy diet as
culinary ingredients and processed foods, in addition to the traditional indicators of fruits
and vegetables and the inclusion of promotional prices and placement strategies, making
CFEHS more complete and in consonance with national recommendations for healthy
eating.
In Brazil, two important studies using data from the Household Expenditure Survey
carried out by IBGE found that the primary place for food acquisition among Brazilians
is the supermarket [17,23]. When evaluating the performance of the supermarket chain
category among the scores proposed in this study, it was possible to observe a high score for
the food dimension, but low for the environment dimension. By grouping all supermarkets,
grocery stores, and bakeries into a single group of mixed retailers, it was possible to
observe a lower score for the environment dimension compared to the group of food
retailers with the predominant sale of fresh or minimally processed foods, although no
significant differences were observed for the food dimension and for the total CFEHS. This
indicates that these types of food retailers offer a wide range of foods that make up healthy
eating patterns, but at the same time, their environmental (advertising and placement
strategies) characteristics tend to favor the purchase of unhealthy foods.
This study analyzed eight different categories of food retailers present in a municipal-
ity of Brazil, and most of them were classified by the predominant sale of ultra-processed
foods (comprising convenience stores, candy stores, cake shops, ice cream shops, and
pharmacies), presenting the worst performance in the healthiness score. Butchers and
fishmongers and public and private specialized indoor fresh food markets had a higher
CFEHS median and can be considered as the best food retailers to help people achieve the
recommendations of the Dietary Guidelines for the Brazilian Population [27], as they offer
availability and good prices for healthy food and, at the same time, a low prevalence of
advertising and placement strategies that promote ultra-processed foods.
It is challenging to compare different categories of retailers and their healthiness in
different countries since their characteristics, as well as the classification rules of food
retailers and the indicators and audit tools available for their evaluation, do not always
follow the same criteria and standardization [26]. In the United States of America, small
retail stores (named grocery stores or small retailers), which could be equivalent to our
grocery stores, are associated with a better availability of healthy foods than those named
corner stores (equivalent to our convenience stores) [39].Int. J. Environ. Res. Public Health 2021, 18, 3690 12 of 14
Although the data used in this study are from a medium-sized municipality, we
believe that they could be used to assess the healthiness of food retailers in other regions of
Brazil because, as seen, the score was able to classify groups of food retailers, created by the
Brazilian government, and used to identify food deserts in all Brazilian territory [32]. It also
has the advantage of being a more complete score that encompasses not only dimensions
of food availability but also price, advertising, and placement strategies. As we know that
almost half of the Brazilian population makes food purchases in supermarkets [21], the
score produced in this study could be useful to assess the healthiness of these locations.
In Brazil, there is still no consensus; the supermarket, in one study, was a promoter of
healthy foods purchases, such as fruits and vegetables [40], and in another, was a promoter
of ultra-processed foods purchases [21,23].
It is worth highlighting some strengths of this study. This is an in-depth analysis
of the internal environment of different categories of food retailers located in a medium-
sized municipality in Brazil. The use of the AUDITNOVA tool made it possible to collect,
at the consumer food environment level, information on availability, price, advertising,
and placement strategies not only for fruit and vegetables but also for the other NOVA
food groups. The developed score may support the territorial identification of healthy
food environments in which individuals and communities can exercise healthy behavior.
However, the study also has some limitations, such as not including other food retailers,
such as restaurants and bars, in the audit performed because the AUDITNOVA tool did
not allow it. It is known that each year the Brazilian population consumes more food
out of the home [41] and that it is also necessary to expand studies on the health of these
environments and how they can influence the food purchasing in Brazil. The quality
indicator generally used to evaluate fruits and vegetables was not used in this study in
the construction of the score because, according to the theoretical framework adopted, a
quality meal involves the presence of different food groups.
According to validity and reliability results, CFEHS proved to be an adequate tool
for classifying and identifying food retailers according to their healthiness. The low value
of Cronbach’s alpha for the environment dimension may be related to the fact that it
has a smaller number of indicators, since the alpha coefficient is sensitive to the number
of items [42]. However, this factor does not represent a limitation of the score, since
healthiness is understood here as a construct formed by the inseparable combination of
environmental characteristics and the set of foods being sold. Therefore, the use of these
indicators is more appropriate as components of a broader concept of healthiness and not
as isolated indicators.
The present study proposed a score to assess the consumer food environment, compris-
ing food and environment dimensions, to provide a general assessment of the healthiness
of food retailers, showing that public specialized indoor fresh food markets present the
healthiest score. The applied CFEHS showed the ability to discriminate groups of retailers
reported as healthy and unhealthy according to the degree of processing of the commer-
cialized foods. Every aspect measured in this study may be useful in future research that
aims to measure the relationship between internal aspects of the consumer food environ-
ment and its relationship with the quality of the diet, as well as assessing the effects of
interventions on the consumer food environment with multiple components.
Author Contributions: Conceptualization, C.A.B. and K.T.G.; methodology, C.A.B. and K.T.G.;
formal analysis, C.A.B. and K.T.G.; data curation, C.A.B.; writing—original draft preparation, C.A.B.;
writing—review and editing, K.T.G. and P.C.J.; supervision, P.C.J.; funding acquisition, C.A.B. All
authors have read and agreed to the published version of the manuscript.
Funding: This research was funded by São Paulo Research Foundation (FAPESP), grant number
2016/12766-6, and the CAB received research grant by São Paulo Research Foundation (FAPESP),
grant number 2016/12766-6.
Institutional Review Board Statement: The study was approved by the Research Ethics Committee
of the School of Public Health under number 69045917.5.0000.5421.Int. J. Environ. Res. Public Health 2021, 18, 3690 13 of 14
Informed Consent Statement: Informed consent was obtained from all subjects (food retailer owners)
involved in the study.
Data Availability Statement: The data presented in this study are available on request from the
corresponding author. The data are not publicly available due to these data belonging exclusively to
the research group of the Faculty of Public Health—USP.
Acknowledgments: FAPESP is acknowledged for the research grant awarded to C.A.B.
Conflicts of Interest: The authors declare no conflict of interest.
References
1. Fanzo, J.; Arabi, M.; Burlingame, B.; Haddad, L.; Kimenju, S.; Miller, G.; Nie, F.; Recine, E.; Serra-Majem, L.; Sinha, D. Nutrition
and Food Systems; A report by the High Level Panel of Experts on Food Security and Nutrition of the Committee on World Food
Security; FAO: Rome, Italy, 2017.
2. Kanter, R.; Walls, H.L.; Tak, M.; Roberts, F.; Waage, J. A conceptual framework for understanding the impacts of agriculture and
food system policies on nutrition and health. Food Secur. 2015, 7, 767–777. [CrossRef]
3. Glanz, K.; Sallis, J.F.; Saelens, B.E.; Frank, L.D. Healthy nutrition environments: Concepts and measures. Am. J. Health Promot.
2005, 19, 330–333. [CrossRef] [PubMed]
4. Story, M.; Kaphingst, K.M.; Robinson-O’Brien, R.; Glanz, K. Creating healthy food and eating environments: Policy and
environmental approaches. Annu. Rev. Public Health 2008, 29, 253–272. [CrossRef]
5. Swinburn, B.; Egger, G.; Raza, F. Dissecting obesogenic environments: The development and application of a framework for
identifying and prioritizing environmental interventions for obesity. Prev. Med. 1999, 29 Pt 1, 563–570. [CrossRef]
6. Lytle, L.A.; Sokol, R.L. Measures of the food environment: A systematic review of the field, 2007–2015. Health Place 2017, 44,
18–34. [CrossRef] [PubMed]
7. McKinnon, R.A.; Reedy, J.; Morrissette, M.A.; Lytle, L.A.; Yaroch, A.L. Measures of the food environment: A compilation of the
literature, 1990–2007. Am. J. Prev. Med. 2009, 36 (Suppl. 4), S124–S133. [CrossRef]
8. Gustafson, A.; Hankins, S.; Jilcott, S. Measures of the consumer food store environment: A systematic review of the evidence
2000–2011. J. Community Health 2012, 37, 897–911. [CrossRef]
9. Budd, N.; Cuccia, A.; Jeffries, J.K.; Prasad, D.; Frick, K.D.; Powell, L.; Katz, F.A.; Gittelsohn, J. B’More Healthy: Retail Rewards–
design of a multi-level communications and pricing intervention to improve the food environment in Baltimore City. BMC Public
Health 2015, 15, 283. [CrossRef]
10. Dannefer, R.; Williams, D.A.; Baronberg, S.; Silver, L. Healthy bodegas: Increasing and promoting healthy foods at corner stores
in New York City. Am. J. Public Health 2012, 102, e27–e31. [CrossRef]
11. Adjoian, T.; Dannefer, R.; Willingham, C.; Brathwaite, C.; Franklin, S. Healthy Checkout Lines: A Study in Urban Supermarkets. J.
Nutr. Educ. Behav. 2017, 49, 615–622.e1. [CrossRef]
12. Lam, C.C.V.; Ejlerskov, K.T.; White, M.; Adams, J. Voluntary policies on checkout foods and healthfulness of foods displayed at,
or near, supermarket checkout areas: A cross-sectional survey. Public Health Nutr. 2018, 21, 3462–3468. [CrossRef] [PubMed]
13. Houghtaling, B.; Serrano, E.L.; Kraak, V.I.; Harden, S.M.; Davis, G.C.; Misyak, S.A. A systematic review of factors that influence
food store owner and manager decision making and ability or willingness to use choice architecture and marketing mix strategies
to encourage healthy consumer purchases in the United States, 2005–2017. Int. J. Behav. Nutr. Phys. Act. 2019, 16, 5. [CrossRef]
[PubMed]
14. Glanz, K.; Sallis, J.F.; Saelens, B.E.; Frank, L.D. Nutrition Environment Measures Survey in stores (NEMS-S): Development and
evaluation. Am. J. Prev. Med. 2007, 32, 282–289. [CrossRef] [PubMed]
15. Saelens, B.E.; Glanz, K.; Sallis, J.F.; Frank, L.D. Nutrition Environment Measures Study in restaurants (NEMS-R): Development
and evaluation. Am. J. Prev. Med. 2007, 32, 273–281. [CrossRef]
16. Moayyed, H.; Kelly, B.; Feng, X.; Flood, V. Evaluation of a “healthiness” rating system for food outlet types in Australian
residential communities. Nutr. Diet. J. Dietit. Assoc. Aust. 2017, 74, 29–35. [CrossRef]
17. Costa, J.C.; Claro, R.M.; Martins, A.P.B.; Levy, R.B. Food purchasing sites. Repercussions for healthy eating. Appetite 2013, 70,
99–103. [CrossRef]
18. Borges, C.A.; Jaime, P.C. Development and evaluation of food environment audit instrument: AUDITNOVA. Rev. Saúde Pública
2019, 53, 91. [CrossRef]
19. Pagliai, G.; Dinu, M.; Madarena, M.P.; Bonaccio, M.; Iacoviello, L.; Sofi, F. Consumption of ultra-processed foods and health
status: A systematic review and meta-analysis. Br. J. Nutr. 2021, 125, 308–318. [CrossRef]
20. Askari, M.; Heshmati, J.; Shahinfar, H.; Tripathi, N.; Daneshzad, E. Ultra-processed food and the risk of overweight and obesity:
A systematic review and meta-analysis of observational studies. Int. J. Obes. 2020, 44, 2080–2091. [CrossRef]
21. Machado, P.P.; Claro, R.M.; Canella, D.S.; Sarti, F.M.; Levy, R.B. Price and convenience: The influence of supermarkets on
consumption of ultra-processed foods and beverages in Brazil. Appetite 2017, 116, 381–388. [CrossRef]
22. Castro, I.A.; Majmundar, A.; Williams, C.B.; Baquero, B. Customer Purchase Intentions and Choice in Food Retail Environments:
A Scoping Review. Int. J. Environ. Res. Public Health 2018, 15, 2493. [CrossRef]Int. J. Environ. Res. Public Health 2021, 18, 3690 14 of 14
23. Machado, P.P.; Claro, R.M.; Martins, A.P.B.; Costa, J.C.; Levy, R.B. Is food store type associated with the consumption of
ultra-processed food and drink products in Brazil? Public Health Nutr. 2018, 21, 201–209. [CrossRef]
24. Borges, C.A.; Scaciota, L.L.; Gomes, A.T.D.S.; Serafim, P.; Jaime, P.C. Manual for Application an Auditing Tool of the Food Environment
based on NOVA Food Classification System Present at Dietary Guidelines for the Brazilian Population Portal de Livros Abertos da USP;
Universidade de São Paulo: São Paulo, Brazil; ISBN 9788588848306. Available online: http://www.livrosabertos.sibi.usp.br/
portaldelivrosUSP/catalog/book/296 (accessed on 15 January 2021). [CrossRef]
25. Monteiro, C.A.; Cannon, G.; Levy, R.B.; Moubarac, J.C.; Louzada, M.L.; Rauber, F.; Khandpur, N.; Cediel, G.; Neri, D.; Martinez-
Steele, E.; et al. Ultra-processed foods: What they are and how to identify them. Public Health Nutr. 2019, 22, 936–941. [CrossRef]
[PubMed]
26. Glanz, K.; Johnson, L.; Yaroch, A.L.; Phillips, M.; Ayala, G.X.; Davis, E.L. Measures of Retail Food Store Environments and Sales:
Review and Implications for Healthy Eating Initiatives. J. Nutr. Educ. Behav. 2016, 48, 280–288.e1. [CrossRef] [PubMed]
27. Ministry of Health; Department of Health Care, Department of Primary Care. Dietary Guidelines for the Brazilian Population, 2nd
ed.; Ministry of Health: Brasilia, Brazil, 2015; 156p.
28. Miller, C.; Bodor, J.N.; Rose, D. Measuring the food environment: A systematic technique for characterizing food stores using
display counts. J. Environ. Public Health 2012, 2012, 707860. [CrossRef]
29. Cameron, A.J. The shelf space and strategic placement of healthy and discretionary foods in urban, urban-fringe and rural/non-
metropolitan Australian supermarkets. Public Health Nutr. 2018, 21, 593–600. [CrossRef] [PubMed]
30. Brazil, V. 2019: Surveillance of Risk and Protective Factors for Chronic Diseases by Telephone Survey: Estimates of Frequency and
Sociodemographic Distribution of Risk and Protective Factors for Chronic Diseases in the Capitals of the 26 Brazilian States and the Federal
District in 2019; Ministry of Health: Brasilia, Brazil, 2020; 137p, ISBN 9788533427655.
31. Nunnally, I.H.B.J.; Bernstein, I. Psychometric Theory, 3rd ed.; McGraw-Hill: New York, NY, USA, 1994.
32. Executive Secretariat of the Interministerial Chamber for Food and Nutrition Security. Mapeamento Dos Desertos Alimentares No
Brasil. 2018. Available online: http://aplicacoes.mds.gov.br/sagirmps/noticias/arquivos/files/Estudo_tecnico_mapeamento_
desertos_alimentares.pdf (accessed on 15 January 2021).
33. Field, A. Descobrindo a Estatística Usando o SPSS, 5th ed.; Penso Editora: Porto Alegre, Brazil, 2020; 1072p, ISBN 9788584292011.
34. Jahns, L.; Payne, C.R.; Whigham, L.D.; Johnson, L.K.; Scheett, A.J.; Hoverson, B.S.; Kranz, S. Foods advertised in US weekly
supermarket sales circulars over one year: A content analysis. Nutr. J. 2014, 13, 95. [CrossRef]
35. Kerr, J.; Sallis, J.F.; Bromby, E.; Glanz, K. Assessing Reliability and Validity of the GroPromo Audit Tool for Evaluation of Grocery
Store Marketing and Promotional Environments. J. Nutr. Educ. Behav. 2012, 44, 597–603. [CrossRef]
36. Black, C.; Ntani, G.; Inskip, H.; Cooper, C.; Cummins, S.; Moon, G.; Baird, J. Measuring the healthfulness of food retail stores:
Variations by store type and neighbourhood deprivation. Int. J. Behav. Nutr. Phys. Act. 2014, 11, 69. [CrossRef]
37. Ni Mhurchu, C.; Vandevijvere, S.; Waterlander, W.; Thornton, L.E.; Kelly, B.; Cameron, A.J.; Snowdon, W.; Swinburn, B.;
INFORMAS. Monitoring the availability of healthy and unhealthy foods and non-alcoholic beverages in community and
consumer retail food environments globally. Obes. Rev. 2013, 14 (Suppl. 1), 108–119. [CrossRef]
38. Duran, A.C.; Lock, K.; Latorre, M.D.R.; Jaime, P.C. Evaluating the use of in-store measures in retail food stores and restaurants in
Brazil. Rev. Saude Publica 2015, 49. [CrossRef] [PubMed]
39. Gustafson, A.; Christian, J.W.; Lewis, S.; Moore, K.; Jilcott, S. Food venue choice, consumer food environment, but not food venue
availability within daily travel patterns are associated with dietary intake among adults, Lexington Kentucky 2011. Nutr. J. 2013,
12, 17. [CrossRef] [PubMed]
40. Duran, A.C.; de Almeida, S.L.; Latorre Mdo, R.; Jaime, P.C. The role of the local retail food environment in fruit, vegetable and
sugar-sweetened beverage consumption in Brazil. Public Health Nutr. 2016, 19, 1093–1102, Epub 9 June 2015. [CrossRef] [PubMed]
41. Brazilian Institute of Geography and Statistics. Household Budget Survey, 2017–2018: First Results; IBGE: Rio de Janeiro, Brazil,
2019; 64p, ISBN 978-85-240-4505-9.
42. Streiner, D.L. Being inconsistent about consistency: When coefficient alpha does and doesn’t matter. J. Pers. Assess. 2003, 80,
217–222. [CrossRef]You can also read