Assessing the Impact of Vehicle Speed Limits and Fleet Composition on Air Quality Near a School - MDPI
←
→
Page content transcription
If your browser does not render page correctly, please read the page content below
International Journal of
           Environmental Research
           and Public Health

Article
Assessing the Impact of Vehicle Speed Limits and
Fleet Composition on Air Quality Near a School
Jiayi Tang 1, * , Aonghus McNabola 1,2 , Bruce Misstear 1 , Francesco Pilla 3 and
Md Saniul Alam 1,4
 1    Department of Civil, Structural and Environmental Engineering, Trinity College Dublin, College Green,
      Dublin D02 PN40, Ireland; amcnabol@tcd.ie (A.M.); bmisster@tcd.ie (B.M.);
      Saniul.Alam@jacobs.com (M.S.A.)
 2    Global Centre for Clean Air Research, Department of Civil and Environmental Engineering, Faculty of
      Engineering and Physical Sciences (FEPS), University of Surrey, Guildford GU2 7XH, UK
 3    Department of Planning and Environmental Policy, University College Dublin, Belfield,
      Dublin D04 V1W8, Ireland; francesco.pilla@ucd.ie
 4    Jacobs Engineering Group Inc., Dublin D04 R2C5, Ireland
 *    Correspondence: jitang@tcd.ie; Tel.: +353-1-896-3837

 Received: 7 August 2018; Accepted: 2 January 2019; Published: 8 January 2019

 Abstract: Traffic is a major source of urban air pollution that affects health, especially among children.
 As lower speed limits are commonly applied near schools in many cities, and different governments
 have different policies on vehicle fleet composition, this research estimated how different speed
 limits and fleet emissions affect air quality near a primary school. Based on data of traffic, weather,
 and background air quality records in Dublin from 2013, traffic, emission, and dispersion models
 were developed to assess the impact of different speed limits and fleet composition changes against
 current conditions. Outside the school, hypothetical speed limit changes from 30 km/h to 50 km/h
 could reduce the concentration of NO2 and PM10 by 3% and 2%; shifts in the fleet from diesel to
 petrol vehicles could reduce these pollutants by 4% and 3% but would increase the traffic-induced
 concentrations of CO and Benzene by 63% and 35%. These changes had significantly larger impacts on
 air quality on streets with higher pollutant concentrations. Findings suggest that both road safety and
 air quality should be considered when determining speed limits. Furthermore, fleet composition has
 different impacts on different pollutants and there are no clear benefits associated with incentivising
 either diesel or petrol engine vehicles.

 Keywords: traffic emissions; speed limit; vehicle fleet; air pollution; school children

1. Introduction
     Research has shown significant associations between traffic pollution and adverse human health
effects related to lung, heart, psychological, and other body systems (e.g., increasing lung cancer,
heart disease, dementia, and other health problems) [1–11]. Air pollution is a major environmental
problem that causes 6.4 million premature deaths worldwide per year, which is 72% out of 9
million deaths from all types of pollution [12]. Children in particular have been noted to be at
high risk of pollution-related disease. Even very low-level exposures to air pollutants during
windows of developmental vulnerability can result in disease, disability, and death in childhood
and in later life [13]. Traffic related air pollution is not only linked to worsening existing health
problems in children, but is also connected with the development of diseases, such as asthma [14].
Traffic related air pollution is harmful to the development of children’s nervous system, causing
neurodegeneration, neuro-inflammation, and problems connected to cognition [15–17]. Many other

Int. J. Environ. Res. Public Health 2019, 16, 149; doi:10.3390/ijerph16010149     www.mdpi.com/journal/ijerph
Int. J. Environ. Res. Public Health 2019, 16, 149                                                    2 of 23

problems such as allergy and autism spectrum disorders have been found to be associated with traffic
air pollution [18,19].
      In Europe, the transport sector contributes approximately 15% of Particulate Matter (PM)
emissions and 41% nitrogen oxides (NOX ) emissions [20], and thus poses a significant threat to
children. In Ireland, road transport contributed 46% of NOX , 26% of PM2.5 , and 9% of PM10 in
2014 [21,22].
      Many strategies have been investigated which aim at addressing the aforementioned health
risks from transport sources and improving air quality. These have involved traffic management
strategies, vehicle fleet composition upgrades, land use, and infrastructure optimisation. Traffic
management strategies include implementing road or congestion pricing, setting up low emission
zones, executing vehicle operating restrictions, optimising traffic signal timing, changing speed limits,
encouraging eco-driving, providing pedestrian and bike facilities, and more. A recent review found
some limited evidence suggesting that these strategies can reduce total traffic emissions or improve
local air quality [23]. For example, increasing the number of electric vehicles in the fleet has been
shown to reduce the emissions of both CO2 and PM2.5 [24]. However, Tang et al. [25] illustrated that
traffic management strategies implemented in Dublin, Ireland, including changes to the heavy goods
vehicle management and road infrastructure, had both positive and negative impacts on air pollution
and greenhouse gas (GHG) emissions. Alam & McNabola [26,27] highlighted the limitations and
potential negative impacts of Eco-driving on fleet-wide emissions. Ghafghazi & Hatzopoulou [28]
found that traffic calming schemes (speed bumps) could increase both NO2 and NOX concentrations.
In addition, low emissions zones have been found to bring about positive effects on reducing PM10
and NO2 concentrations in Germany [29], whilst it had no clear effect on PM10 and NO2 concentrations
elsewhere [30]. As such, the impact of traffic management strategies on air quality is not always clear
and requires careful investigation. Moreover, research has found that both positive and negative
impacts can be brought about by similar strategies [23]. It was suggested that the impact of similar
strategies may vary from case to case. Therefore, the impacts of traffic management should be
scrutinized in each case.
      Since it is evident that traffic air pollution is harmful to human health, especially in children,
the impact of traffic management strategies on air quality near schools is worthy of investigation.
Reductions in speed limits near schools are commonly implemented for traffic safety reasons, yet the
air quality impact of this measure is unclear and not often considered.
      Traffic conditions are important for the accuracy of evaluating traffic management strategies. In
this paper, we utilized a traffic model and an emission and dispersion model to estimate the air quality
conditions in the vicinity of a school in Dublin (Ireland) across a particular year (2013, see below for
justification), based on traffic count records, background pollutant concentrations, meteorological
data, and the topography of the area near the school. We evaluated a number of traffic management
strategies that could have impacts on air quality near the school (i.e., different speed limit settings and
fleet changes). Predicted air quality impacts of traffic management changes were compared against
current conditions.
      Assessing the effect of these elements helps increase the awareness of policy makers as to the
extent to which these strategies influence air quality, and enables informed evaluation of whether it is
worthwhile to apply these strategies to improve children’s health.

2. Research Methodology
     A modelling chain approach was applied to evaluate the traffic and air quality conditions near a
school, and to estimate potential impacts of changes in speed limits and fleet composition on air quality.
The year 2013 was chosen for the analysis as it had the most complete and up to date dataset available.
The area selected for the case study contained a primary school (children aged 4–11) located in Dublin
City centre in Ireland (Figure 1). Road-side air quality monitoring has been conducted 200 m to the
east of the school as part of the fixed site air quality monitoring network within Dublin [31]. Section 2.1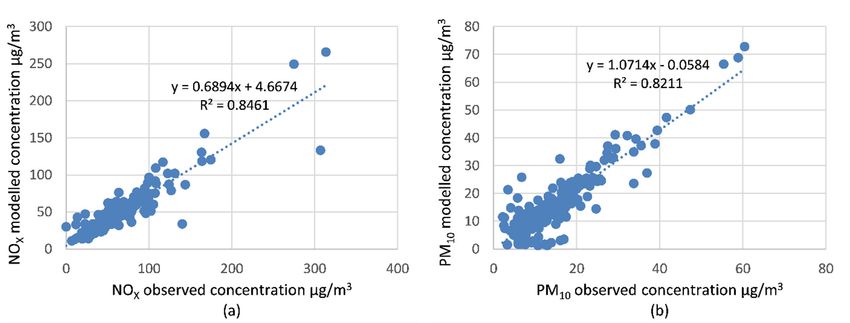
Int. J. Environ. Res. Public Health 2019, 16, 149                                                                             3 of 23

discusses      the
Int. J. Environ. Res.model   development
                     Public Health 2018, 15, and the data used for the estimation of air quality. Section
                                                                                                        3 of2.2
                                                                                                             22
describes the hypothetical scenarios that were used to estimate the impact of speed limit and fleet
Section 2.2 describes
composition       changes.the hypothetical scenarios that were used to estimate the impact of speed limit
and fleet composition changes.

                                                School
                                                                              Monitoring site

                     Figure 1. Modelled area. (Calibrated roads (red) and validated roads (cyan)).

2.1. Model Development
2.1. Model Development
       The
       The modelling
              modelling chain
                            chain comprised
                                     comprised aa traffic
                                                       traffic model
                                                                model andand an an emission
                                                                                    emission and and dispersion
                                                                                                        dispersion modelmodel (See
                                                                                                                                 (See
Figure    2). The  size  of  the  modelled     area  was   approximately       40 hectares.   A  primary
Figure 2). The size of the modelled area was approximately 40 hectares. A primary school was located         school    was   located
at
at the
   the centre
         centreof ofthe
                     themodelling
                          modellingarea.  area.This
                                                Thisarea
                                                       areawas
                                                             was chosen
                                                                    chosento to
                                                                              represent
                                                                                 representthethe
                                                                                               vicinity   of the
                                                                                                   vicinity        school,
                                                                                                              of the        andand
                                                                                                                        school,    the
traffic  and   air quality     conditions    around     the  school.    Distance–decay       studies    on
the traffic and air quality conditions around the school. Distance–decay studies on traffic air pollutant   traffic   air pollutant
concentrations
concentrations have  have found
                            found that
                                     that motorways
                                           motorways have  have impacts
                                                                  impacts on on concentrations
                                                                                 concentrations of   of NO     and PM
                                                                                                        NOXX and      PM typically
                                                                                                                           typically
up   to 200m    away    from    the  roadside   [6].  Roads    in  the city centre   generally    have
up to 200m away from the roadside [6]. Roads in the city centre generally have lower traffic volumes     lower     traffic volumes
than   motorways,      and   a  street  canyon   topography       is often  present,   which
than motorways, and a street canyon topography is often present, which concentrates the air    concentrates      the  air  pollution
and    prevents
pollution     and it  from dispersing
                    prevents                 freely. Therefore,
                                 it from dispersing                    roads in roads
                                                          freely. Therefore,      the cityin centre
                                                                                             the cityhavecentrea smaller     area of
                                                                                                                   have a smaller
influence     compared      to  motorways.      In addition,     many    pupils    of the  school
area of influence compared to motorways. In addition, many pupils of the school live within the      live within     the  modelled
area,
modelledand thus
              area,its
                     andairthus
                            quality    is crucial
                                  its air  qualityfor   their health.
                                                   is crucial    for their health.
       The
       The traffic model was developed in VISUM
             traffic model      was   developed     in  VISUM [32] [32] and
                                                                        and was
                                                                              was used
                                                                                    used toto assess
                                                                                               assess the
                                                                                                        the traffic
                                                                                                             traffic volume
                                                                                                                       volume andand
vehicle
vehicle speed on the road network. The traffic condition outputs from the traffic model were used
           speed   on  the  road    network.    The   traffic  condition    outputs    from  the   traffic model      were  used as as
an  important     input   to  the  emission   and   dispersion      model,  which    was
an important input to the emission and dispersion model, which was developed using the     developed     using    the  Operational
Street   Pollution
Operational           Model
                  Street        (OSPM)
                          Pollution        [33]. The
                                         Model   (OSPM)methodology
                                                              [33]. Thefor    emission calculations
                                                                          methodology        for emission and calculations
                                                                                                                emission factors  and
for
emission factors for different types of vehicles that were applied in OSPM wereEmission
     different   types   of vehicles    that were   applied    in  OSPM    were   based   on  the  European          based on Modelthe
COPERT4        [34].  The   study    focused    on  hourly    pollutant    concentration
European Emission Model COPERT4 [34]. The study focused on hourly pollutant concentration     predictions      across    a full year,
and    the implementation
predictions     across a full year,of a traffic
                                          and theassignment       model of
                                                     implementation        (VISUM)
                                                                               a trafficand   emissionmodel
                                                                                          assignment       calculation
                                                                                                                     (VISUM)methodand
based    on   hourly   average     speed    (COPERT4)       complied     with   the  objective
emission calculation method based on hourly average speed (COPERT4) complied with the objective   of  the study.     The  details   of
the   development       of  the  traffic  model,   and    the  emission    and    dispersion    model,
of the study. The details of the development of the traffic model, and the emission and dispersion         are  explained      in  the
following
model, aresubsections.
               explained in the following subsections.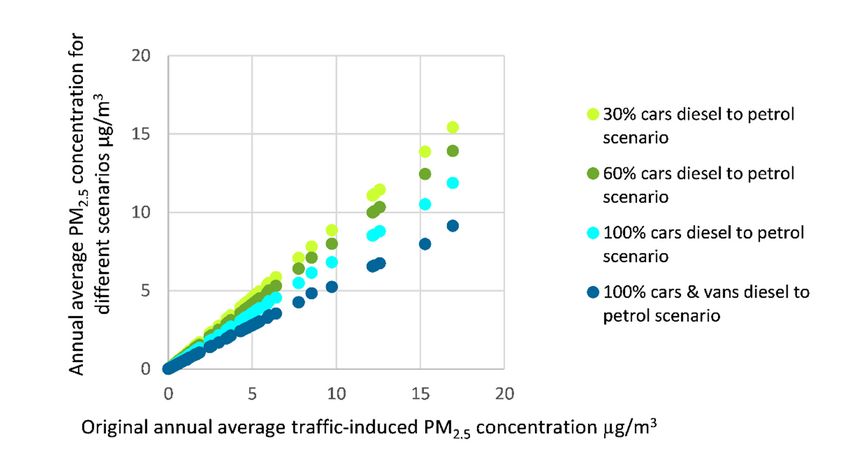
Int. J. Environ. Res. Public Health 2019, 16, 149 4 of 23
Int. J. Environ. Res. Public Health 2018, 15, 4 of 22
Figure 2.2. Schematic
Figure Schematic representation of the principal
principal modules of VISUM & OSPM
OSPM modelling
modelling chain.
(Adaptedfrom:
(Adapted from:Aquilina
Aquilina&&Micallef,
Micallef,2004
2004[35]).
[35]).
2.1.1.
2.1.1. Traffic
TrafficModel
Model
The
The flow
flow chart
chart ofof the
the traffic
trafficmodel
model isisillustrated
illustrated as as part
partof ofthe
themodelling
modelling chain chain in in Figure
Figure2. 2. The
The
traffic model estimated traffic volume and traffic speed based on speed
traffic model estimated traffic volume and traffic speed based on speed limit and traffic condition limit and traffic condition
inputs
inputs onon each
each road
road in in the
the network.
network. VISUM
VISUM was was chosen
chosen as as the
the traffic
traffic model
model because
because of of the
the flexibility
flexibility
to
to adjust traffic volume based on traffic count, and the ability to use Python script to control the
adjust traffic volume based on traffic count, and the ability to use Python script to control the
modelling
modelling process.
process.
The
The road
road network
network was was developed
developed in in VISUM
VISUM to to represent
represent the the roads
roads ofof the
the modelling
modelling area area shown
shown
in
in Figure 1. The original travel demand was presented as an OD matrix for the modelled area was
Figure 1. The original travel demand was presented as an OD matrix for the modelled area and and
derived fromfrom
was derived a traffic model
a traffic for the
model forcity,
the developed
city, developed by Tangby Tanget al. et[25]. This This
al. [25]. traffic model
traffic for the
model forcity
the
was
city obtained
was obtainedby extracting DublinDublin
by extracting city from
citythe National
from Transport
the National Model (NTpM)
Transport of Irelandofand
Model (NTpM) was
Ireland
calibrated with the annual
and was calibrated with the average
annualtraffic
averagecount records
traffic count ofrecords
2013 forofroads 2013 inforDublin.
roads in Dublin.
The
The original OD matrix was then calibrated with traffic count data throughout the
original OD matrix was then calibrated with traffic count data throughout the year
year 2013
2013 to to
obtain a more precise travel demand. The traffic count data were derived
obtain a more precise travel demand. The traffic count data were derived from hourly traffic counter from hourly traffic counter
data
data from
from Dublin
Dublin CityCity Council
Council (DCC).
(DCC). The The traffic
traffic conditions
conditions for for weekdays
weekdays during during ten ten months
months of of
2013—excluding
2013—excludingJuly JulyandandAugust—were
August—weremodelled modelledtotorepresent
represent the days
the days when
when thethe
traffic pollution
traffic pollution in
the modelled
in the modelled areaarea
werewereof most relevance
of most to pupils
relevance in the in
to pupils school (pupils(pupils
the school did notdid attend
not school
attendduring
school
weekends or in the summer holiday months of July and August).
during weekends or in the summer holiday months of July and August). The traffic model The traffic model was calibratedwas
using one week
calibrated usingofone hourly
weektraffic data traffic
of hourly from every two-month
data from period in 2013.
every two-month periodAnalysis
in 2013. was conducted
Analysis was
using a Python script because of the large amount of data involved in
conducted using a Python script because of the large amount of data involved in hourly travel data hourly travel data across a full
year. The traffic data involved in the calibration were chosen to be representative
across a full year. The traffic data involved in the calibration were chosen to be representative of of various traffic
conditions throughout
various traffic conditions the school year (i.e.,
throughout the they
schoolincluded all weekdays,
year (i.e., they included rainyalland sunny days,
weekdays, spring,
rainy and
autumn, and winter periods).
sunny days, spring, autumn, and winter periods).
During
During the the calibration
calibration process,
process, thethe original
original OD OD matrix
matrix was was assigned
assigned to to roads
roads to to obtain
obtain traffic
traffic
volumes using a user-equilibrium assignment approach. Then the
volumes using a user-equilibrium assignment approach. Then the assigned volumes were compared assigned volumes were compared
to
to traffic counts and
traffic counts and adjustments
adjustmentswere weremademadetotoOD OD matrices
matrices to to
obtainobtain
more more accurate
accurate results.
results. ThisThis
step
of the assignment of the OD matrix to roads, the comparison between the assigned volumes and
traffic counts, and the adjustment of the OD matrix was repeated several times to obtain an accurate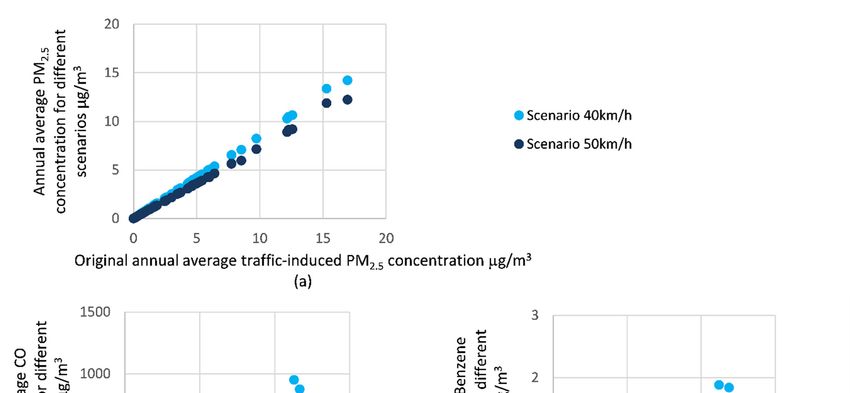
Int. J. Environ. Res. Public Health 2019, 16, 149                                                     5 of 23

step of the assignment of the OD matrix to roads, the comparison between the assigned volumes and
traffic counts, and the adjustment of the OD matrix was repeated several times to obtain an accurate
matrix to reflect the traffic condition for each hour corresponding to traffic count data. In this process,
traffic count data had to be set as an input to VISUM for each hour at several roads. A second Python
script was established to conduct this iterative process automatically. A validation process of the
traffic volume was performed after the calibration process. Hourly traffic count data for 600 h of 37
roads were derived from DCC, among which 35 were chosen for calibration and the remaining 2 were
reserved for validation. Roads that were calibrated and validated are indicated in Figure 1 with red
and cyan colours, respectively.
      The Geoff Havers (GEH) statistic was chosen to evaluate the validation. A guidance regulated in
the Design Manual for Roads and Bridges (DMRB) in the United Kingdom was chosen as the criteria
for the validation [36]. The calculation of GEH and the criteria is summarized in Table 1.

      Table 1. Validation criteria (Adapted from U.K. DMRB, [36]). In GEH calculation formula, M is the
      hourly traffic volume from the traffic model and C is the real-world hourly traffic count.

                              Measure                        Criteria                Guideline
                                r
                                                   2
                                      2( M − C )            GEH < 5                 >85% of cases
                          GEH =         M +C

     During the assignment process, the traffic volume on each road was determined not only by the
OD matrices but also influenced by the relationship between traffic volume and speed, which was
represented by a volume-delay function (VDF). A logistic form of the VDF was adopted as it was
found to be more accurate when applied to the prediction of speed measurements in this study, as
shown in Equation (1):
                                                         a
                                     tcur = t0 +                                                (1)
                                                  1 + f ·eb−d·sat
                      q
where sat = c·qmax , tcur represents travel time modelled, t0 represents the free flow travel time, q
represents the traffic volume, and qmax represents the road capacity. The values of the parameters in
Equation (1) are listed below:

                                             a = 0.1, b = 9, c = 2, d = 28, f = 1

    The comparison between the modelled and recorded traffic average speeds and the result of traffic
volume validation are presented in Section 3.1.

2.1.2. Dispersion and Emission Model
      The flow chart of the emission and dispersion model is also shown in Figure 2. The traffic
emissions were calculated in OSPM based on the predicted traffic flow in streets (vehicles/hour), the
traffic speed, and the emission factors at certain speeds for particular types of vehicles (g/vehicle/km).
Only the exhaust emissions were considered in this study.
      The fleet composition was derived from traffic count data and the Irish national fleet composition.
Fleet proportions for each category (e.g., cars, buses, and trucks) were derived from the count
data (across 2013) in Dublin city centre. Within each category, the percentages for each vehicle
sub-category (e.g., petrol > 2.0 l with PC Euro 3 and Diesel > 2.0 l with PC Euro 4) were assumed to be
in proportion with the Irish national fleet composition [37], following the same methodology applied
by [25]. Summarized fleet data are presented in Table 2. Further details of the fleet data are given in
Table A1 in the Appendix A. A 1% composition of benzene in petrol was assumed, in line with the EU
regulation [38].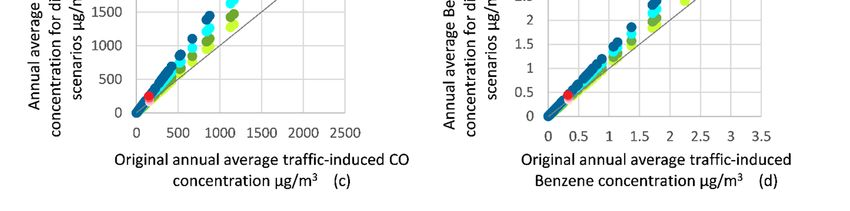
Int. J. Environ. Res. Public Health 2019, 16, 149                                                                                          6 of 23

                Table 2. Fleet data for each category and fuel type for different fleet change scenarios.

                                                Percentage in Each Category by Scenario (with Scenario Number Shown in Table 4)
   Category      % of Fleet      Fuel Type                         30% Diesel          60% Diesel           100% Diesel         100% Diesel
                                                Baseline          Cars to Petrol      Cars to Petrol        Cars to Petrol     Cars and Vans
                                                                       (iv)                (v)                   (vi)          to Petrol (vii)
   Passenger                      Petrol          63%                 74%                   85%                 100%                100%
                      82%
      car                         Diesel          37%                 26%                   15%                  0%                  0%
                                  Petrol        0.30%                 0.30%                0.30%               0.30%               100.00%
      Van             12%
                                  Diesel        99.70%               99.70%                99.70%              99.70%                0%
                                  Petrol           0                    0                    0                    0                   0
     Truck            1%
                                  Diesel         100%                 100%                 100%                 100%                100%
                                  Petrol           0                    0                    0                    0                   0
      Bus             5%
                                  Diesel         100%                 100%                 100%                 100%                100%

     Information on traffic conditions, which included the traffic volume and speed for each hour
of the year and fleet composition information, was developed using a third Python script to gather
information from the traffic model, and then formatted and inputted into OSPM.
     Besides emissions, other inputs to OSPM that influenced pollutant concentrations included road
and building geometry information, weather information and background pollutant concentration.
These data were obtained from Google Maps, the Irish meteorological service, and the air quality
monitoring network of the Environmental Protection Agency of Ireland, respectively. A summary of
these elements is shown in Table 3.

             Table 3. Input data for background concentration, building geometry and weather condition.

                                                             Descriptive Statistics
       Input Type               Element                                                                                Notes
                                                                               Standard
                                                        Mean
                                                                               Deviation
                                                                                                    Data source: PM10 monitoring site located
       Background                 PM10              13.58 µg/m3                    9.43
                                                                                                            at inner suburb in Dublin
      concentration
                                                                                                    Data source: NOX monitoring site located
                                  NOX               28.06 µg/m3                    38.37
                                                                                                               at a park in Dublin
                                 Building
   Building geometry        height/road width              0.98                    0.41                     Data source: Google Maps
                                  (H/W)
                                                                                                       Data source: the Irish meteorological
                               Wind speed            5.63 m/s                      2.86
                                                                                                                      service.
   Weather condition          Temperature               9.52 ◦ C                   5.46                Wind direction: Prevailing winds are
                            Relative humidity             0.82                     0.12                westerly and south-westerly winds

      In order to facilitate a holistic assessment of traffic emissions, the major harmful pollutants that
originate from traffic were included, namely NOX , PM10 , PM2.5 , CO, and Benzene. Regarding NOX ,
a special focus was given to the modelling concentrations of NO2 (in the Modelling results section),
as NO2 is a major pollutant concerning public health. The modelled concentrations consisted of a
background concentration component and a component arising from the local traffic in each road.
Whilst the impacts of speed limit and fleet composition changes on the concentrations of NOX , PM10 ,
PM2.5 , CO, and Benzene on each road were estimated, background concentrations were only available
for PM10 and NOX . Therefore, while total concentrations of NOX and PM10 were modelled, the
traffic-induced concentrations of PM2.5 , CO, and Benzene were modelled.
      In OSPM, concentrations of traffic emissions were calculated using a combination of a plume
model for the direct contribution of traffic pollution, and a box model for the recirculating part of the
pollutants in the street, taking street canyon geometry into account. The receptors (the points of which
pollutant concentrations were estimated) were set to be on the building face in the centre of each street
section at a height of 1.2 m. These street sections, with lengths of 80 m to 120 m, constituted the streets
shown in Figure 1. The reason that the receptor height was set to 1.2 m was because the age of children
in the school in the modelling area was in the range of 4 to 11, and the average height for children in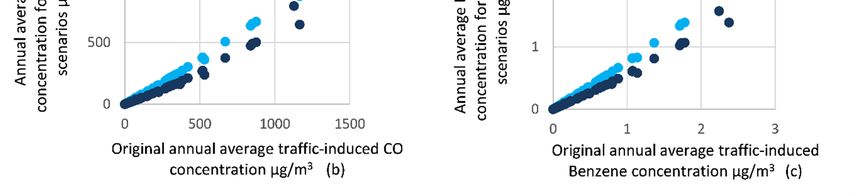
Int. J. Environ. Res. Public Health 2019, 16, 149                                                                     7 of 23

this age range is around 1.2 m in Ireland [39]. The receptor height of the street on which the air quality
monitoring site was located was set to 2m, the same height as the as the monitor.

2.2. Scenarios
     The air quality conditions estimated from the traffic counts in 2013 near the school were considered
as the baseline scenario. The air quality of hypothetical speed limit changes and fleet composition
changes were evaluated as alternative scenarios and compared to the baseline. The baseline scenario
and six hypothetical scenarios are summarized in Table 4.

                                                    Table 4. Scenarios information.

             Scenario Type                             Scenario                               Notes

                                      i.     30 km/h with Irish national        Reflection of the actual condition
                 Baseline                    fleet composition in 2013                        of 2013

                                      ii.    40 km/h                             Baseline fleet composition was
               Speed limit            iii.   50 km/h                            applied; speed limit was changed
                                                                                       for these scenarios.

                                      iv.    30% of diesel cars converting
                                             to petrol cars                     30 km/h speed limit was applied;
                                      v.     60% of diesel cars converting      detailed percentages of petrol and
                                             to petrol cars                     diesel vehicles for these scenarios
           Fleet composition          vi.    100% of diesel cars                  are shown in Table 2 with the
                                             converting to petrol cars          scenario number corresponding to
                                      vii.   100% of diesel cars and vans       each scenario number in this table.
                                             converting to petrol vehicles

      At present, diesel cars account for only 3% of total passenger vehicles in the United States and
less than 1% in China, whereas this is about 50% in Europe, and it is 45% in Ireland [37,40]. Compared
to petrol cars, diesel cars have better fuel economy than petrol-powered cars, thus their emission of
CO2 may be lower. However, diesel remains a major source of harmful pollutants (e.g., ozone-forming
gases, including NOX and PM) [40]. Therefore, in line with several recent proposals to reduce the
prevalence of this source of air pollution in European cities [41], this paper compares the impact on air
quality outside a school in an urban setting of converting diesel cars to comparable petrol cars.
      Also, Dublin City Council reduced the speed limit within the modelled area from 50 km/h to
30 km/h in 2009 because of road safety considerations within the city centre. This paper, therefore,
also assesses the impact of the speed change by modelling the impact of two hypothetical speed limits
on air quality.

3. Modelling Results

3.1. The Traffic Model

3.1.1. Volumes and Speeds
     The average modelled traffic volumes and speeds within the modelled area are summarised in
Figure 3, showing the average hourly traffic data and average speed for all road segments within the
baseline scenario (speed limits of 30 km/h) during different hours of the day. The average modelled
speed at AM peak hour (8 to 9 a.m.) and PM peak hour (5 to 6 p.m.) of 12 km/h and 21 km/h was very
similar to the measured average traffic speed in the city centre of 13 km/h and 19 km/h [42]. During
off-peak hours, the average modelled speed returned towards the relevant speed limit.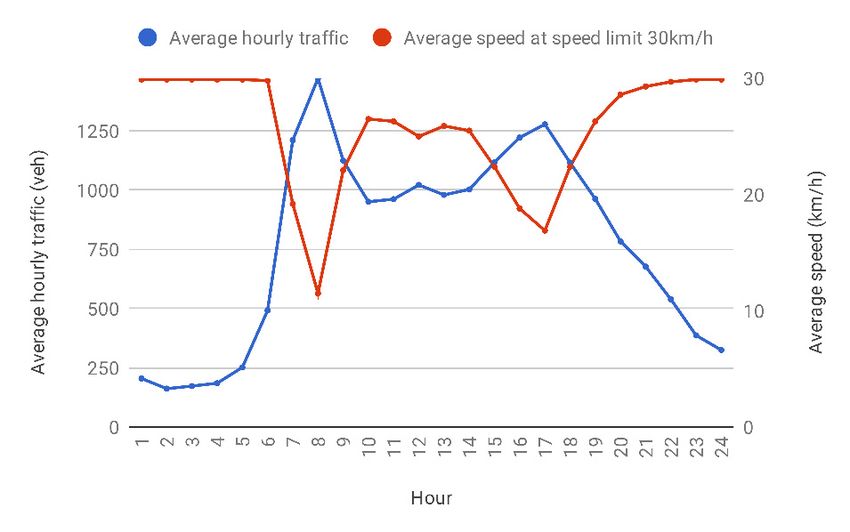
Int. J.
Int. J. Environ.
        Environ. Res.
                 Res. Public
                      Public Health
                             Health 2018, 16, 149
                                    2019, 15,                                                                   88 of
                                                                                                                   of 22
                                                                                                                      23

      Figure 3. The average hourly traffic and average speed at the speed limit of 30 km/h at different hours
      Figure 3. The average hourly traffic and average speed at the speed limit of 30 km/h at different hours
      of a day for all road segments across 2013.
      of a day for all road segments across 2013.
3.1.2. Result of Validation for Traffic Volumes
3.1.2. Result of Validation for Traffic Volumes
      A summary of validation results, using the GEH statistics approach, is presented in Table 5. The
     A summary
validation         ofthe
           satisfied  validation results,shown
                         DMRB criteria    using the GEH1,statistics
                                                in Table   resultingapproach,  is presented
                                                                      in a robust           in Table
                                                                                  model which        5. The
                                                                                               represented
validation  satisfied  the  DMRB    criteria shown   in  Table   1,
the travel demand after being calibrated using the recorded volumes.resulting  in  a robust  model   which
represented the travel demand after being calibrated using the recorded volumes.
                             Table 5. Summary of the result of traffic volume validation.
                             Table 5. Summary of the result of traffic volume validation.
                     # of Links and                                         # of Cases with     % of Cases
     Validation                          # of Hours        # of Cases
                     # ofTurns
                           Links and       # of     # of          # of Cases with
                                                                                GEH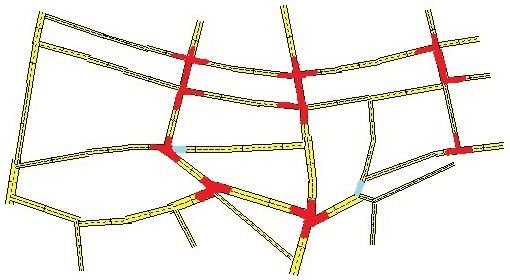
Int. J. Environ. Res. Public Health 2019, 16, 149 9 of 23
The modelled concentrations fitted the observed concentrations, with an R2 = 0.85 and 0.82 for
NOX and PM10 , respectively. The modelled PM10 concentrations had good accuracy, with a slope
of 1.07. However, the modelled NOX data underestimated the measured concentration, where the
slope was 0.69. Previous investigations have found similar underestimations of NOX using the OPSM
model [43].
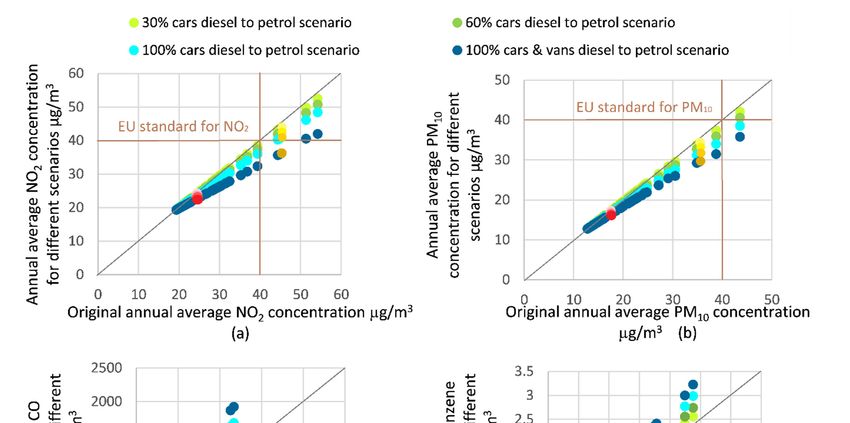
3.3. The Effect of Speed Limit Changes
The modelled impacts of speed limits on the total concentrations of NO2 and PM10 in each street
section in the modelled area are summarised in Figure 5a,b. Each individual data point in Figure 5
represents the concentration on a specific road link for the speed limit change scenarios compared
to the baseline scenario. The x-axis shows the baseline scenario concentration, and the y-axis shows
the concentrations for two speed limit scenarios. A 1:1 relationship between the baseline scenario
concentration and the speed limit change scenario is indicated with a grey diagonal line. A light red
dot and a dark red dot highlight two speed limit change scenarios for the road on which the school
is located. Traffic volumes, and consequently air pollution concentrations, on this street were less
Int. J. Environ. Res. Public Health 2018, 15, 10 of 22
than for the majority of road links in the rest of modelled area. The EU air quality standards for
annual
and 15% NOreduction
2 and PMof concentrations are
10 traffic-induced NOalso indicated with brown lines. The impact of speed limits
2 and PM10. These figures could be reduced by 15% and 12%,
on the traffic-induced concentrations of
respectively, on the street with higher original PM 2.5 , CO, and Benzene
pollutant are summarised
concentration in Figure
(corresponding A1a–c,
to 27% and
respectively, in the Appendix A.
19% reduction of traffic-induced NO2 and PM10).
Figure5.5.Predicted
Figure Predictedchange
changeinin(a)
(a)NO
NO2 2and
and(b)
(b)PM 1010total
PM totalstreet
streetconcentrations
concentrationson
oneach
eachroad
roadsegment
segment
ininthe
themodel
modeldomain
domainfor
forvarying
varyingspeed
speedlimits.
limits.
3.4. Figure 5 shows
The Effect of FleetaComposition
decline in both NO2 and PM10 concentration for scenarios with hypothetical
increases of speed limits from 30 km/h to 40 km/h and 50 km/h. The alteration of the speed limit
The impact of fleet composition on the total concentrations of NO2 and PM10 in each street is
from 30 km/h to 50 km/h could reduce NO2 by up to 18%, depending on the original concentration in
shown in Figure 6a,b, whilst the impact of fleet composition on the traffic-induced concentrations of
the street in the baseline scenario. This action could also reduce PM10 by up to 15%, also depending
CO and Benzene is shown in Figure 6c,d. Traffic-induced concentrations were estimated instead of
on the original concentration. The general trend shows that NO2 and PM10 concentrations could be
total concentration of CO and Benzene because of the absence of background concentration
reduced further for the streets that originally had higher NO2 and PM10 concentration. Regarding the
information for these gases. The impact of fleet composition on the traffic induced concentrations of
traffic-induced concentration, alteration of the speed limit from 30 km/h to 50 km/h could reduce
PM2.5 is shown in Figure A2 in the Appendix A.
these concentrations of NO2 and PM10 by 21% to 30% and 14% to 22%, respectively, depending on
In Figure 6, the x-axis shows the baseline scenario concentration, and the y-axis shows the
the street in question. As background concentration for different streets was assumed to be the same,
concentrations for four fleet composition change scenarios. Again, the grey diagonal line indicates
the higher the NO2 and PM10 concentration was on the street, the higher the pollutant concentration
the 1:1 relationship between the baseline scenario concentration and the fleet composition change
that was generated by traffic, and therefore, the speed limit change strategy that influences traffic
scenario. Brown lines show the EU standards for annual NO2 and PM10 concentration.
conditions would have a larger effect on the pollutant concentration.
Figure 6a,b show declines in NO2 and PM10 concentration for the modelled fleet composition
From Figure 5, for both NO2 and PM10 , we can see that there were several streets where the
change scenarios. This demonstrates that increasing the proportion of petrol vehicles can reduce the
original concentration was beyond the EU limit value, and this was predicted to reduce to below
NO2 and PM10 by up to 23% and up to 19%, depending on the street in question. This hypothetical
the limit as a result of the proposed speed changes. Therefore, the hypothetical speed limit changes
strategy can reduce the traffic-induced NO2 and PM10 by up to 35% and up to 28%, respectively. For
similar reasons as outlined above, the general trend for NO2 and PM10 concentrations was that they
could be reduced by a greater amount for the streets that originally had higher concentrations.
Among all these scenarios, including speed limit change scenarios, replacing all diesel cars and
vans with petrol cars and vans had the greatest predicted impact on NO2 and PM10 concentration.
The high original NO2 and PM10 concentration of several streets, which exceeded the EU limit value,Int. J. Environ. Res. Public Health 2019, 16, 149 10 of 23
modelled here would allow the pollutant concentrations on more streets to adhere to the EU air
quality standards.
As the school was located in a place with low traffic volumes and was thus less polluted, the
effect of the speed change on air quality was relatively small compared to other streets with heavier
pollution. Comparing the speed limit change impact in front of the school with a busier street (yellow
dots shown in Figure 5), the predicted concentrations of NO2 and PM10 could only be reduced by a
maximum of 3% and 2%, respectively, on the street in front of the school. This corresponded to a 22%
and 15% reduction of traffic-induced NO2 and PM10 . These figures could be reduced by 15% and 12%,
respectively, on the street with higher original pollutant concentration (corresponding to 27% and 19%
reduction of traffic-induced NO2 and PM10 ).
3.4. The Effect of Fleet Composition
The impact of fleet composition on the total concentrations of NO2 and PM10 in each street is
shown in Figure 6a,b, whilst the impact of fleet composition on the traffic-induced concentrations of
CO and Benzene is shown in Figure 6c,d. Traffic-induced concentrations were estimated instead of total
concentration of CO and Benzene because of the absence of background concentration information for
these gases. The impact of fleet composition on the traffic induced concentrations of PM2.5 is shown in
Int. J. Environ.
Figure A2 inRes.
thePublic Health 2018,
Appendix A. 15, 11 of 22
Figure 6. Predicted percentage change in (a) NO2 and (b) PM10 total street concentrations, and (c) CO
Figure 6. Predicted percentage change in (a) NO2 and (b) PM10 total street concentrations, and (c) CO
and (d) Benzene traffic induced concentrations on each road segment in the model domain for varying
and (d) Benzene traffic induced concentrations on each road segment in the model domain for varying
fleet compositions.
fleet compositions.
In Figure 6, the x-axis shows the baseline scenario concentration, and the y-axis shows the
Table 6. The
concentrations forimpact of fleet
four fleet composition
composition changes
change on the concentration
scenarios. of NO
Again, the grey 2 and PMline
diagonal 10 comparison
indicates the
between the
1:1 relationship street inthe
between front of the scenario
baseline school (indicated by redand
concentration dotsthe
in Figure 6) and a street
fleet composition with scenario.
change high
original pollutant concentration (indicated by yellow dots in
Brown lines show the EU standards for annual NO2 and PM10 concentration. Figure 6).
Street in Front A Street with High
Scenarios
of the School Original Concentration
NO2 22 µg/m3 45 µg/m3
Original concentration
PM10 14 µg/m3 35 µg/m3
Concentration with 30% diesel changing to petrol NO2 −1% (−5%) −3% (−5%)Int. J. Environ. Res. Public Health 2019, 16, 149 11 of 23
Figure 6a,b show declines in NO2 and PM10 concentration for the modelled fleet composition
change scenarios. This demonstrates that increasing the proportion of petrol vehicles can reduce the
NO2 and PM10 by up to 23% and up to 19%, depending on the street in question. This hypothetical
strategy can reduce the traffic-induced NO2 and PM10 by up to 35% and up to 28%, respectively. For
similar reasons as outlined above, the general trend for NO2 and PM10 concentrations was that they
could be reduced by a greater amount for the streets that originally had higher concentrations.
Among all these scenarios, including speed limit change scenarios, replacing all diesel cars and
vans with petrol cars and vans had the greatest predicted impact on NO2 and PM10 concentration. The
high original NO2 and PM10 concentration of several streets, which exceeded the EU limit value, as
shown in Figure 6a,b, could be reduced to below the limit value with the shifting of diesel vehicles to
petrol vehicles.
The effect of fleet composition change on the street in front of the school was relatively small
compared to other streets with heavier pollution (Table 6). Regarding the reduction of the concentration
of NO2 and PM10 on the street in front of school, the scenario of replacing all diesel cars and vans with
petrol vehicles was the most efficient, reducing the NO2 and PM10 pollution concentrations by 4% and
3%, respectively. When compared to the 3% and 2% reductions found for the scenario of increasing the
speed limit to 50 km/h, both interventions produced similar levels of impact.
Table 6. The impact of fleet composition changes on the concentration of NO2 and PM10 comparison
between the street in front of the school (indicated by red dots in Figure 6) and a street with high
original pollutant concentration (indicated by yellow dots in Figure 6).
Street in Front of A Street with High
Scenarios
the School Original Concentration
NO2 22 µg/m3 45 µg/m3
Original concentration
PM10 14 µg/m3 35 µg/m3
Concentration with 30% diesel changing to petrol cars NO2 −1% (−5%) −3% (−5%)
(change in traffic-induced concentration) PM10 −1% (−4%) −3% (−5%)
Concentration with 60% diesel changing to petrol cars NO2 −2% (−10%) −6% (−10%)
(change in traffic-induced concentration) PM10 −1% (−8%) −6% (−10%)
Concentration with 100% diesel changing to petrol cars NO2 −2% (−16%) −9% (−17%)
(change in traffic-induced concentration) PM10 −2% (−14%) −11% (−17%)
Concentration with 100% diesel changing to petrol cars NO2 −4% (−35%) −20% (−35%)
and vans (change in traffic-induced concentration) PM10 −3% (−22%) −16% (−26%)
Regarding the traffic-induced concentrations of CO and Benzene, Figure 6c,d depict that, in
general, increasing the proportion of petrol cars and vans would increase these concentrations
appreciably. Thus, in contrast to NO2 and PM10 , increasing the proportion of petrol vehicles would
exacerbate the CO and Benzene pollution. By changing all the diesel cars and vans to petrol cars
and vans, the traffic-induced concentration of CO would be increased by 65% at maximum. This
strategy would also increase traffic-induced Benzene concentration by 36% at maximum. The scenario
of changing diesel vehicles to petrol vehicles could increase the traffic-induced CO and Benzene
concentration at the school by 63% and 35%, respectively.
4. Discussion
This investigation showed that speed limits and fleet composition changes could have notable
impacts on the air quality. These scenarios could potentially affect the air quality at the location of the
school in question here, albeit to a lesser extent than they would affect the air quality along the more
polluted streets away from the school.
Regarding speed limits, the hypothetical increase of speed limits from 30 km/h to 50 km/h was
predicted to reduce the concentrations of all the pollutants examined here (i.e. NO2 , PM, CO, and
Benzene). Ghafghazi & Hatzopoulou [28] found that speed bumps that are used to reduce speeds
could lead to an increase in both NO2 and NOX concentrations in urban areas. Int Panis et al. [44]Int. J. Environ. Res. Public Health 2019, 16, 149 12 of 23
estimated that a speed limit change from 50 km/h to 30 km/h would increase NOX and PM emissions
by 2% to 5% and 3% to 8%, respectively, using the COPERT methodology. Carsten et al. [45] found that
PM and NOX would increase by 1% and 0.7% when the number of vehicles conforming to a speed limit
of 30 mph was increased. These results are in line with the results of the present study. Some studies
have also found a decrease in traffic emissions with speed limit changes from 50 km/h to 30 km/h in
Belgium, using microsimulation [44,46]. To date there have been few ex-post studies that can support
the conclusions made by the different analyses of speed limit changes, and clear-cut conclusions about
the impact of these strategies on air quality do not exist [23].
The results of this study also showed that for the streets that experienced more severe air pollution,
the changing of speed limits would have more impact on traffic-related air pollution. For example, EU
limit values could be achieved in some streets where the original pollutant concentration exceeded the
limit. Regarding the speed limit decrease from 50 km/h to 30 km/h introduced in 2009, this would not
have affected the children significantly in terms of the air quality health impacts as the school within
this study area is located along a less-busy, less-polluted street. However, this study does also indicate
that, for a busy and heavily polluted area, a strategy of decreasing the speed limit could potentially
lead to a reduction in air quality, with consequent implications for health.
In assessing the potential risks of vehicle speed to human health, it is necessary that all risks are
taken into account. In this respect, it is perhaps worth pointing out that air pollution is responsible for
a considerable amount of premature deaths worldwide. In Ireland in 2014, 193 people were killed in
road traffic accidents [47], while in the same year, air pollution was associated with 1510 premature
deaths [48]. However, transport is only one of many contributors to this figure. Therefore, it does
not necessarily suggest that the influence of air pollution on human health outweighs that of traffic
accidents. On the other hand, in terms of the relationship of speed limit and car accidents, a review
suggests that “studies of the effectiveness of school zone limits have generally found poor driver
compliance, particularly when the limits are set very low, and no relationship between pedestrian
crashes and the special limits” [49].
In this study, measured traffic count data and speed records were used in the calibration and
validation of the model. This enabled the traffic strategies being assessed to be based on the traffic
conditions of Dublin in 2013. The emission calculation method used in the study is based on average
speeds, which, although complying with the objective and time-scale scope of the study, restricted the
evaluation of the impacts of acceleration and deceleration on traffic emission. The driving cycles that
are adopted to develop the COPERT emission factors include the condition of driving in real urban
roads, which infers that these EFs incorporate the emission related to acceleration and deceleration
to some extent. However, changes that may be brought about in the amount of acceleration and
deceleration occurring as a result of changes in speed limits are not fully captured using this approach.
In order to quantify the instantaneous impacts of speed limit changes on emissions in more detail
in future, a traffic micro-simulation would be required. However, such micro-simulations are often
limited in their size of study area and length of time scale which can be covered, limiting the results
of such investigations in contrast to the current approach. The current approach was based on the
average speed in every hour of 2013 for the entirety of Dublin city, and as such was focused on the
longer-term impacts of these traffic strategies over a large area.
The health impact of the traffic emissions resulting from reducing speed limits should be taken
into consideration, especially for schools located on busy roads. In contrast, outside an urban setting,
road transport may contribute significantly less than other sources of air pollution to total exposure,
and in such circumstances a speed limit reduction would be especially beneficial.
As petrol and diesel vehicles are still dominant in the fleet, and will be for some time, and there is
no alternative that can replace these two types of vehicles worldwide in the short-term, it is worthwhile
to evaluate these two types of vehicles in terms of their impact on air quality. Also, the emission change
estimation of the fleet conversion to hybrid or electric is worthy of research in the future in line with
the development and roll-out of this technology.Int. J. Environ. Res. Public Health 2019, 16, 149 13 of 23
For different air pollutants, the effects of the changes of speed limit and the fleet composition
were different. Increasing the proportion of petrol vehicles could reduce the on-street concentration of
NO2 and PM, but this strategy would lead to a rise in the concentration of CO and Benzene. Thus,
although the most significant modelling result for reducing the pollution of NO2 and PM was obtained
by replacing all diesel cars and vans with petrol cars and vans, when considering the pollution of CO,
benzene, and other pollutants that were not covered by our paper, this strategy appears inconclusive,
with positive and negative impacts. Policy makers should take as many pollutants as possible into
account in order to make a full assessment of the advantages and disadvantages of using petrol and
diesel cars. The results of this study highlight that the incentivisation of one fossil fuel type over
another has advantages and disadvantages. The negative impacts of dieselisation of the European
vehicle fleet are well publicized [50]. However, a similar incentivisation of petrol engines would
have resulted in problems of a different nature. Determining which policy is effective in tackling
traffic-related health impacts should involve a health impact assessment to quantify the impact of
increases and decreases in different pollutants with different levels.
Similar to the effect of changing speed limits, for the streets that experienced more severe air
pollution, the strategies of increasing the proportion of petrol cars were more effective in dealing with
NO2 and PM pollution. The improvement in air quality of implementing different traffic management
strategies depends on how much the traffic contributes to the air pollution. Therefore, cities with
severe traffic pollution will receive larger benefits when applying these traffic air pollution reduction
strategies than those found in Dublin, where air quality is relatively good.
5. Conclusions
This study analysed several strategies and related factors that could affect air pollution in a city
centre near a school. Real traffic count data were applied and several vehicle fleet and speed limit
scenarios were modelled. The results showed that both strategies can influence the traffic-induced
air pollutant concentrations significantly. Changing diesel cars and vans to petrol cars and vans had
both advantages and disadvantages; this strategy would lead to benefits in terms of reducing NO2 and
PM pollution, but would increase the pollution from CO and Benzene. Thus, it is overly simplistic
to provide incentives for using either petrol or diesel vehicles. Policy makers should seek to strike
an appropriate balance of both in the fleet at present. Looking to the future, strategies should be
implemented that are aimed at phasing out both types of vehicles and replacing these with e.g. electric
vehicles or hybrid vehicles.
Decreasing speed limits near a school, although justified in terms of road safety, was shown to
have potentially negative impacts in terms of air quality, especially for streets that are heavily polluted;
thus, these impacts should be considered and balanced with the benefits to safety brought about by
reducing the speed limit.
Author Contributions: Conceptualization, J.T., A.M., B.M., and F.P.; methodology, J.T., A.M., and B.M.; software,
J.T.; validation, J.T.; formal analysis, J.T.; investigation, J.T.; resources, J.T., A.M., B.M., F.P., and M.S.A.; data
curation, J.T.; writing—original draft preparation, J.T.; writing—review and editing, A.M., B.M., F.P., and M.S.A.;
visualization, J.T., A.M., and B.M.; supervision, A.M. and B.M.; project administration, A.M. and B.M.; funding
acquisition, A.M. and B.M.
Funding: This research was funded by Trinity College Dublin.
Acknowledgments: The authors would like to acknowledge the financial supports from Trinity College Dublin.
The Irish National Roads Authority, Dublin City Council, and Irish Environmental Protection Agency are
acknowledged for providing modelling data and air monitoring data, as well as the PTV company for the
software and their technical support.
Conflicts of Interest: The authors declare no conflict of interest.Int. J. Environ. Res. Public Health 2019, 16, 149 14 of 23
Appendix A
Table A1. Irish fleet data in 2013 (source: Duffy et al., 2015).
Sector Subsector Technology Vehicle # in 2013
Passenger Cars Gasoline 0.8–1.4 l PRE ECE 0
Passenger Cars Gasoline 0.8–1.4 l ECE 15/00-01 0
Passenger Cars Gasoline 0.8–1.4 l ECE 15/02 0
Passenger Cars Gasoline 0.8–1.4 l ECE 15/03 0
Passenger Cars Gasoline 0.8–1.4 l ECE 15/04 949
Passenger Cars Gasoline 0.8–1.4 l Open Loop 0
Passenger Cars Gasoline 0.8–1.4 l PC Euro 1–91/441/EEC 7739
Passenger Cars Gasoline 0.8–1.4 l PC Euro 2–94/12/EEC 201,061
PC Euro 3–98/69/EC
Passenger Cars Gasoline 0.8–1.4 l 276,634
Stage2000
PC Euro 4–98/69/EC
Passenger Cars Gasoline 0.8–1.4 l 251,944
Stage2005
Passenger Cars Gasoline 0.8–1.4 l PC Euro 5–EC 715/2007 39,297
Passenger Cars Gasoline 0.8–1.4 l PC Euro 6–EC 715/2007 0
Passenger Cars Gasoline 1.4–2.0 l PRE ECE 0
Passenger Cars Gasoline 1.4–2.0 l ECE 15/00-01 0
Passenger Cars Gasoline 1.4–2.0 l ECE 15/02 0
Passenger Cars Gasoline 1.4–2.0 l ECE 15/03 0
Passenger Cars Gasoline 1.4–2.0 l ECE 15/04 504
Passenger Cars Gasoline 1.4–2.0 l Open Loop 0
Passenger Cars Gasoline 1.4–2.0 l PC Euro 1–91/441/EEC 4434
Passenger Cars Gasoline 1.4–2.0 l PC Euro 2–94/12/EEC 106,786
PC Euro 3–98/69/EC
Passenger Cars Gasoline 1.4–2.0 l 146,907
Stage2000
PC Euro 4–98/69/EC
Passenger Cars Gasoline 1.4–2.0 l 136,307
Stage2005
Passenger Cars Gasoline 1.4–2.0 l PC Euro 5–EC 715/2007 21,812
Passenger Cars Gasoline 1.4–2.0 l PC Euro 6–EC 715/2007 0
Passenger Cars Gasoline > 2.0 l PRE ECE 0
Passenger Cars Gasoline > 2.0 l ECE 15/00-01 0
Passenger Cars Gasoline > 2.0 l ECE 15/02 0
Passenger Cars Gasoline > 2.0 l ECE 15/03 0
Passenger Cars Gasoline > 2.0 l ECE 15/04 33
Passenger Cars Gasoline > 2.0 l PC Euro 1–91/441/EEC 425
Passenger Cars Gasoline > 2.0 l PC Euro 2–94/12/EEC 7055
PC Euro 3–98/69/EC
Passenger Cars Gasoline > 2.0 l 9699
Stage2000Int. J. Environ. Res. Public Health 2019, 16, 149 15 of 23
Table A1. Cont.
Sector Subsector Technology Vehicle # in 2013
PC Euro 4–98/69/EC
Passenger Cars Gasoline > 2.0 l 9733
Stage2005
Passenger Cars Gasoline > 2.0 l PC Euro 5–EC 715/2007 1723
Passenger Cars Gasoline > 2.0 l PC Euro 6–EC 715/2007 0
Passenger Cars Diesel 1.4–2.0 l Conventional 182
Passenger Cars Diesel 1.4–2.0 l PC Euro 1–91/441/EEC 1452
Passenger Cars Diesel 1.4–2.0 l PC Euro 2–94/12/EEC 38,544
PC Euro 3–98/69/EC
Passenger Cars Diesel 1.4–2.0 l 132,268
Stage2000
PC Euro 4–98/69/EC
Passenger Cars Diesel 1.4–2.0 l 288,016
Stage2005
Passenger Cars Diesel 1.4–2.0 l PC Euro 5–EC 715/2007 160,045
Passenger Cars Diesel 1.4–2.0 l PC Euro 6–EC 715/2007 0
Passenger Cars Diesel > 2.0 l Conventional 26
Passenger Cars Diesel > 2.0 l PC Euro 1–91/441/EEC 209
Passenger Cars Diesel > 2.0 l PC Euro 2–94/12/EEC 5545
PC Euro 3–98/69/EC
Passenger Cars Diesel > 2.0 l 19,029
Stage2000
PC Euro 4–98/69/EC
Passenger Cars Diesel > 2.0 l 41,435
Stage2005
Passenger Cars Diesel > 2.0 l PC Euro 5–EC 715/2007 23,025
Passenger Cars Diesel > 2.0 l PC Euro 6–EC 715/2007 0
Passenger Cars LPG Conventional 0
Passenger Cars LPG PC Euro 1–91/441/EEC 72
Passenger Cars LPG PC Euro 2–94/12/EEC 57
PC Euro 3–98/69/EC
Passenger Cars LPG 57
Stage2000
PC Euro 4–98/69/EC
Passenger Cars LPG 57
Stage2005
Passenger Cars LPG PC Euro 5–EC 715/2007 0
Passenger Cars LPG PC Euro 6–EC 715/2007 0
PC Euro 4–98/69/EC
Passenger Cars Hybrid Gasoline < 1.4 l 0
Stage2005
PC Euro 4–98/69/EC
Passenger Cars Hybrid Gasoline 1.4–2.0 l 0
Stage2005
PC Euro 4–98/69/EC
Passenger Cars Hybrid Gasoline > 2.0 l 0
Stage2005
Light Commercial
Gasoline < 3.5 t Conventional 4
Vehicles
Light Commercial
Gasoline < 3.5 t LD Euro 1–93/59/EEC 28
Vehicles
Light Commercial
Gasoline < 3.5 t LD Euro 2–96/69/EEC 101
Vehicles
Light Commercial LD Euro 3–98/69/EC
Gasoline < 3.5 t 236
Vehicles Stage2000Int. J. Environ. Res. Public Health 2019, 16, 149 16 of 23
Table A1. Cont.
Sector Subsector Technology Vehicle # in 2013
Light Commercial LD Euro 4–98/69/EC
Gasoline < 3.5 t 292
Vehicles Stage2005
Light Commercial LD Euro 5–2008
Gasoline < 3.5 t 78
Vehicles Standards
Light Commercial
Gasoline < 3.5 t LD Euro 6 0
Vehicles
Light Commercial
Diesel < 3.5 t Conventional 1441
Vehicles
Light Commercial
Diesel < 3.5 t LD Euro 1–93/59/EEC 10,951
Vehicles
Light Commercial
Diesel < 3.5 t LD Euro 2–96/69/EEC 39,482
Vehicles
Light Commercial LD Euro 3–98/69/EC
Diesel < 3.5 t 92,220
Vehicles Stage2000
Light Commercial LD Euro 4–98/69/EC
Diesel < 3.5 t 113,834
Vehicles Stage2005
Light Commercial LD Euro 5–2008
Diesel < 3.5 t 30,260
Vehicles Standards
Light Commercial
Diesel < 3.5 t LD Euro 6 0
Vehicles
Heavy Duty Trucks Gasoline >3.5 t Conventional 24
Heavy Duty Trucks Rigid ≤ 7.5 t Conventional 108
HD Euro I–91/542/EEC
Heavy Duty Trucks RigidInt. J. Environ. Res. Public Health 2019, 16, 149 17 of 23
Table A1. Cont.
Sector Subsector Technology Vehicle # in 2013
HD Euro II–91/542/EEC
Heavy Duty Trucks Rigid 12–14 t 754
Stage II
HD Euro III–2000
Heavy Duty Trucks Rigid 12–14 t 1761
Standards
HD Euro IV–2005
Heavy Duty Trucks Rigid 12–14 t 2173
Standards
HD Euro V–2008
Heavy Duty Trucks Rigid 12–14 t 572
Standards
Heavy Duty Trucks Rigid 12–14 t HD Euro VI 0
Heavy Duty Trucks Rigid 14–20 t Conventional 43
HD Euro I–91/542/EEC
Heavy Duty Trucks Rigid 14–20 t 114
Stage I
HD Euro II–91/542/EEC
Heavy Duty Trucks Rigid 14–20 t 487
Stage II
HD Euro III–2000
Heavy Duty Trucks Rigid 14–20 t 1137
Standards
HD Euro IV–2005
Heavy Duty Trucks Rigid 14–20 t 1403
Standards
HD Euro V–2008
Heavy Duty Trucks Rigid 14–20 t 370
Standards
Heavy Duty Trucks Rigid 14–20 t HD Euro VI 0
Heavy Duty Trucks Rigid 20–26 t Conventional 0
HD Euro I–91/542/EEC
Heavy Duty Trucks Rigid 20–26 t 0
Stage I
HD Euro II–91/542/EEC
Heavy Duty Trucks Rigid 20–26 t 1
Stage II
HD Euro III–2000
Heavy Duty Trucks Rigid 20–26 t 3
Standards
HD Euro IV–2005
Heavy Duty Trucks Rigid 20–26 t 4
Standards
HD Euro V–2008
Heavy Duty Trucks Rigid 20–26 t 1
Standards
Heavy Duty Trucks Rigid 20–26 t HD Euro VI 0
Heavy Duty Trucks Rigid 26–28 t Conventional 0
HD Euro I–91/542/EEC
Heavy Duty Trucks Rigid 26–28 t 0
Stage I
HD Euro II–91/542/EEC
Heavy Duty Trucks Rigid 26–28 t 1
Stage II
HD Euro III–2000
Heavy Duty Trucks Rigid 26–28 t 3
Standards
HD Euro IV–2005
Heavy Duty Trucks Rigid 26–28 t 4
Standards
HD Euro V–2008
Heavy Duty Trucks Rigid 26–28 t 1
Standards
Heavy Duty Trucks Rigid 26–28 t HD Euro VI 0You can also read