NATIONAL INDOOR AIR QUALITY ACTION PLAN - Version 1 - Interreg Central Europe
←
→
Page content transcription
If your browser does not render page correctly, please read the page content below
NATIONAL INDOOR AIR QUALITY
ACTION PLAN

                          Version 1
Hungary
                              2018
Indice
A.       INTRODUCTION ............................................................................ 3
B.  PRIMARY SCHOOL EDUCATION AND THE STATE OF SCHOOL BUILDINGS IN
HUNGARY .......................................................................................... 4
C.       POLICIES ON THE INDOOR ENVIRONMENT IN SCHOOL BUILDINGS ................ 8
D.       SWOT ANALYSIS ......................................................................... 12
E.       OUTDOOR AIR POLLUTION IN HUNGARY ............................................ 18
F.       REVIEW OF INDOOR AIR QUALITY DATA............................................. 23
G.       CHARACTERIZATION OF THE HEALTH IMPACT OF INDOOR AIR QUALITY ..... 25
H.   THE MONITORING CAMPAIGN CARRIED OUT WITHIN THE INAIRQ PROJECT
(2017-2018) ..................................................................................... 28
I.     INDOOR AIR QUALITY ACTION PLAN FOR HUNGARY ................................ 34
     CAPACITY BUILDING TRAININGS .................................................................. 36
     MONITORING CAMPAIGN ......................................................................... 36
     AWARENESS RAISING ............................................................................ 36
     LEGISLATIONS ................................................................................... 37
ANNEX 1. CHECKLIST AND QUESTIONNAIRE ABOUT THE CLASSROOM (EXAMPLE) .. 43
ANNEX 2. CHECKLIST AND QUESTIONNAIRE ABOUT THE SCHOOL BUILDING
(EXAMPLE) ....................................................................................... 52

                                                                                                           2
A. Introduction

Indoor air quality (IAQ) in primary school buildings is of great importance as children
spend approximately 6-8 h daily in the school enviroment. IAQ measurements have
already been performed in the frame of international projects (i.e. SEARCH and
SINPHONIE) in Hungary. In total, 16 school buildings were investigated before 2012.
Some questions have already been answered regarding the indoor (school) environment;
however, there are still several unanswered questions. In order to solve IAQ-related
problems related to primary school buildings, a national IAQ action plan has to be
elaborated. It helps to integrate activities that affect the IAQ into the system's normal
use, management and maintenance. The aim is to create a healthier indoor
environment by improving IAQ through reducing or eliminating the sources of air
pollutants and setting rules or preventive measures.

The preparation of the national action plan is based on the Joint Transnational Strategy
for Indoor Air Quality Action Plans developed within the InAirQ project. Integral parts
of the strategy are the vulnerability assessment, the SWOT analysis and the
environmental and health surveillance methods. Based on the methods applied for
baselining and the results of the IAQ monitoring campaigns, recommendations are
suggested.

The extent of air pollution in the building of a school depends on the interaction
between the building and its external environment, as well as the way the building was
built, what kind of building material were used, how it is equipped and how it is used.
Thus, the national IAQ action plan must focus on different target groups including policy
makers, national bodies responsible for the maintenance of the school, teacher, parents
and architects.

Recently, there is no consensus on how to regulate IAQ worldwide. There is a big effort
to establish IA guidelines at national level in Hungary. Regulations might have a positive
effect on IAQ.

                                                                                        3
B. Primary school education and the state of school
buildings in Hungary

There are several national institutes and national bodies which collect and synthetize
data on education in Hungary. The latest statistical data on public education can be
found in the Statistical Mirror of the Central Statistical Office for 2016/2017 and from
“Statistical Yearbook of Public Education 2016/2017” published by the Ministry of
Human Capacities in 2018 and it contains mostly basic information.

In the school year of 2016/2017 approximately 741 000 students attended primary
schools. Education for children usually takes 8 years (grades 1 to 8; from age 6 to age
14) in primary schools in Hungary. However, students can apply for long secondary
programs which means that grades 5 to 8 or grades 7 and 8 can be completed in the
eight-grade or six-grade general secondary school respectively. Approximately 25 000
students studied in grades 5 to 8 in long secondary programs in secondary schools. The
number of students in primary schools in 2016/2017 decreased by 35.4% compared to
the number of students in the school year of 1980/1981 which is in line with the changes
in the demographic features of Hungary. Approximately 74 000 teachers were working
full- or part-time in primary schools in the school year of 2016/2017. In contrast to the
considerable change in the number of students, only a slight decrease (6.2%) could be
observed in the number of teachers in the past 25 years. The student/teacher ratio was
10% in the school year of 2016/2017 with an average class size of 20.2. The number of
institutes for primary education was 3 589 in 2016/2017. Approximately 36 500
classrooms were counted in the primary schools in the school year of 2016/2017. The
state is responsible for providing public education, thus most of the schools (81.0%) are
maintained by the state (e.g., Klebelsberg Institute Maintenance Centre, public bodies)
(Figure 1). However, the contribution of other participants such as churches (14.6%) to
the maintenance is also considerable. Nowadays, there are more and more primary
schools which are being taken over by churches. Accordingly, the amount of financial
support for reconstruction works can differ significantly among the schools.

                                                                                       4
Klebelsberg Institute Maintenance Centre

                           2,6% 1,7%

                                                            Public bodies, public higher education
                                                            institutes
                   14,6%
          1,3%
                                                            Other public
          1,4%

                                                            Church, denomination

                                         78,3%
                                                            Foundation, private

                                                            Other

                               Figure 1. Maintainer of the school

To the best of our knowledge, there is no statistical data on the age of the primary
school buildings. However, it must be noted that the year of construction of the
educational buildings varies considerably. The school construction activity was the most
intense between 1950 and 1990; however, lots of primary school buildings were built
before 1900. The school buildings can be grouped into different types according to their
year of construction (Table 1). Each group has its own building characteristics; they
differ in the building materials used, dimensions of the classrooms or energy
consumption.

                                                                                                       5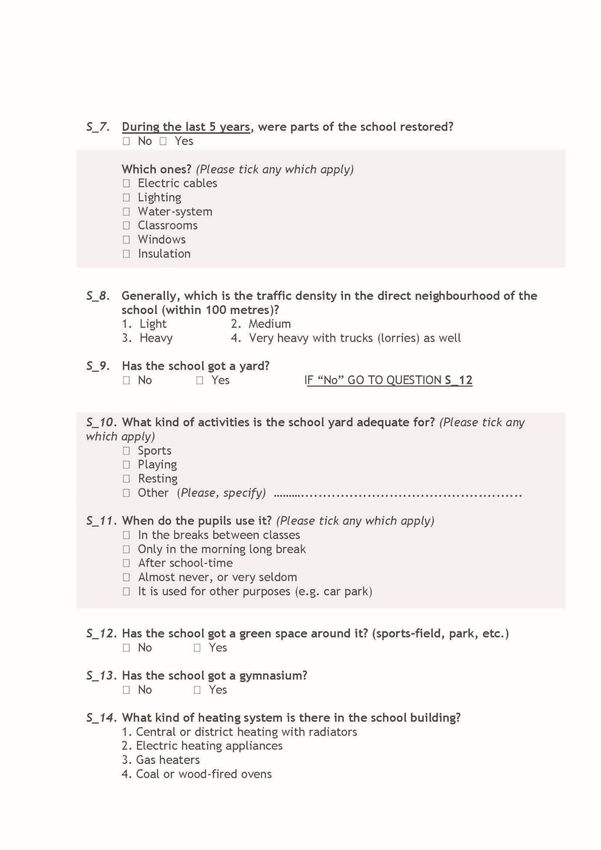
Table 1. Typology of school buildings (Source: National Building Energy Performance Strategy)

 Year of construction    Type of building

 before 1900             3-storey regular-shaped school building
                         2-storey U-shaped school building
 1900-1945               3-storey regular-shaped school building
                         2-storey U-shaped school building
 1946-1979               School building from the 1950s built in the socialist realist style
                         School building from the 1970s built from self-supporting prefabricated
                         panels
 1980-1989               3-storey regular-shaped school building
                         2-storey U-shaped school building
 after 1990              3-storey regular-shaped school building
                         2-storey U-shaped school building

In general, most of the school buildings were in bad condition in the 1990s. In the past
decade, funds (e.g., energy efficiency programs) made some renovation works possible
including the replacement of windows and/or the modernization of lighting, insulation
and heating. Recently, a greater number of renovation works are in process since some
more funds are available. Primary school buildings maintained by churches or
foundations are generally in better condition due to the higher amount of financial
support provided by the maintainer, while state school buildings still need renovation
in many fields (e.g., water-system, electric cables and furniture). The state provided
financial support mostly to improve the educational tools (e.g., new computers and
boards) and less support remained for the renovation works. In addition, the duration
of these works usually takes longer in the case of school buildings maintained by the
state. Accordingly, the renovation work is often carried out during the school term in
the case of school buildings maintained by the state and, consequently, students might
be exposed to higher level of noise and air pollution. Natural ventilation is used in the
primary schools in Hungary which requires the good practice of windows opening in
order to avoid high carbon dioxide concentration values indoors.

Besides the renovation works carried out during the school term, there are other
potential sources of air pollution as well as factors which might have an influence on
children`s health and well-being.

                                                                                                   6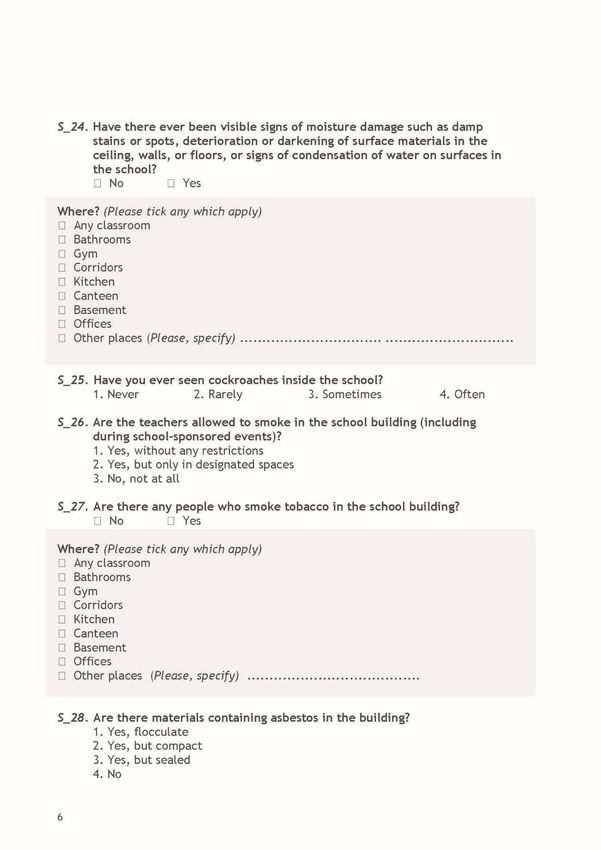
School buildings built prior to the 1980s might contain water-pipe systems made of lead.
Lead can leach from the pipe into the drinking water and might cause adverse health
effects even at low concentration levels. Lead is particularly dangerous to children
because their growing bodies absorb more lead than adults do and their brains and
nervous systems are more sensitive to the damaging effects of lead.

Asbestos was a frequently used material during the construction of buildings mainly
between 1970 and 1985. There might be several primary school buildings in Hungary
which still contain asbestos. Exposure to asbestos fibers is associated with respiratory
diseases including mesothelioma. The risk associated with asbestos in the indoor
environment is still not investigated in Hungary.

The selection of new flooring material and furniture has to be done with care during
renovation works. Several consumer/building products emit volatile organic compounds
which might cause sensory irritation in the eyes and airways and deterioration of
performance. Recently, the replacement of old windows to airtight ones in the primary
schools could lead to the reduction of energy used for heating; however, the
concentration of indoor air pollutants (e.g., volatile organic compounds, carbon
dioxide) might be higher due to the lower air exchange rates. In addition, several
windows cannot be opened because they are either fixed or dangerous (poor quality).

Several primary school buildings were built at sites which are characterized by
significant air pollution and noise level. The proximity of busy roads is one of the most
important determinants of air quality and noise level. Easy access through major roads
and public transport was probably one of the most important parameters that people
take into consideration when the school buildings were built. Accordingly, actions
should be taken in order to decrease the concentration of air pollutants outdoors and
the noise level around the primary school buildings.

Further information on the primary school buildings can also be found in the National
Survey of Children’s Respiratory Health reports prepared by the National Public Health
Center in 2005 and 2010. Both surveys were carried out in all primary schools in
Hungary. New data will be collected in 2017 during a nationwide survey.

                                                                                       7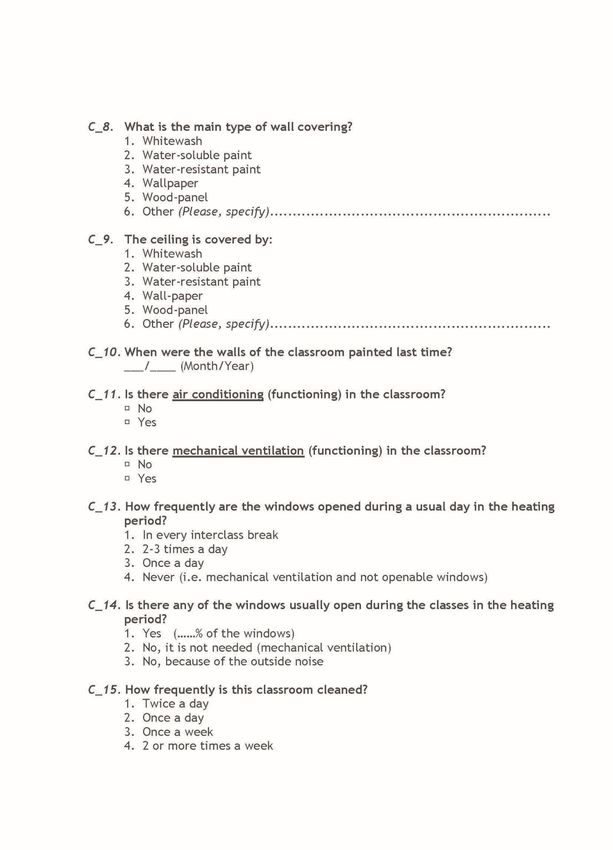
C. Policies on the indoor environment in school buildings
One of the main purposes of the vulnerability assessment was to review the existing
policies, i.e. officially adopted documents on the indoor environment. Based on the
type of policy, legally binding standards or regulations, legally non-binding
recommendations or guidelines as well as action plans or programs are distinguished.
Furthermore, policies exist at different levels such as international, national and sub-
national (regional) levels. International bodies have developed several regulations and
guidelines on selected air pollutants outdoors; however, there are still no regulations
on the concentration of air pollutants indoors. In 2010, the World Health Organization
(WHO) published a book (“WHO guidelines for indoor air quality: selected pollutants”)
in which some common indoor air pollutants are reviewed and guidelines are
recommended. Besides the international bodies, there is a big effort to establish IAQ
guidelines at national or at sub-national levels in several countries all over the world.
The WHO collected the relevant information by the “Environment and health policy
action questionnaire” from the member states and the results of the work were
published in late 2014.

In Hungary, the National Public Health Center is responsible for (i) highlighting that
adequate IAQ is needed in the classrooms, (ii) investigating both the IAQ and the health
of the schoolchildren and (iii) encouraging policy makers to develop national strategies.
Recently, there is no consensus on how to regulate IAQ in school buildings in Hungary.
A draft Ministerial Order has already been developed by the National Public Health
Center in the past decade and its latest version has already been submitted to the
Ministry of Human Capacities for harmonization and adoption is expected in 2020. The
indoor air pollutants covered by this draft Ministerial Order as well as the recommended
limit values and averaging periods are listed in Table 2.

                                                                                       8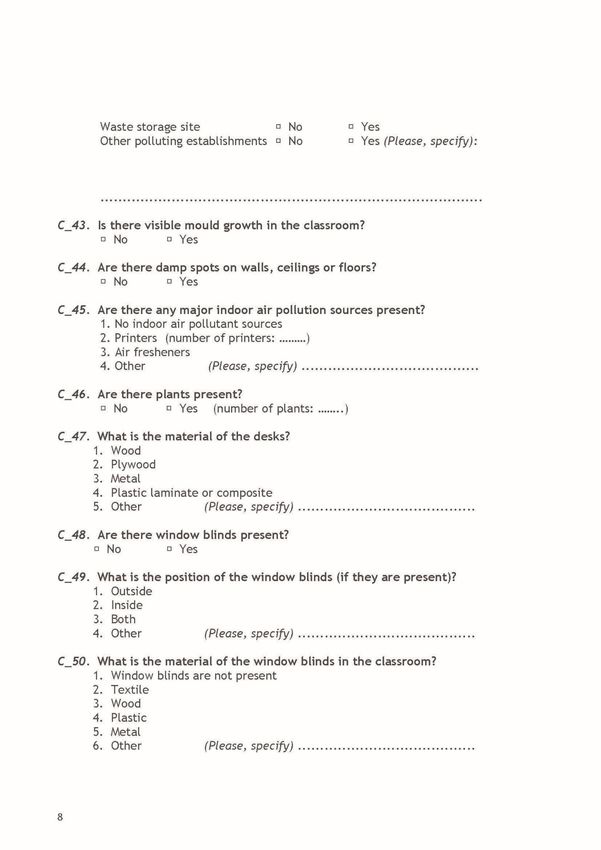
Table 2. Recommended limit values and averaging periods for some selected air pollutants in
                             Hungary (draft Ministerial Order).
Pollutant                                       Concentration       Averaging period

PM2.5                                                25 μg m-3            24 h
                                                               -3
PM10                                                 50 μg m              24 h
                                                               -3
Nitrogen dioxide                                     40 μg m             1 week
                                                    100 μg m-3            24 h
                                                    200 μg m-3            1h
                                                               -3
Ozone                                                50 μg m              24 h
                                                               -3
                                                     80 μg m             1 week
Carbon monoxide                                   3 000 μg m-3            24 h
                                                               -3
                                                  8 000 μg m             1 week
Carbon dioxide                                      1 500 ppm            1 week
                                                               -3
Benzene                                               5 μg m             1 week
                                                     10 μg m-3            24 h
Formaldehyde                                         30 μg m-3           1 week
                                                               -3
                                                     50 μg m              24 h
                                                               -3
Trichloroethylene                                    10 μg m             1 week
Tetrachloroethylene                                 250 μg m-3           1 week
Radon                                              400 Beq m-3           1 year

The draft Ministerial Order contains recommendations also for the biological
contaminants (i.e. mould, dust mite, bacteria and endotoxins) in the indoor
environment.

There is no regular IAQ monitoring or surveillance to assess the levels of indoor air
pollutants in schools buildings in Hungary; however, there have been two international
research projects focusing on assessing exposures to indoor air pollutants in school
buildings.

The SEARCH (School Environment and Respiratory Health of Children) project was
carried out between 2006 and 2013 in two phases: SEARCH I (2006-2010) and SEARCH II
(2010-2013). In total, 10 school buildings were investigated in Hungary.

                                                                                          9
The SINPHONIE (Schools Indoor Pollution and Health: Observatory Network in Europe)
project was carried out between 2011 and 2013 and 6 school buildings were investigated
in Hungary.
Details of the research projects are presented in Section 6 (Review of indoor air quality
data).
It is well-known that the temperature in the classrooms is matter of human comfort.
Thus, there are three national policies that set requirements or recommendations on
the indoor temperature controlled by different systems in school buildings in Hungary.
The minimum and maximum operational temperature values in school buildings were
set to 20 and 26°C respectively. The temperature has to be controlled in the case of
both heating (between 20 - 24°C) and cooling (between 22 and 26 °C).
The following policies are in force regarding this issue:
Ministerial Decree 7/2006. (V. 24.) of TNM on the specification of energy
performance of buildings (Annex 1: Table V/1.) (year of adoption: 2006).
Standard on recommended average indoor temperatures: National Standards on
the requirements for design of institutions for education: MSZE 24203-2:2012
(year of adoption: 2012).
Standard on indoor environmental input parameters for design and assessment
of energy performance of buildings addressing indoor air quality, thermal
environment, lighting and acoustics: MSZ EN 15251:2007 (year of adoption:
2007).
The minimum ventilation rate was set at 25.2 m 3/h/person and is described in the
Ministerial Decree 7/2006. (V. 24.) of TNM on the specification of energy performance
of buildings (Annex 1: V.2.1.) (year of adoption: 2006).
According to this Ministerial Decree, the indoor carbon dioxide level can exceed the
corresponding outdoor concentration value by not more than 500 ppm (applicable only
for non-residential buildings).
In order to prevent children`s exposure to carbon monoxide in educational buildings in
Hungary, it is compulsory to install carbon monoxide detectors if open-fire combustion
10sources (e.g. gas central heating) are present indoors and the combustion by-products
can spread in the building by air exchange. Further details can be found in the Act XC.
of 2012 on the public service of chimney sweeping (9. § (5)) (year of adoption: 2013).
Regulation on the minimum distance (10 m) between school building and parking space
or bus stop exists to prevent significant outdoor air pollution at school buildings. Further
details are provided in the Government Decree 253/1997. (XII. 20.) on the national
urban planning and building requirements (10. § (3), 42. § (9) b)) (year of adoption:
1998). Furthermore, the draft Ministerial Order titled "Public health and health
protection requirements of design, construction and operation of buildings" contains a
section about the minimum distances (>50 m) between educational buildings and
certain air pollution sources (industrial sites, railway stations, petrol stations, busy
road) that might affect air quality. The recommendations in the draft Ministerial Order
are stricter compared to the Government Decree.
To prevent non-smokers from tobacco smoke, strict regulations are in force in Hungary.
Indoor smoking is strictly prohibited in workplaces and public places (including bars,
pubs, restaurants). Smoking is permitted only at designated outdoor places (distance
from the entrance of the building is at least 5 m). However, smoking is not permitted
at outdoor places in educational and other children facilities and health care facilities
(e.g., courtyard). Details can be found in the Act XLII. of 1999 on the protection of non-
smokers (modified by Act CCXII. of 2012) (year of adoption of the modification: 2012).
11D. SWOT analysis
SWOT is an acronym for strength, weaknesses, opportunities and threats to be assessed
– in this case – concerning the IAQ in schools. SWOT analysis is a method to identify the
internal and external factors which may have favourable or unfavourable impact on the
school environment.
The SWOT categories provide important information:
Strengths: internal positive attributes of the school environment that can facilitate
activities aimed to improve the IAQ.
Weaknesses: internal attributes of the school environment that may hinder activities
aimed to improve the IAQ.
Opportunities: external conditions that may facilitate activities aimed to improve
the IAQ in schools.
Threats: external conditions that may complicate activities aimed to improve the
IAQ in schools.
Identification of SWOTs is important because they can inform later steps of planning to
achieve the objective. Users of SWOT analysis must ask and answer questions that
generate meaningful information to each category.
The SWOT analysis groups key pieces of information into two main categories:
a.) internal factors (strength and weaknesses within the project)
b.) external factors (the opportunities and threats presented by the external
environment)
The SWOT analysis has been carried out for the Hungarian situation as follows:
1. The internal analysis has been performed. It examined the advantages and
drawbacks of school environment on the IAQ. This was achieved by the analysis of the
12current state of school environment (Strengths and Weaknesses) and the impact of the
school environment on the IAQ.
2. The external analysis has also been performed. It examined the main relevant
points in the analysis of the actual state of policy-related factors which are independent
of the schools (e.g. legislation in force, financial environment). They were identified
as Opportunities or Threats or obstacles to be addressed in future.
3. The collected information (according to points 1 and 2) was filled in the SWOT
analysis tool (enclosed table).
In the SWOT analysis the following parameters were taken into account:
education policy;
demographic trends
legislation(s) in force;
financial environment;
stakeholders (including authorities) involvement;
current state of the applied technology (including building technology, HVAC
systems, building finishing and furnishings);
possibility of modern technology development and innovation (including building
technology, HVAC systems, building finishing and furnishings);
dissemination of knowledge and increase of awareness of school managements
regarding to ensure the good IAQ;
trends in public health that may affect the IAQ.
13SWOT Analysis Tool
Improvement of the Indoor Air Quality in the school environment
Identified Strengths, Weaknesses, Opportunities and Threats limited to the maximum
of ten under each heading (according to the agreed methodology).
Internal analysis
STRENGTHS WEAKNESSES
What has a positive impact on What has a negative impact on the
the school environment school environment regarding IAQ?
regarding IAQ? 1. Low awareness of indoor air quality.
1. The ownership of schools (the 2. Age of school buildings.
management can accelerate the 3. Old water pipes containing Pb.
renovation of buildings) 4. Asbestos as insulation.
2. The involvement of 5. New furniture emitting VOCs,
SWOT management, technical aldehydes.
analysis tool personnel and teachers. 6.Classroom walls painted with water-
3. Municipal heating (the vast resistant paints; plastic floor in the
majority of schools). classrooms
4. Mean number of pupils is 7. Ambient noise exposure.
20.2. 8. Overcrowding of classes.
5. Renovation of buildings, 9. Lack of the proper equipment to
windows (due to operational check the airflow value in the
programs). ventilation ducts.
6. Direct contact with the 10. Lack of air conditioning system in
parents of the pupils. classrooms.
14OPPORTUNITIES Opportunity-Strength Opportunity-Weakness
What are the opportunities (OS) Strategies (OW) Strategies
to improve the IAQ in the How can we use How can we overcome
school environment? Strengths to take Weaknesses by taking
1. A questionnaire survey of advantage of advantage of
the Public Health Department Opportunities? Opportunities?
of Governmental Agencies 1. Proper selection of 1. Frequent ventilation of
every 5 year. materials and classes (opening of the
2. Inspection of schools by technological processes windows).
Public Health Departments. used in the thermo- 2. Proper timing of
3. Post-inspection modernization of the painting the classrooms
recommendations of Public school. with water soluble paints.
Health Departments. 2. Use of guidance and 4. Optimization of the
4. Guidance and recommendations daily routine cleaning and
recommendations developed developed in projects thorough cleaning.
External analysis
in the frame of projects aimed aimed at improving the 5. New furniture should
at improving the indoor air indoor air quality in be bought during summer
quality in schools. schools. and kept in rooms with
5. Ongoing process of thermo- 3. Repair / clean the proper ventilation.
modernization of schools in ventilation ducts during 6. Conducting of the
line with the EU directive. the thermo- literature review and
6. Common access to the modernization process. disseminate selected
publication of the air quality, 4. The possibility of publications among school
results of measurements of regulating the activity personnel to raise
the quality of outdoor and of children depending awareness of air quality.
indoor air, the impact of air on outside air quality. 7. Training and educating
pollution on human health, 5. Observation of the cleaning personnel about
including children, and incidence of respiratory the proper technology of
methods to reduce the levels diseases, allergies listed cleaning.
of airborne pollution. in the literature as
associated with air
pollution among pupils
and undertaking of
15activities in case of
increased morbidity
among school children
(e.g. in selected
classes).
6. Introduction of
proper cleaning
technology: non-irritant
cleaning chemicals,
proper timing and
frequency of cleaning.
THREATS Threat-Strength (TS) Threat-Weakness (TW)
What are the threats that Strategies Strategies
can negatively influence the How can we use How can we minimize
IAQ in the school Strengths to avoid Weaknesses and avoid
environment? Threats? Threats?
1. Surroundings of schools 1. Selection of the right 1. Raising awareness of
(industry, PM emission). time for cleaning / the indoor air quality
2. Heavy traffic. minor repairs. among the school staff
3. Infiltration of the large 2. Frequent cleaning and parents of students.
amounts of PM into the inside and exact removal of 2. Improvement of the
school environment from the layer of dust. involvement of school
outside. 3. Slow down the traffic staff and parents to take
4. Lead exposure due to old at schools (e.g. to apply actions towards the
water pipes. to the local authorities improvement of the
5. Legal regulations in force – about the installation of indoor air quality in
lack of detailed requirements speed bumps on the schools.
for ensuring proper indoor air road in the school
quality in the school classes. surrounding).
6. Lack of funds for necessary 4. Applying for the
repairs. additional funds to the
owners on the basis of
the post-inspection
167. The schools belonging to recommendations of
the state are managed by one the Public Health
agency. Authorities.
8. Lack of funds for the 5. Conducting of the
installation of modern HVAC literature review and
systems. disseminate selected
9. Low awareness of indoor air publications among
quality among the school parents to raise
management. awareness of air
10. Low awareness of parents quality.
– less parental pressure on the
school management.
17E. Outdoor air pollution in Hungary
Outdoor air pollution has a significant influence on IAQ, thus information on the
concentration of air pollutants outdoors is important. The Hungarian Air Quality
Monitoring Network provides recent and historical air quality data nationwide. Fifty-
four automatic air quality monitoring stations are operating in Hungary; 12 of them are
located in the capital city, Budapest. One mobile air quality monitoring station is also
in use to perform measurements in those sites where automatic monitoring stations are
not available. The monitoring stations are located in urban (traffic, industrial or
background), suburban (traffic, industrial or background) and rural (background or
industrial) areas. The investigated air pollutants are nitrogen oxides (NO, NO 2, NOx),
sulphur dioxide, carbon monoxide, ozone and PM10 at all stations. In addition, there are
some stations where the concentration of PM 2.5, PM1 and BTEX (benzene, toluene,
ethylbenzene and xylenes) is also measured. All data (hourly mean) are available at the
webpage of the Hungarian Air Quality Network (Figure 2). The collected data are
analysed by the Air Hygiene Group at the National Public Health Center every day. An
Air Hygiene Index (including 4 categories: 1: good; 2: moderate; 3: unhealthy; 4
hazardous) is calculated for all monitoring stations and used for reporting daily air
quality.
Figure 2. Webpage of the Hungarian Air Quality Network
18Based on the location of the schools selected in the InAirQ project, the monthly mean
concentration values of some regularly measured air pollutants are listed in Table 3-9
for 2016, 2017 and 2018 for the areas of interest (Hungary, Budapest, Várpalota).
Table 3. Monthly mean concentration values of some regularly measured air pollutants for
2016 for Hungary.
SO2 NO2 CO O3 NOX PM10
January 2016 7.0 27.8 848 24.8 56.1 42.2
February 2016 5.4 23.5 555 35.2 43.2 22.3
March 2016 4.1 21.1 518 44.3 33.6 21.8
April 2016 3.8 18.7 410 57.3 24.3 23.0
May 2016 3.1 17.6 354 61.9 25.2 17.4
June 2016 3.5 15.9 298 55.8 23.9 17.9
July 2016 4.0 14.7 314 56.5 21.4 18.1
August 2016 3.6 16.5 327 53.7 24.7 16.7
September 2016 3.7 22.7 409 44.7 38.5 24.9
October 2016 4.4 19.3 485 25.1 39.0 21.1
November 2016 6.0 26.9 627 23.8 57.8 32.8
December 2016 6.0 27.4 800 22.3 56.8 39.1
Annual mean 4.5 21.0 495 42.1 37.1 24.8
Table 4. Monthly mean concentration values of some regularly measured air pollutants for
2016 for Budapest.
SO2 NO2 CO O3 NOX PM10
January 2016 4.7 42.4 855 18.8 97.7 48.3
February 2016 3.6 38.6 536 28.8 72.0 23.6
March 2016 3.6 33.8 479 38.9 54.1 24.4
April 2016 3.9 30.6 374 51.9 47.4 26.6
May 2016 3.9 30.2 380 56.0 42.7 20.4
June 2016 3.7 28.8 291 52.4 42.5 21.1
July 2016 4.6 24.4 273 49.8 34.2 20.3
August 2016 5.7 25.4 381 48.8 37.9 20.5
September 2016 4.6 37.0 437 36.4 65.7 28.0
October 2016 4.6 26.8 556 19.7 59.4 21.9
November 2016 4.9 35.7 685 18.2 79.0 35.4
December 2016 4.7 37.4 838 20.5 95.8 40.4
Annual mean 4.4 32.6 507 36.7 60.7 27.6
19Table 5. Monthly mean concentration values of some regularly measured air pollutants for
2016 for Várpalota.
SO2 NO2 CO O3 NOX PM10
January 2016 n.a. 21.6 1203 8.5 65.6 42.6
February 2016 4.8 24.9 690 17.4 50.4 25.4
March 2016 4.2 22.6 603 25.0 32.7 21.1
April 2016 n.a. 19.2 1 385 34.1 97.9 13.6
May 2016 n.a. 20.7 434 25.5 36.3 21.3
June 2016 n.a. 20.3 266 19.5 32.5 18.0
July 2016 n.a. 15.6 204 25.0 22.7 19.5
August 2016 n.a. 16.7 149 21.4 24.9 16.6
September 2016 n.a. 23.2 463 16.7 36.4 20.5
October 2016 n.a. 17.9 591 13.3 41.7 17.8
November 2016 4.1 23.8 862 13.3 56.2 28.8
December 2016 4.1 23.3 903 15.0 53.5 32.7
Annual mean n.a. 20.8 646 19.5 45.9 23.2
Table 6. Monthly mean concentration values of some regularly measured air pollutants for
2017 for Budapest.
SO2 NO2 CO O3 NOX PM10
January 2017 15.5 48.6 95.7 921 24.7 55.1
February 2017 16.8 44.7 89.4 791 21.8 37.4
March 2017 8.3 38.9 65.7 481 36.2 25.6
April 2017 6.7 28.8 40.9 375 46.5 19.3
May 2017 7.3 28.3 37.8 357 52.3 16.9
June 2017 7.6 26.6 35.1 267 69.1 17.1
July 2017 7.1 25.6 33.0 307 53.5 15.7
August 2017 6.0 38.3 43.8 366 52.2 19.5
September 2017 3.4 26.0 51.3 500 35.4 14.0
October 2017 6.3 31.6 70.7 483 30.5 20.7
November 2017 12.8 32.7 75.5 579 17.8 21.7
December 2017 15.4 40.0 89.4 670 18.1 29.0
Annual mean 9.4 34.2 60.7 508 38.2 24.3
20Table 7. Monthly mean concentration values of some regularly measured air pollutants for
2018 for Budapest.
SO2 NO2 CO O3 NOX PM10
January 2018 6.2 37.4 89.1 675 15.9 34.2
February 2018 4.2 35.4 72.3 648 26.9 32.8
March 2018 4.1 31.9 52.6 718 36.0 36.5
April 2018 4.1 36.7 57.8 568 48.9 29.5
May 2018 6.2 30.2 42.3 446 55.0 26.9
June 2018 5.3 21.8 27.8 374 59.2 19.1
July 2018 5.1 24.9 33.5 410 65.1 21.5
August 2018 4.5 26.1 32.7 555 62.8 26.4
September 2018 4.8 34.5 52.5 534 50.9 29.2
October 2018 5.2 37.4 65.6 646 41.6 34.5
November 2018 5.4 33.8 74.2 813 18.6 36.8
December 2018* 5.1 32.3 71.6 814 16.8 34.6
Annual mean 5.0 31.9 56.0 600 41.5 30.2
* until 12 December 2018
Table 8. Monthly mean concentration values of some regularly measured air pollutants for
2017 for Várpalota.
SO2 NO2 CO O3 NOX PM10
January 2017 5.2 26.2 903 22.6 51.5 45.0
February 2017 5.2 32.1 927 14.8 69.8 36.2
March 2017 4.2 15.5 709 33.4 24.6 17.9
April 2017 4.4 8.3 951 41.0 13.9 14.9
May 2017 5.2 n.a. 961 37.9 n.a. n.a.
June 2018 5.4 15.9 n.a. 41.3 18.9 n.a.
July 2017 5.8 13.6 n.a. 33.4 17.1 n.a.
August 2017 n.a. 25.3 n.a. 38.5 69.7 n.a.
September 2017 n.a. 19.9 n.a. 31.0 35.1 n.a.
October 2017 8.7 19.9 505 29.4 37.2 n.a.
November 2017 n.a. 23.1 839 18.1 53.8 n.a.
December 2017 n.a. 19.9 1224 22.6 38.8 30.5
Annual mean 5.5 20.0 877 30.3 39.1 28.9
n.a. = not available
21Table 9. Monthly mean concentration values of some regularly measured air pollutants for
2018 for Várpalota.
SO2 NO2 CO O3 NOX PM10
January 2018 n.a. 24.1 1751 15.0 60.7 39.4
February 2018 n.a. 22.1 976 33.9 37.8 35.7
March 2018 n.a. 33.1 n.a. 28.6 54.0 41.5
April 2018 n.a. 24.7 795 31.7 35.2 33.8
May 2018 n.a. 26.1 356 23.7 38.9 11.4
June 2018 n.a. 18.3 488 n.a. 29.8 8.9
July 2018 n.a. 14.2 368 50.0 21.0 13.6
August 2018 1.0 17.9 278 61.8 32.3 n.a.
September 2018 0.7 20.5 370 369.7 62.3 10.5
October 2018 1.4 24.5 339 50.3 48.2 25.5
November 2018 2.3 28.7 668 16.4 74.1 42.1
December 2018* n.a. 22.1 1178 20.2 49.1 35.2
Annual mean n.a. 23.0 631 35.8 43.3 24.8
n.a. = not available
* until 12 December 2018
The annual mean values measured in the three years in Hungary were below the limit
values set by the European Commission. Due to the higher traffic density, the PM 10 mass
concentration and the NO2 concentration values are higher in the capital city compared
to the results obtained in the countryside. Hungary has a typical continental climate
characterized by cold winters and warm summers. Accordingly, the concentration of
several air pollutants (e.g., PM10 mass concentration, O3, CO) showed seasonal
variation. During the winter period, the PM10 mass concentration values often exceed
the 24-h limit value.
22F. Review of indoor air quality data
IAQ measurements were performed only in the frame of international projects (i.e.
SEARCH and SINPHONIE) in Hungary. Besides the investigation of IAQ, the health effects
of indoor air pollutants were investigated in the case of both projects.
The SEARCH initiative was financially supported by the Italian Ministry for the
Environment, Land and Sea (IMELS) through the Italian Trust Fund (ITF). It was carried
out at two stages. The first phase of the SEARCH initiative (2006–2009) led to the
creation of a comprehensive database of the concentration of several air pollutants
(PM10, NO2, formaldehyde, benzene, ethylbenzene, xylenes, toluene and CO 2) measured
indoors and outdoors. In total, 10 primary school buildings were investigated in Hungary
and the results are summarized in Table 10. The second phase of the SEARCH initiative
(2010-2013) introduced a new component: the assessment of energy use in school
buildings and the impact of building materials on children’s health to compile
recommendations for improving the quality of school environments and school buildings
and improving energy efficiency.
Table 10. Summary of the results of indoor air quality measurements in primary school
buildings in Hungary (first phase of the SEARCH initiative).
Pollutant Mean ± SD Median Min. Max.
PM10 (μg m-3) 56.2 ± 28.2 56 9 115
-3
NO2 (μg m ) 15.6 ± 7.2 14 4 39
-3
Formaldehyde (μg m ) 2.4 ± 0.9 2.2 0.9 5.5
-3
Benzene (μg m ) 2.4 ± 1.7 1.7 0.4 5.9
-3
Ethylbenzene (μg m ) 1.7 ± 2.4 0.9 0.0 12.9
-3
Xylenes (μg m ) 7.4 ± 12.4 3.1 0.4 69.3
-3
Toluene (μg m ) 4.7 ± 4.0 3.2 1.0 21.4
CO2 (ppm) 1 493 ± 500 1 433 728 3 061
23The main findings of the SEARCH I and the SEARCH II phases were summarized in reports
and are available online.
The SINPHONIE project aimed to gather new IAQ and associated health data from school
buildings across Europe. The ultimate goal was to compile a number of
recommendations to inform existing and future policies and to propose a set of
guidelines towards a healthy school environment in Europe. During the project (2010-
2012) 6 school buildings were investigated in Hungary and the results are summarized
in Table 11. More IAQ parameters were investigated in the SINPHONIE project compared
to the SEARCH initiative.
Table 11. Summary of the results of indoor air quality measurements in primary school
buildings in Hungary (SINPHONIE project).
Pollutant Mean ± SD Median Min. Max.
Formaldehyde (μg m-3) 9.0 ± 4.0 9.0 3.7 17.2
-3
NO2 (μg m ) 11.5 ± 5.0 10.8 4.6 21.9
PM2.5 (μg m-3) 46.6 ± 26.6 41.5 12.0 105.6
Benzene (μg m-3) 6.6 ± 5.6 4.3 2.0 19.7
-3
Lead (μg m ) 3.5 ± 3.3 2.5 0.0 11.9
-3
Naphthalene (μg m ) 3.2 ± 2.1 3.1 0.3 9.0
-3
Limonene (μg m ) 37.3 ± 41.8 13.2 4.9 149.5
Trichloroethylene (μg m-3) 9.7 ± 24.0G.Characterization of the health impact of indoor air
quality
Air quality in buildings is associated with occupants’ health and comfort. IAQ can be
affected by many parameters, such as the emission of indoor pollutants, the intrusion
of outdoor pollutants, chemical reactivity, sorption and desorption phenomena, air
change rate, indoor temperature and relative humidity. To facilitate the understanding
of IAQ issues by nonprofessionals and to promote the improvement of IAQ, indexes have
been created worldwide over the past decades. These indexes have often been
incorporated into indoor environment quality (IEQ) evaluations. Within IEQ indexes,
IAQ, thermal comfort, acoustic comfort and visual comfort are the primary areas
considered in the proposed frameworks. In Green Building certifications, IAQ is also
evaluated as a part of the life-cycle assessment of the building’s sustainability.
Many indexes are available for the evaluation of IAQ in buildings. Two different
approaches are commonly employed to construct IAQ indexes: questionnaires and
indoor measurements. Existing IAQ indexes are frequently based on a single approach.
IAQ indexes based on questionnaires include questions related to perceived IAQ and/or
the indoor comfort of occupants, or checklists describing building facilities, including
ventilation performances. Approaches and questions vary because the objective differs
among indexes.
More frequently, IAQ indexes are measurement-based, common indoor parameters
include indoor temperature, relative humidity, airborne pollutants in the gas phase,
and particles, measured on a given time-scale. The score of an IAQ index can be
calculated using complex equations. Alternatively, the score of an IAQ index can be
obtained by comparing the measured values in a given time interval to the thresholds
associated with the same exposure duration.
The IAQ can also be assessed by questionnaires. By checklists, the authorities or the
management of the buildings can identify the major problems, sources of pollution.
25Questionnaires on evaluation of the perceived risks can give a further input to identify
problems, most often the complaints are related to thermal comfort.
If there is a possibility to measure the concentration of major pollutants the results can
be used for hazard identification and risk assessment and can launch interventions.
In case of real time monitoring of IAQ there is a possibility to evaluate the actual quality
of indoor air and take immediate actions.
Within the InAirQ project a recommendation for Indoor Health Index was developed.
The InAirQ.project recommended to consider the highest score of any of the pollutants
as the most important pollutant defining the quality of air indoors.
In the InAirQ proposal a five scale categorization of the most important and frequent
chemical air pollutants (PM2.5, benzene and formaldehyde) was applied using different
threshold values for the cut off points. A colour scale is recommended to distiguish
between the different categories (Table 12).
Table 12. Categorization of air pollutant concentration values based on their health effects
benzene formaldehyde
Category PM2.5 (μg/m3)
(μg/m3) (μg/m3)
Healthy 100
Indoor comfort is influenced by temperature, carbon dioxide concentration and relative
humidity. Indoor temperature is ideal between 18.5 – 25.1°C. Relative humidity is
optimal between 43% and 67%. Both too dry air (RH73%) can
cause health problems. Indoor CO2 concentration is ideal if it is twice as high as the
26outdoor concentration (~800 ppm). InAirQ proposes 1200 ppm as acceptable level,
between 1200-1800 ppm concentration CO2 has moderate health effect, above 1800
ppm it is unhealthy. The recommendations are summarized in Table 13.
Table 13. Categorization of comfort parameters
RH T CO2
Category
(%) (°C) (ppm)
Healthy 43H.The monitoring campaign carried out within the InAirQ
project (2017-2018)
The InAirQ project has officially started in July 2016 to investigate IAQ in primary school
buildings in 5 Central European countries and to develop and test action plans in order
to improve IAQ. In Hungary, the monitoring campaign took place during the heating
season of 2017/2018 (11/06/2017 – 28/03/2018). In total, 16 school buildings were
investigated across the country (Figure 3). The school buildings were selected based on
several criteria developed in the project. Buildings IDs were used in the survey.
Figure 3. Geographical distribution of the schools surveyed in the frame of the InAirQ project
28The following parameters were investigated:
Relative humidity (RH) and temperature (T)
Nitrogen dioxide (NO2)
Ozone (O3)
Carbon dioxide (CO2)
Polycyclic aromatic hydrocarbons (PAHs)
Volatile organic compounds (VOCs)
Aldehydes
Particulate matter (PM2.5)
Radon (Rn)
The measurements were carried out by using the instruments listed in Table
14. Indoor and outdoor sampling/monitoring took place simultaneously (one
classroom and one outdoor location).
Table 14. Description of the equipment used in the survey in Hungary
Minimum
Equipment’s accuracy
Parameters Equipment used Detection
(if relevant)
Limit (ppm)
Relative humidity (RH) ±3 %rF
Testo 174H -
temperature (T) ±0,5 °C
NO2 Aeroqual S500The comfort of the schoolchildren is influenced by temperature, carbon dioxide level
and relative humidity. Moreover, these parameters can affect the health of children
and adults and may affect student learning ability and teacher’s productivity. Table
15 shows the results of the measurements indicating the categories of the Indoor Health
Index.
Table 15. Temperature, relative humidity and carbon dioxide concentration in the surveyed
Hungarian schools (2017-2018)
CO2
School T (°C) RH (%)
(ppm)
building
ID
IN OUT IN OUT IN OUT
HU05 23.1 15.8 45.7 50.5 1405 405
HU07 20.7 8.3 34.4 67.3 784 412
HU04 22.9 7.8 38.6 81.2 941 400
HU17 24.5 4.4 29.3 68.1 1214 409
HU20 22.1 5.5 38.1 63.4 1777 415
HU21 21.7 9.8 54.8 73.7 2328 420
HU19 21.3 7.8 44.4 72.4 1339 410
HU15 23.3 4.6 36.7 66.2 1244 406
HU06 21.6 6.2 29.3 62.5 767 428
HU09 24.3 4.1 28.2 65.7 1081 418
HU01 23.0 -3.0 35.3 51.9 1539 417
HU22 23.2 8.5 31.4 58.3 1245 420
HU23 22.9 6.5 28.8 41.3 1467 396
HU24 21.3 4.7 35.7 74.5 1136 424
HU25 22.7 16.9 38.1 46.6 1012 397
HU26 24.1 11.8 39.6 51.7 1911 395
The temperature values were within the acceptable range in all cases; however, the
relative humidity values were in the moderate and unhealthy range in the case of four
and nice classrooms, respectively. The air was dry in the majority of the investigated
30classrooms. Concerning the CO2 concentration values, there were only six classrooms in
which the measured concentration values were in the healty range.
Table 16. Results of the measurements for NO2, O3 and PM2.5 for Hungary
NO2 O3 PM2.5
(μg/m3) (μg/m3) (μg/m3)
School building
ID
IN OUT IN OUT IN OUT
HU05 21.9 29.3 nd 13.4 21 19
HU07 29.7 27.2 nd 6.3 72 8
HU04 22.0 26.8 nd 12.7 47 38
HU17 23.0 31.1 nd 4.8 38 50
HU20 14.2 28.0 nd 18.4 62 42
HU21 19.7 30.1 nd 17.8 53 23
HU19 24.3 22.4 nd 2.9 47 41
HU15 27.2 32.7 nd 8.8 50 20
HU06 - - nd 10.4 35 41
HU09 60.4 80.2 nd 23.6 29 24
HU01 34.9 69.4 nd 33.2 45 45
HU22 79.0 85.4 nd 14.4 51 49
HU23 31.9 43.0 nd 9.0 42 85
HU24 - 59.0 nd 9.9 38 44
HU25 47.0 82.8 nd 15.2 46 45
HU26 20.1 45.3 nd 26.2 59 67
31Ozone was not detected indoors (Table 16). The indoor NO2 concentration is not
characterised by the Indoor Health Index; however, it is clear that the indoor
concentration values were higher when the outdoor NO2 were also high. The PM2.5 mass
concentration was always out of the healthy range; moderate concentration value was
measured in only one classroom while in nine and six rooms were characterised by
unhealthy and very unhealthy categories, respectively.
Table 17. The benzene and formaldehyde concentration values obtained for Hungary
Benzene Formaldehyde
(μg/m3) (μg/m3)
School building ID
IN OUT IN OUT
HU01 7.0 8.8 6.7 2.0
HU04 3.4 4.2 4.2 0.6
HU05 3.3 4.8 9.0 1.7
HU06 7.0 6.3 5.6 1.5
HU07 3.1 3.2 3.4 0.9
HU09 4.9 5.1 9.4 1.0
HU15 4.4 4.1 8.9 1.8
HU17 3.4 3.3 5.0 1.7
HU19 4.6 4.1 11.4 1.2
HU20 2.4 3.5 12.1 1.2
HU21 1.9 2.7 17.6 1.9
HU22 8.3 6.9 10.4 2.5
HU23 5.9 3.4 9.5 1.8
HU24 5.6 5.8 8.4 1.3
HU25 - 1.2 7.9 1.2
HU26 4.1 4.4 9.3 1.7
32Based on the Indoor Health Index, the concentration of benzene was in the healthy
range in one classroom, it was in the moderate range in the majority of the classrooms
(n=10) and only four classrooms were characterized by unhealthy benzene
concentration values.
Concerning formaldehyde exposure, the measured values were in the healthy and
moderate ranges.
To sum up our findings on the IAQ measurements, it can be stated that the major IAQ
problems were related to the comfort parameters and high PM2.5 mass concentration
values. The high indoor CO2 levels are among the leading problems together with the
low relative humidity values.
33I. Indoor Air Quality Action Plan for Hungary
The primary aim is to minimize the impact of the outdoor and indoor environment on
pupils' health. The action plan is based on the assessment of the the current state of
the school environment and on the identification of the problems. The action plan can
only be fulfilled if there is a supportive legislation, group of public health experts,
supportive school management, intersectoral cooperation and financial background.
Some of the action should be carried out by using structural funds (eg. EU funded
operational programs for modernizing the heating and ventilation system of the
buildings, change of the lead containing water pipes, elimination of asbestos-containing
insulation etc. Some other programs can be incorporated in the plans of regular
maintenance of the school building (like timing of the painting of the rooms, changing
furniture. etc). Some practical actions can be done without money like ventilation of
the classrooms by opening the windows.
The regular check-ups of the school buildings should remain the task of the public
health services. However monitoring – either ad hoc or regular - of concentration of the
indoor air pollutants needs a regular line in the national budget.
The National Strategy of healthy school environment should be a part of the National
Public Health Strategy, based on national and international evidences, regulations,
guidelines and good practices.
34I.1. General action plan for improving IAQ in the school buildings
The proposed protocol for each primary school building in Hungary is the following:
School building: ________________________ (name, location)
Stage 1.
Set up a group responsible for the environmental health issues in the school (director,
school manager, public nurse)
Define an IAQ manager: ____________
Define the contact person representing the public health service: ____________
Stage 2. Vulnerability assessment and SWOT analysis
- School building (surroundings, technical characteristics of the building),
maintenance, number of users, their distribution);
- Identification of different actions for improving indoor air quality (what/how)
- Identification of children and employees wellbeing (self-assessment)
- Identification of children and employees’ health status (questionnaire)
- Evaluate the results of the regular health monitoring run by school
paediatricians and nurses
Stage 3. Regular check-ups based on standardized checklists run by the public health
service (professional assessment of the building status, examples are given in Annex 1
and Annex 2)
Stage 4. Defining the periodical monitoring of IAQ in school buildings (frequency,
methods, control and action) and defining exceptions.
Stage 5. Action plans for improvement of indoor air quality (priority list based on the
advices of public health service and the school management)
35The process of implementation and evaluation of each action:
- Defining the aim of action
- Method of implementation of action
- Time plan
- Stakeholders involvement plan
- Checklist of action
- Evaluation of action
- Quality control of action
Furthermore, the following activities should be carried out at national level:
Capacity building trainings
Capacity-building is a crucial part of the national strategy based on special training
materials. The target groups for the trainings:
school employees
cleaning specialists
building sector
Monitoring campaign
Based on the regular school check-ups, ad hoc monitoring campaigns should be planned
in order to measure the level of indoor air pollutants with special regard to their health
risks. The preventive measures should be adjusted to the results in order to lower
emissions. control emission sources and reduce the potential health impacts.
Awareness raising
Education and training of the key target groups such as architects, local authorities and
representatives of the maintaining organizations, as well as the parents should be
improved. The authorities’ supervisory responsibility with respect to inadequate indoor
environments needs to be extended.
36Some awareness raising actions should be aimed at:
Informing the general population (with special regard to parents) about the
importance of IAQ in primary schools.
Dissemination of the results of the monitoring campaigns.
Presentation of best practices from other countries based on benchmark visits.
Legislations
The IAQ has not been regulated within the EU; however, there is a guideline proposed
by the WHO. In Hungary a governmental order on IAQ has been elaborated, but has not
been accepted yet. The task is to update the list of indoor air pollutants and their
proposed limit values based on the latest scientific evidences.
The ministerial order should define the tasks and responsibilities of the different
ministries in order to reduce the health risks of indoor exposures in public buildings.
The ministerial order should be prepared by the Ministry of Human Capacities.
Concerning the maintenance of the school buildings the following principles should be
followed:
The materials and furniture used for building and equipping the schools should have (i)
a certificate of toxicological tests, (ii) low emission of toxic substances and (iii) low
energy consumption.
Some basic actions
Education of the housekeeping staff about the ways how the housekeeping procedures
and products may affect IAQ.
Preparation of written protocols about the procedures, and the use of
equipment in the buildings
In the procurement process prefer the use of more natural cleaners, avoid
using colours, paints
Actions regarding the maintenance (quality) of the roof, gutters, drainage:
37 Regular inspection of the rooms and quick action and remediation in case of
leakage of water and accumulation of moisture in the premises
I.2. Examples for technical improvements
The actions should be based on guidance and recommendations developed in projects
aimed at improving the IAQ in schools. In the future actions should be aimed at the
maintenance, repair and cleaning of the ventilation ducts introduced during the
thermo-modernization process.
Natural ventilation:
Extraction of air (air outlet) from the kitchen (the smell of food).
Mechanical ventilation:
A plan should be prepared for the maintenance of HVAC system. The plan
should include monitoring, inspection and cleaning HVAC components such as
outside air intakes, outside air dampers, air filters, drain pans, heating and
cooling coils, the interior of air handling units, fan motors and belts, air
humidification, controls and cooling towers.
Flooring:
Changing the floor cover with healthy building materials, avoiding carpets and
plastic covers containing phthalates.
I.3. Examples for process improvements
Operational improvements:
modifying the mode of some activities that can affect the quality of the indoor
environment (e.g, increasing air exchange rate, limiting the number of people
in the room, changing the cleaning period).
38Systemic improvements:
Regular measures that will lead to the removal of the source (e.g. replacement
of floor coverings, prohibition of using some detergents).
Cleanliness of the rooms:
Select cleaning methods that are effective for the given need.
Buy products with the least adverse impact on human health.
I.4. Specific actions aimed at reducing the health risks due to
chemical pollutants indoor
Proposed action plans to lower the concentration of formaldehyde:
Select suitable, dedicated furniture and cover materials, equip the rooms with
interior equipment that does not contain formaldehyde or as little as possible.
If you plan to change the furniture of the class rooms, do it during the summer
holiday. Ascertain that the furniture can be ventilated by keeping the windows
open as long as possible. Collect information about the furniture (date of
productions, ventilation and other characteristics of the material of the
furniture).
Plan the use of products containing formaldehyde concerning the proper
ventilation during and after the use of them.
Maintain the temperature and relative humidity of the school environments at
the lowest comfort levels (formaldehyde emission and indoor concentrations
increases by increasing temperature and humidity).
Put special flowers in the classrooms which can absorb formaldehyde
(Scindapsus /Golden Lotus, Sansevieria, Dracena marginata, Filodendron,
Peace lily etc). Besides formaldehyde, these plants can absorb several volatile
organic compounds like benzene, xylene, toluene etc). Take care of the soil of
these plants, use special material which hinders the growth of fungi.
39 Increase the knowledge about preventing exposure to formaldehyde (for
example, when buying articles, always check the composition information,
always wash all new clothes, do not use air fresheners).
Proposed action plans to lower the concentration of benzene:
"Prevention" of the entry of benzene from the outside air (location of parking
lots, cigarette smoke etc.).
Strict control of the smoking ban indoors.
Do not use benzene inside the building except in case you have an extraction
chamber.
Ventilate the indoor areas during and after using products containing benzene
(eg during painting/ use of colors).
Handle as hazardous waste the rest of benzene containing colors by following
the instructions for separating/handling hazardous waste).
Proposed action plans to lower the concentration of VOC:
Prevent the entry of VOCs from the outside air (eg parking lots).
Choose products that do not contain VOCs
Do not store products that are a source of VOCs in rooms where children stay.
When using products that are sources of VOCs (various cleaners, paints,
varnishes ...), use them according to the manufacturer's instructions.
For the use of products that are the source of VOC, ensure sufficient amounts
of fresh air.
Buy and stock the products that are the sources of VOCs in the quantities to be
spent immediately. Discard the excess storage in unopened or open containers
(note the instructions for separating waste).
Never mix products that are the source of organic volatile compounds, unless
stated in the manufacturer's instructions.
40 Reduce the exposure to formaldehyde, benzene and perchlorethylene in a
living environment at school.
Proposed action plans to lower the concentration of PM 10:
Regularly follow the Air Quality Health Index issued by the National Public
Health Center daily. Plan the outdoor activity of pupils according to the
forecast.
"Prevention" of the entry of particles from the outside air:
Thoroughly ventillate the classrooms when the outdoor traffic is low (usually
in the early morning hours, before the traffic jams).
When PM concentration is elevated in the ambient air and the ventilation
possibilities are limited, avoid activities that cause dust in enclosed spaces.
Ensure proper ventilation of other rooms (corridors, cabinets ...), mechanical
ventilation of the kitchen and sanitary facilities.
General instructions on cleaning and maintaining the indoor environments:
Clean the classrooms after the lessons
Use wet cleaning practices for the floor and furniture. Undust the rooms and
furniture every day. The best solution is the use of wet vacuum cleaners with
HEPA filters. If the HEPA filter is too clogged, it stops and no longer performs
its role. It is important to clean them frequently (washing HEPA filters) or
replace them.
Install air cleaning devices that absorb PM and chemical pollutants.
In case the school building is heated by stoves burning solid fuels, use dry hard
wood. Keep the general instructions on fire.
41 Replace solid fuels with cleaner fuels and energies (eg solar energy,
electricity, natural gas) as soon as possible considering the reduction of
emissions from these stoves.
Regularly clean and maintain heating, smoke and ventilation devices. For
furnaces for liquid and gaseous fuels, before the start of the heating season,
ensure that the burners are correctly adjusted.
Install a CO monitoring device in the rooms.
Proposed action plans to lower the concentration of CO2:
If you do not have a mechanical ventillation system,. open the windows of the
classrooms during every break. Ventillate the rooms thoroughly in the morning
and in the afternoon before and after the lessons.
Install a CO2 concentration monitor in the classroom.
Proposed action plans to maintain optimal temperature and humidity:
Put a thermometer in the classroom. Ensure optimal temperature during
winter, do not overheat the rooms.
Be aware of the impact of climate change, prepare for the high outdoor
temperature during late spring and early autumn months.
Prepare plan for the insulation of the buildings and increase the heat resilience
by installing curtains, shades indoor and outdoor.
Plant hypoallergic trees and bushes around the school building.
Monitor the humidity in the classrooms, avoid dry air by placing plants and
humidifiers in the classrooms.
42You can also read