Characterization of Demolition Construction Waste Containing Asbestos, and the Release of Fibrous Dust Particles - applied sciences
←
→
Page content transcription
If your browser does not render page correctly, please read the page content below
applied
           sciences
Article
Characterization of Demolition Construction Waste
Containing Asbestos, and the Release of Fibrous
Dust Particles
Nadezda Stevulova 1, * , Adriana Estokova 1 , Marian Holub 1 , Eva Singovszka 1
and Kornel Csach 2
 1    Faculty of Civil Engineering, Technical University of Kosice, Vysokoskolska 4, 042 00 Kosice, Slovakia;
      adriana.estokova@tuke.sk (A.E.); marian.holub@tuke.sk (M.H.); eva.singovszka@tuke.sk (E.S.)
 2    Institute of Experimental Physics of the Slovak Academy of Sciences, Watsonova 47, 043 53 Kosice, Slovakia;
      csach@saske.sk
 *    Correspondence: nadezda.stevulova@tuke.sk; Tel.: +421-55-602-4126

 Received: 14 May 2020; Accepted: 10 June 2020; Published: 11 June 2020

 Abstract: This paper focuses on the characterization of demolition construction waste containing
 asbestos fibers and the monitoring of fibrous dust released from asbestos–cement products (ACPs)
 during their removal from a three-story industrial building. Asbestos-containing products removal
 was carried out according to a demolition management system in terms of protection of workers.
 The results of a chemical analysis, X-ray diffraction analysis, infrared analysis and scanning electron
 microscopy of demolition waste samples confirmed the same material quality of asbestos–cement
 (AC) elements used throughout the building. In addition, a MgO/SiO2 ratio corresponding to a
 serpentine silicate mineral of chrysotile was detected by means of X-ray fluorescence analysis. Also,
 crystalline phase calcium silicates and calcium carbonates from the cement matrix were identified
 in the AC waste. The relatively large differences in the elemental analysis between the sample area
 and the individual points found by energy-dispersive X-ray spectroscopic mapping are related to
 the composition heterogeneity. The highest content of magnesium occurs where asbestos fibers
 predominate in the cement matrix. The measured number concentrations of asbestos fibers before,
 during, and after asbestos–cement products removal were compared to outdoor concentrations.
 Indoor concentrations of asbestos fibers during the removal of AC materials did not exceed the
 permissible limit for a working environment (1000 fibers per one m3 ), except in three spots out of all
 the working sites inside the building. A relationship between the number and mass concentrations of
 asbestos dust is shown.

 Keywords: demolition waste; asbestos-cement material; chrysotile fibers; number and mass
 concentrations of asbestos dust

1. Introduction
     Removal of asbestos–cement products/materials (ACPs/ACMs) from old buildings is companied
by the release of asbestos microfibers from the cement matrix and represents a serious problem for
environmental and occupational health [1,2]. Asbestos dust is one of the most dangerous types of
dust formed during demolition work and poses a risk for workers’ health [3,4]. On the basis of the
World Health Organization campaign to ban asbestos usage because of its negative health impacts [5],
more than 52 countries respected this requirement. The production of asbestos-containing materials
has declined in all the member countries of the European Union due to the introduction of strict
regulations for exposure and/or outright bans on exposure in 1999 [6]. Some Asian and less-developed
countries in the world refused to ban it [7–9].

Appl. Sci. 2020, 10, 4048; doi:10.3390/app10114048                                  www.mdpi.com/journal/applsci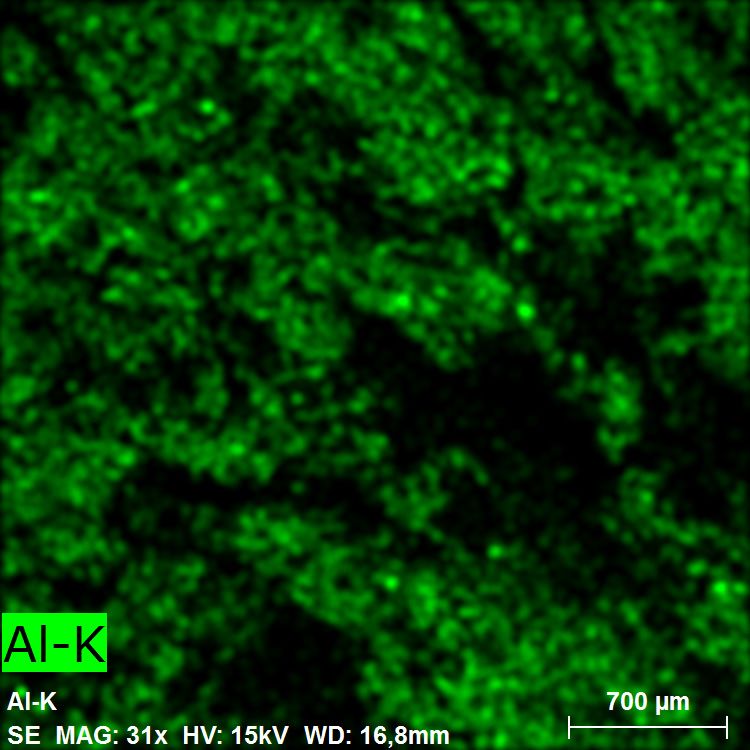
Appl. Sci. 2020, 10, 4048                                                                       2 of 17

     Asbestos-fiber emissions are respirable fractions of the total fibrogenic aerosols present in the
lower layers of the atmosphere [10]. The term respirable asbestos fibers means asbestos fibers with a
diameter of less than 3 µm, a length greater than 5 µm, and an aspect ratio (length-to-diameter ratio)
greater than 3:1. The exposure caused by disturbing an asbestos-containing product occurs through
inhalation of respirable fibers present in the working environment air into the lungs and depends
mainly on fiber diameter and length. The practice of monitoring and controlling work environments
in terms of the presence of such hazardous particles of asbestos dust is very important to ensure
occupational hygiene [11]. The Occupational Safety and Health Administration (OSHA) determined
the permissible exposure limit (PEL) as the normalized average concentration of asbestos fibers in the
air over 8 h work shifts. This value was gradually reduced to 0.1 cm−3 [12] in accordance with the
occupational exposure limit for airborne asbestos in workplaces in European Union countries [13,14].
     To the best of our knowledge, there is limited workplace air-monitoring data of asbestos dust
emissions during the removal of asbestos-containing products in buildings [15–17]. Exposure to
respirable asbestos fibers at various stages of removal work was investigated [15,18]. The levels
of released asbestos fibers present during ACMs demolition inside buildings vary from very low
concentrations to relatively high concentrations [18–23].
     Contrary to studies related to knowing the exposure to respirable asbestos fibers in the indoor
working environment [4,15,18–20,24,25] and its impact on human health (asbestosis, lung cancer, and
mesothelioma [26–34], there is a lack of published work in the area of development of new strategies
and policies for demolition asbestos waste management [7]. Some studies tried to quantify the issue of
waste management following a disaster [35]. However, the safe management of asbestos-containing
products removal, including a survey of the occurrence in buildings, and measurements of the amount
of asbestos fibers present in the indoor working air before, during, and after demolition, is a matter
of considerable importance [15,18,36]. To minimize the continual asbestos presence in an indoor
environment during the ACMs removal process, there is a need to have a monitoring plan of the indoor
and outdoor environment for mineral dust and asbestos fibers concentration [37].
     Therefore, the aim of this work was to study the safety of the indoor environment during a
professional performed demolition and the removal of asbestos–cement (AC) partitions from the
selected building. This paper reports the results of the monitoring of the released asbestos particles
from composite structures during the removal of the construction elements containing asbestos fibers,
as well as chemical and phase compositions, and micro structural morphology of ACMs samples.

2. Materials and Methods

2.1. Building Containing Asbestos–Cement (AC) Materials
     A three-story industrial building with a floor plan of 55 × 15 m, located in the East Slovakia,
was selected for this study. It contained AC partitions as was confirmed by a thorough inspection of
the entire building by a qualified person who detected asbestos fibers in the construction systems.
The thin AC boards from the 80 windows were removed from rooms, and dismantling of AC partitions,
separating individual rooms was undertaken on the 1st floor and 2nd floors. About 20,000 m2 of
AC materials were removed from this building. Demolition waste sampling was performed on
different locations in the three-story industrial building, and average samples were used for their
representative characterization.

2.2. Characterization of Demolition Asbestos-Containing Waste
    As is well known, the application of a detection strategy for asbestos-containing materials in
demolition waste is very important in order to control their presence in subsequent possible recycling
processes [38].
Appl. Sci. 2020, 10, 4048                                                                             3 of 17

      Three representative samples after crushing and milling in a laboratory ball mill to a powder of
particle size less than 40 µm, were subjected to X-ray fluorescence chemical analysis (SPECTRO iQ II;
Bruker, Germany) to determine the main chemical components.
      A TESCAN MIRA 3 FE scanning electron microscope (SEM) (Brno, Czech Republic) with a
Schottky emitter for high-resolution images was used to observe the surface morphology. The samples
were glued onto carbon-adhesive films coated with a gold layer using a vacuum-sputtering coater to
avoid charging them under the electron beam. The accelerating voltage of the SEM was 10 kV. SEM
micrographs were taken at five different magnifications (31; 115; 138; 298; and 505). The determination
of the elemental chemical composition of samples was performed by an energy-dispersive X-ray
unit (EDS).
      Fourier transform infrared spectra (FTIR) were measured on an Alpha Bruker Platinum-ATR
(attenuated total reflectance) spectrometer within the wave number range 4000–400 cm−1 at a resolution
of 4 cm−1 . A total of 24 scans were taken for each sample.
      The phase analysis of the samples has been performed using a Bruker D2 Phaser X-ray powder
diffractometer (Bruker AXS, GmbH, Germany) in Bragg Brentano geometry. The diffraction patterns
were recorded using CuKα radiation (λ = 0.154060 nm), Ni Kβ filters, and a scintillation detector at a
voltage of 30 kV and a current of 10 mA. The X-ray diffraction (XRD) patterns include the data collected
over an angular range 10◦ < 2Θ < 80◦ with step size of 0.01◦ (2Θ) and step time of 20 s. The XRD
patterns were processed using the software Diffrac. EVA v4.2.2. The ICDD PDF (The International
Centre for Diffraction Data, Powder Diffraction File) database (version 2 Release 2009) was utilized for
the phase identification.

2.3. Sampling Plan for Measuring Asbestos Dust
     For measuring asbestos-fiber concentration in indoor air, a detailed sampling plan was carefully
elaborated. This plan included the designation in the rooms of the monitored building in which the
sampling was performed, the distribution of sampling posts, the sampling schedule (averaging time),
the sample volume, and blank sampling in accordance with the intended measurement goal.

2.4. Sampling Posts for Quality Monitoring of Indoor Air
     The optimal air sampling points in the building with asbestos-containing building materials
in smaller and larger spaces were determined after screening the occurrence and type of
asbestos-containing materials used in the entire building and the location of the ventilation systems and
the workers´ activities. Where asbestos-containing material was present, multiple samples were taken.
In asbestos-free areas, comparative samples were sampled. The set of sampling sites on each floor of
the building was determined by the number and size of rooms using an empirical Equation (1) [39].

                                            n = 14A/(730 + A)                                             (1)

where n is unit number of individual rooms, and A is total area of rooms. Seven dust sampling sites
were calculated for the total area of rooms (Table 1).

      Table 1. Characterization of dust sampling sites, number of measurements, and designation of
      activities of asbestos–cement product (ACPs) removal (before removal—BR; during removal—DR; after
      removal—AR).

                             Dust Sampling Site     Number of Samples    Activity
                                                            10             BR
                             A1     Ground floor            9              DR
                                                            10             AR
                                                            9              BR
                             A2     Ground floor            10             DR
                                                            9              AR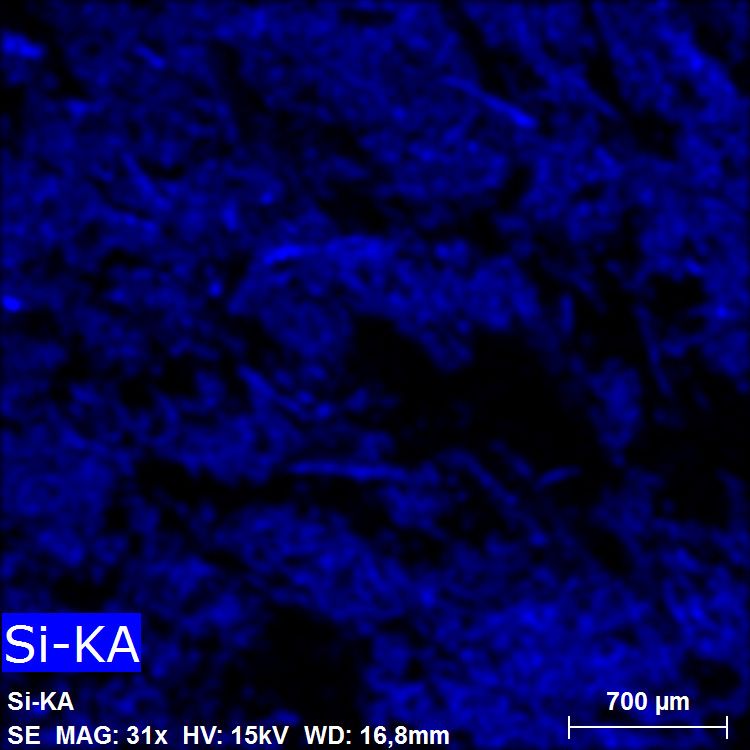
Appl. Sci. 2020, 10, 4048                                                                           4 of 17

                                                 Table 1. Cont.

                            Dust Sampling Site       Number of Samples   Activity
                                                               9            BR
                            B1       1st floor                10            DR
                                                               9            AR
                                                               8            BR
                            B2       1st floor                10            DR
                                                              10            AR
                                                              11            BR
                            B3       1st floor                10            DR
                                                               9            AR
                                                              10            BR
                            C1       2nd floor                15            DR
                                                              11            AR
                                                              11            BR
                            C2       2nd floor                15            DR
                                                              10            AR

2.5. Sampling of Released Asbestos Dust
      Two parallel samplers were used for the collection of asbestos dust: one for gravimetric
determination of dust concentration (mg/m3) and a second for fiber counting (m−3 ). Asbestos
particulate samples from contaminated air were collected on a 25 mm diameter cellulose nitrate
membrane filter (Synpor 3) with a pore size of 1.2 µm (Milipore, UK) inserted into the holder of the
sampling apparatus MCS-10. The sampler was located in the breathing zone (at a height of 1.5 m from
the ground) using a calibrated low flow pump set at a flow rate of 1 L/min before, during, and after
the removal of the AC elements. The sampling of the indoor air was undertaken under conditions
which ensure a uniform collection of representative samples (at closed windows and doors due to
undesirable air exchange) on all determined sites in the building.
      The sampling time was programmed so that the amount of collected air was 1000–2000 L and
concentrations of asbestos fibers in the air were recalculated for 8 h (time-weighted average) in terms of
the level at which a person can be exposed. The total number of collected dust samples was 174 (Table 1).
The first series of dust collections was performed during normal operation before the dismantling of
the AC materials in the building, which is considered as an indoor background value. Air sampling
was carried out inside the buildings before, during, and after the removal of the AC products, as
well as in the ambient and indoor air after completing the dismantling work. Exterior air sampling
to determine the airborne fiber concentration in the immediate vicinity of the building exterior was
carried out during similar weather conditions (dry and windless weather) because the concentration of
fibers in the air is strongly dependent on them [40]. A triple repetition of air sampling in the outdoor
areas was performed. The asbestos dust concentration was determined from the difference in filter
weights before and after the measurements.

2.6. Determining the Number and Mass Concentration
     Optical microscopy with phase contrast [41] was used to calculate the number concentration of
asbestos fibers in the occupational environment. Since this method allows one to identify only the
fibers with a diameter exceeding 5.0 µm, a scanning electron microscope capable of identifying fibers
with a thickness in the range of 0.2 to 3.0 µm was used as well [42,43]. Numerous fiber concentration
determinations were performed on areas randomly distributed on the filter, with the area being a
minimum of 1 mm2 [43].
     Mean values of number concentration of fibers in the air were calculated as the ratio of the
resulting number of fibers on the filter and the corresponding volume of sampled air. The mass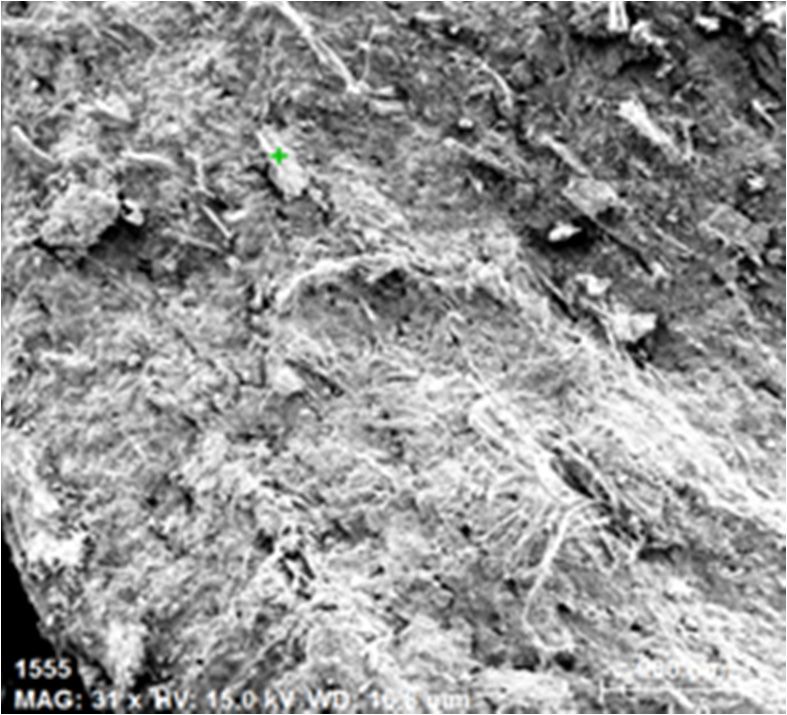
Appl. Sci. 2020, 10, 4048                                                                          5 of 17

concentration of asbestos dust was determined from the difference in weight between the clean filter
and the filter with trapped dust particles.

2.7. Removal of Asbestos–Cement Materials (ACMs)
     ACM removal was performed by an accredited company with the appropriate authorization
according to the procedure defined in the standards that guarantees a proper and safe technological
process of dismantling and the subsequent safe storage of the resulting asbestos waste in a hazardous
waste landfill [44]. Demolition waste containing asbestos was properly encapsulated for the fixation of
asbestos fibers. The asbestos waste thus secured was placed in an impermeable high-strength plastic
bag labeled asbestos. This was then placed in special containers for hazardous waste.
     In the demolition area where removal of parts of the construction containing AC materials took
place (the so-called controlled zone, CZ), it was necessary to adhere to a special regime (no eating,
drinking, and smoking). This zone was clearly marked, indicating that work with asbestos was under
way and entry of unauthorized persons was not permitted [45].
     A personnel decontamination system (PD) was located before the CZ. This space consisted of a
set of chambers arranged one after another, where workers changed their clothes to/from protective
working clothes and equipment at the entry/exit to/from the CZ. Decontamination of working clothes
and respirators and total cleansing of workers always took place on their exit of the CZ in the PD space.
One chamber in the PD space was connected to a HEPA (High-efficiency particulate air)filtering device
so there was no leakage of asbestos fibers outside the decontamination area.
     In addition to the personnel decontamination system, a material zone (MZ) consisting of two
chambers was established. It served to collect disassembled and penetrated asbestos waste material
sealed in closed airtight bags. This waste was subsequently transported from the CZ to an intermediate
landfill located outside the CZ, and from there it was loaded into the containers and further transported
to the predetermined landfill.
     Final cleaning of all areas and spaces was performed with powerful vacuum cleaners after
AC materials’ removal and air exchange was ensured. These work activities were performed over
approximately six months. After completing these activities, the final control measurements of the
number concentration of respirable asbestos fibers were taken [46,47].

3. Results and Discussion

3.1. Characterization of AC Waste
     The AC waste was subjected to chemical and phase analyses, and a morphological study together
with mapping of the distribution of elements in the sample to determine both the content of asbestos
and its distribution in the cement matrix using adequate methods.

3.1.1. Chemical Composition and Surface Morphology of AC Waste
     No significant differences in the chemical composition of the representative AC waste samples
were recorded (Table 2). This confirmed the use of the same material in the construction of the entire
building. The CaO, SiO2 , and MgO are the main components related to cement and the asbestos
raw minerals.
     The content of MgO (5.62 wt. %,on average) in the AC samples is probably related to asbestos, where
magnesium atoms are coordinated with oxygen atoms in the serpentine silicate [27]. The stoichiometric
percentage of MgO and SiO2 in chrysotile as the dihydrate of magnesium silicate Mg3 Si2 O5 (OH)4
is almost the same (43.63 wt. % MgO and 43.36 wt. % SiO2 ). Therefore, it can be estimated that
about 5.58 wt. % of the total SiO2 content (20.04 wt. %, on average—Table 2) comes from asbestos.
The determined amounts of these oxide components are very similar to the data published in [48–51]
and in a good agreement with the Mg/Si ratio for chrysotile.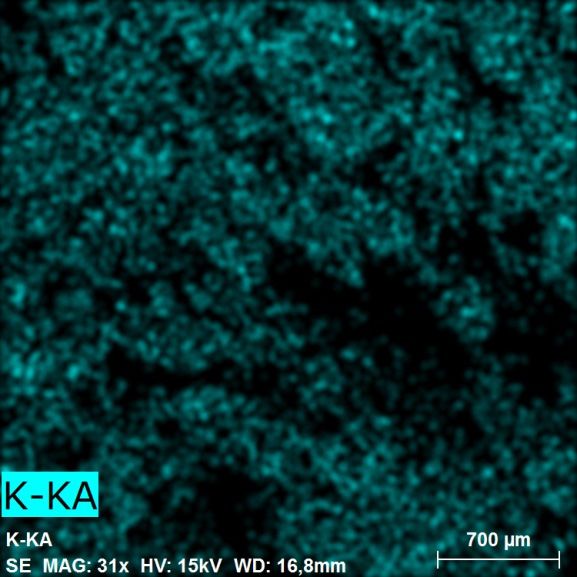
Appl. Sci. 2020, 10, 4048                                                                                                     6 of 17

     The Mg/Si ratio as the characteristic indicator for natural chrysotile is 0.712 [52]. In our case,
the ratio of these main elements (Table 2) is lower (0.362) because the Si is also bounded in silicates
present in the cement matrix.

               Table 2. Chemical analysis of asbestos–cement (AC) waste samples (* loss on ignition).

                                            Content (wt. %)                                          Average Content
             Components                                                           Elements
                                 Sample 1       Sample 2       Sample 3                                  (wt. %)

                    SiO2               20.67         19.14         20.30            Si                   9.36
                    CaO                40.02         38.82         40.54            Ca                  28.44
                    MgO                 5.85          5.65          5.36           Mg                    3.39
          Appl. Sci.Al2 O310, x FOR PEER
                     2020,              2.98
                                         REVIEW       3.02          2.40            Al                   0.74 6 of 19
                  Fe2 O3                2.16          2.20          2.05            Fe                   0.74
                     SO3Cl              2.34
                                        0.02          2.53
                                                     0.02           2.35
                                                                 0.02         Cl     S           0.02    0.96
                    P2 OLOI*
                         5              0.12
                                       25.30          0.11
                                                    25.90           0.10
                                                                26.60          -     P             -     0.02
                     K2Others
                        O              0.34
                                        0.20          0.31
                                                     2.30          -0.29       -    K              -     0.13
                      Cl               0.02           0.02          0.02            Cl                   0.02
                The LOI  *
                       content   of MgO25.30         25.90
                                          (5.62 wt.%,on            26.60
                                                         average) in  the AC samples -is probably related to
                                                                                                           - asbestos,
          whereOthers
                    magnesium atoms     0.20are coordinated
                                                      2.30 with oxygen-              - serpentine silicate- [27]. The
                                                                           atoms in the
         stoichiometric percentage of MgO and SiO2 in chrysotile as the dihydrate of magnesium silicate
      TheMg  3Si2O5(OH)4 is almost the same (43.63 wt.% MgO and 43.36 wt.% SiO2). Therefore, it can be
           CaO/SiO      2 ratio in AC sample is 1.987. However, the CaO/SiO2 ratio converted to the SiO2
         estimated that about 5.58 wt.% of the total SiO2 content (20.04 wt.%, on average—Table 2) comes
content from
         belonging       to the cement is 2.75. This value found by our determination falls within the range
                asbestos. The determined amounts of these oxide components are very similar to the data
of the CaO/SiO      2 ratio
         published in [48–51](3.1and
                                   to 2.68)   in Portland
                                       in a good   agreement  cement
                                                               with the(type
                                                                         Mg/SiI).ratio for chrysotile.
      The presence      of Al
               The Mg/Si ratio  O
                               2 as , Fe  O    and   other
                                   3 the2characteristic
                                            3                oxides  is related   to cement
                                                          indicator for natural chrysotile      and the
                                                                                             is 0.712 [52].asbestos   raw
                                                                                                            In our case,  thematerial.
         ratio  of  these  main  elements    (Table   2) is lower (0.362)   because  the  Si is also
The amount of chlorine found in the samples proves that some hydroxyl ions in the chrysotile structurebounded    in silicates
had been present   in the cement
            substituted      with matrix.
                                    chlorine ions.
               The CaO/SiO2 ratio in AC sample is 1.987. However, the CaO/SiO2 ratio converted to the SiO2
         content belonging
3.1.2. Scanning      ElectrontoMicroscopy
                                  the cement is (SEM)
                                                  2.75. This  value
                                                            and     found by our determination
                                                                 Energy-Dispersive                   falls within the(EDS)
                                                                                          X-ray Spectroscopy           range
         of the  CaO/SiO
Investigations of AC Waste 2 ratio (3.1 to 2.68) in Portland cement (type I).

               The presence of Al2O3, Fe2O3 and other oxides is related to cement and the asbestos raw
      Thematerial.
            correctness      of the of
                      The amount      X-ray    fluorescence
                                         chlorine   found in the(XRF)    results
                                                                    samples        of ACMs
                                                                              proves   that some was   also controlled
                                                                                                    hydroxyl    ions in theby SEM
         chrysotilethis
investigations;       structure
                          was, had
                                 basedbeenonsubstituted    with chlorine
                                               EDS determining        and ions.
                                                                             mapping the element distributions through
the color and morphology characteristics of asbestos.
        3.1.2. Scanning Electron Microscopy (SEM) and Energy-Dispersive X-ray Spectroscopy (EDS)
     TheInvestigations
           morphologicalof AC study
                              Waste of the asbestos–cement sample surface at various magnifications
(Figure 1a–e) showed the rough and inhomogeneous distribution of asbestos fibers.
              The correctness of the X-ray fluorescence (XRF) results of ACMs was also controlled by SEM
     At some locations on the surface of this compact composite material sample, bundles of asbestos
        investigations; this was, based on EDS determining and mapping the element distributions through
fibers composed     of morphology
        the color and  primary fibers    are clearly
                                     characteristics of visible.
                                                        asbestos.The length of the fibers exceeded a few hundred
micrometersThe andmorphological
                    their thickness    was  less than   1 µm. EDS sample
                                   study of the asbestos–cement      analysissurface
                                                                               was carried    out magnifications
                                                                                      at various  on the whole area of
        (Figure  1a–e) showed
the samples, see Figure 1c,e.  the rough  and  inhomogeneous     distribution of asbestos fibers.

                                                                 (a)

                                                         Figure 1. Cont.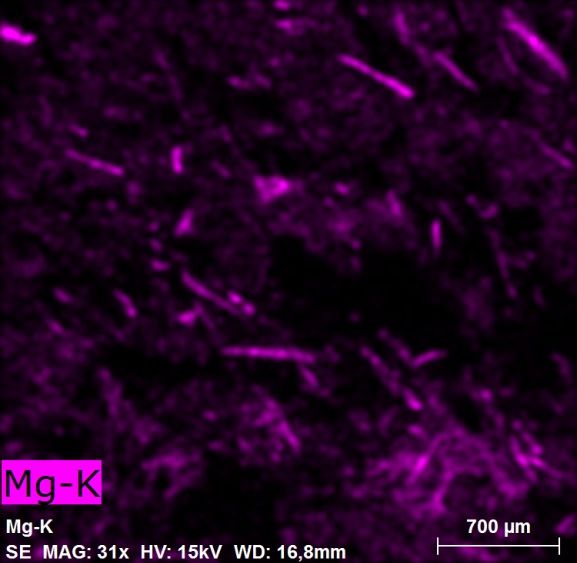
Appl. Sci. 2020, 10, 4048                                                                                                       7 of 17
          Appl. Sci. 2020, 10, x FOR PEER REVIEW                                                                      7 of 19

                                           (b)                                                      (c)

                                           (d)                                                      (e)

      Figure Figure  1. Scanning
             1. Scanning         electron
                             electron     microscope (SEM)
                                        microscope    (SEM) micrographs
                                                               micrographs   of of
                                                                                the the
                                                                                     surface  morphology
                                                                                          surface          of the of the
                                                                                                    morphology
             asbestos–cement
      asbestos–cement   (AC) (AC)  sample
                              sample      at various
                                       at various    magnifications (a-31;
                                                   magnifications    (a-31;b-115; c-138;
                                                                             b-115;      d-298;
                                                                                     c-138;     e-505).
                                                                                             d-298;  e-505).
               At some locations on the surface of this compact composite material sample, bundles of
       Typical EDS spectra of the samples (Figure 1c,e) are shown in Figures 2 and 3. The elemental
            asbestos fibers composed of primary fibers are clearly visible. The length of the fibers exceeded a few
 analysishundred
             of the areas    showsand
                       micrometers    some  differences
                                         their             in the
                                               thickness was   lessproportion    of the
                                                                     than 1 μm. EDS      characteristic
                                                                                      analysis was carriedelements   found on
                                                                                                            out on the
 and near     the surface
            whole            of samples,
                   area of the   the samples.   In accordance
                                         see Figure  1c,e.         with the XRF data, the EDS spectra show the major
 elements from        the EDS
                 Typical   cement    matrix
                                spectra of theand  chrysotile
                                               samples   (Figurefibers   of shown
                                                                  1c,e) are the ACinsamples.    Low3.contents
                                                                                      Figures 2 and               of elements
                                                                                                        The elemental
Appl. Sci. 2020, 10, x FOR PEER REVIEW                                                                                  8 of 19
            analysis  of the areas shows  some   differences in
 such as K, S and Co were observed resulting from foreign matter.the  proportion of the characteristic elements found
          on and near the surface of the samples. In accordance with the XRF data, the EDS spectra show the
          major elements cps/eV
                            from the cement matrix and chrysotile fibers of the AC samples. Low contents of
                      3.5 as K,O-KA
          elements such
                                      Mg-KAl-KSi-KA Au-MAB
                                                        S-KA K-KA Ca-KA
                                S and Co were observed resulting from foreign matter.
                                                                                       Fe-KA

                        3.0

                        2.5

                        2.0

                                   Au
                                  S     Fe
                        1.5         K O           Mg Al    Si       Au S         K    Ca                    Fe
                                    Ca

                        1.0

                        0.5

                        0.0
                              0              1                  2          3                4   5    6            7
                                                                                     keV

                   Figure 2. Energy-dispersive X-ray (EDS) spectrum of the sample from Figure 1c.
                  Figure 2. Energy-dispersive X-ray (EDS) spectrum of the sample from Figure 1c.

                              cps/eV
                                    O-KA         Mg-K Al-K Si-KA Au-MAB        K-KA Ca-KA                 Fe-KA
                        3.5

                        3.0

                        2.5
0.5
0.0
0 1 2 3 4 5 6 7
keV
Appl. Sci. 2020, 10, 4048 8 of 17
Figure 2. Energy-dispersive X-ray (EDS) spectrum of the sample from Figure 1c.
cps/eV
O-KA Mg-K Al-K Si-KA Au-MAB K-KA Ca-KA Fe-KA
3.5
3.0
2.5
2.0
Au Fe
1.5 K O Co Mg Al Si Au K Ca Fe Co
Ca
1.0
0.5
0.0
0 1 2 3 4 5 6 7
keV
Figure 3. EDS spectrum of the sample from Figure 1e.
Figure 3. EDS spectrum of the sample from Figure 1e.
The resulting contents obtained from the whole area of the asbestos–cement samples (Figure 1c,e)
and The
pointresulting
marked contents obtained
with a green fromFigure
cross (see the whole area
1a) are of the asbestos–cement
compared in Table 3. samples (Figure
1c,e) and point marked with a green cross (see Figure 1a) are compared in Table 3.
Table 3. Elemental analysis of the whole area of asbestos–cement sample (Area 1—Figure 1c;
Table 3. Elemental
Area 2—Figure 1e) analysis of the whole
and at a selected pointarea of asbestos–cement
(Figure 1a). sample (Area 1—Figure 1c; Area
2—Figure 1e) and at a selected point (Figure 1a).
Content (wt. %)
Element Content (wt.%)
Element Area 1 Area 2 Point
Area 1 Area 2 Point
Si 4.35 ± 0.32 9.79 ± 0.36 12.39 ± 0.39
SiCa 4.35 ± 0.32 9.79 ± 0.36 12.39
54.75 ± 1.48 31.70 ± 0.80
± 0.39
8.20 ± 0.21
Ca
Mg 54.75 ± 1.48
2.28 ±31.70
0.26 ± 0.80
1.33 ± 8.20
0.09 ± 0.21
14.43 ± 0.57
MgAl 2.28 ± 0.263.55 ±1.33
0.30± 0.09
0.63 ±14.43
0.06 ± 0.57 -
AlFe 3.55 ± 0.30 -0.63 ± 0.06 - - 1.25 ± 0.07
K - 0.52 ± 0.50 -
Fe - - 1.25 ± 0.07
O 22.05 ± 5.86 34.31 ± 3.78 33.47 ± 2.81
KC - 2.05 ±0.52 1.15± 0.50
6.48 ± 1.00 - 9.12 ± 0.94
OAu 22.05 ± 5.86
6.39 ±34.31
0.47 ± 3.78
15.25 ±33.47
0.50 ± 2.81
21.14 ± 0.59
Relatively large differences in the elemental analysis of the sample area and the individual point
on the micrographs of different magnification were recorded. These differences observed in the content
of elements are related to the composition heterogeneity. The highest content of magnesium was in the
place where asbestos fibers predominate in the cement matrix.
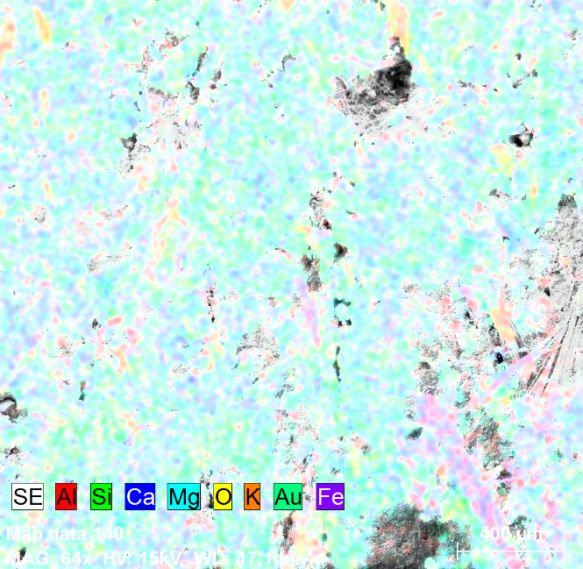
The distribution of all and the selected elements on the whole area of the AC sample identified by
EDS mapping is illustrated in Figure 4. Here, the inhomogeneity of the fiber bundles’ distribution can
be observed.Au 6.39 ± 0.47 15.25 ± 0.50 21.14 ± 0.59
Relatively large differences in the elemental analysis of the sample area and the individual
point on the micrographs of different magnification were recorded. These differences observed in
the content of elements are related to the composition heterogeneity. The highest content of
magnesium was in the place where asbestos fibers predominate in the cement matrix.
The distribution of all and the selected elements on the whole area of the AC sample identified
Appl. Sci. 2020, 10, 4048 9 of 17
by EDS mapping is illustrated in Figure 4. Here, the inhomogeneity of the fiber bundles’ distribution
can be observed.
Appl. Sci. 2020, 10, x FOR PEER REVIEW 10 of 19
Figure4. 4.SEM
Figure SEMmicrographs
micrographs of surface morphology
of surface morphologyof the
ofasbestos–cement sample
the asbestos–cement and map
sample andofmap
the areal
of the
distribution and relative
areal distribution proportion
and relative (intensity)
proportion of all andofthe
(intensity) all selected
and the elements (Si, Ca, Mg,
selected elements (Si,Al,
Ca,K)Mg,
over
Al,
the
K)scanned
over thearea (magnification
scanned 31 times). 31 times).
area (magnification
3.1.3. Fourier Transform Infrared (FTIR) Spectroscopy and X-ray Diffraction (XRD) Study of AC Waste
3.1.3. Fourier Transform Infrared (FTIR) Spectroscopy and X-ray Diffraction (XRD) Study of AC
Waste
Fourier transform infrared (FTIR) spectroscopy was used for the identification of asbestos fibers in
the AC sample. Chrysotile as a hydroxylated magnesium silicate has a structure consisting of brucite
Fourier transform infrared (FTIR) spectroscopy was used for the identification of asbestos fibers
octahedral sheets linked to tetrahedral sheets of silica, producing layers of the 1:1 group minerals.
in the AC sample. Chrysotile as a hydroxylated magnesium silicate has a structure consisting of
Figure 5 shows FTIR spectra of the asbestos–cement sample. The main characteristic of the spectra
brucite octahedral sheets linked to tetrahedral sheets of silica, producing layers of the 1:1 group
of chrysotile is the presence of two bands at 3686 cm−1 (strong) and 3638 cm−1 (very weak) attributed
minerals.
to the stretching vibrations of the surface hydroxyl groups (crystallographically distinct) of the Si–OH
Figure 5 shows FTIR spectra of the asbestos–cement sample. The main characteristic of the
and Mg–OH sheets in the chrysotile structure [53,54]. The chrysotile OH stretching mode at around
spectra−1of chrysotile is the presence of two bands at 3686 cm−1 (strong) and 3638 cm−1−1 (very weak)
3690 cm was also identified in the asbestos waste [55]. The peaks at 3452 and 1630 cm correspond
attributed to the stretching vibrations of the surface hydroxyl groups (crystallographically distinct)
to water molecules adsorbed into the chrysotile tubes. As shown in [56], Si–O stretching vibrations in
of the Si–OH and Mg–OH sheets in the chrysotile structure [53,54]. The chrysotile OH stretching
asbestos minerals are reflected by the strong absorption band at the 1200–900 cm−1 and 600–900 cm−1
mode at around 3690 cm was also identified in the asbestos waste [55]. The peaks at 3452 and 1630
−1
cm−1 correspond to water molecules adsorbed into the chrysotile tubes. As shown in [56], Si–O
stretching vibrations in asbestos minerals are reflected by the strong absorption band at the 1200–900
cm−1 and 600–900 cm−1 due to the vibration of the silicate chain, and the Si–O bending vibration. The
broad band located between 1100 and 900 cm−1 with a maximum at 1076, 1022 and 959 cm−1
represents the symmetric stretching vibrations of Si–O–Si and Si–O bonds in SiO4−4. In addition, O–HAppl. Sci. 2020, 10, 4048 10 of 17
due to the vibration of the silicate chain, and the Si–O bending vibration. The broad band located
between 1100 and 900 cm−1 with a maximum at 1076, 1022 and 959 cm−1 represents the symmetric
stretching vibrations of Si–O–Si and Si–O bonds in SiO4 −4 . In addition, O–H bending vibrations
were observed in the 950–600 cm−1 region. A broad O–H bending band is also present at 605 cm−1 .
The absorption bands centered at about 1449 and 876 cm−1 are due to the modes of the carbonate ions.
Peaks centered at 1150 and 700 cm−1 could be attributed to the vibrations of the bonds in SO4 −2 [55].
The bands at 605, 432 and 402 cm−1 are assigned to stretching of Mg–O and/or of Mg–OH bending
vibrations [54]. The typical band attributed to Mg–OH in brucite at 627 cm−1 probably could be
included in the wide band with a maximum intensity at 605 cm−1 . These bands observed at given
wave numbers are in good accordance with the results in [57,58]. The presence of silicates, carbonates,
and sulfates is obviously
Appl. Sci. 2020, 10, x FORrelated to the cement matrix.
PEER REVIEW 11 of 18
Figure 5. Fourier transform infrared (FTIR) spectrum of AC waste sample.
Figure 5. Fourier transform infrared (FTIR) spectrum of AC waste sample.
Figure 6 shows the XRD pattern of the powder sample of asbestos–cement. The diffraction peaks
Figure 6 shows the XRD pattern of the powder sample of asbestos–cement. The diffraction
correspond to the crystalline phases present in the cement matrix, and to the asbestos mineral chrysotile.
peaks correspond to the crystalline phases present in the cement matrix, and to the asbestos mineral
The mostchrysotile.
intense two The diffraction
most intenselinestwo are assigned
diffraction to are
lines presence
assignedof to
clinochrysotile (Mg3 Si2 O5 (OH)4 ,
presence of clinochrysotile
JCPDS no. (Mg327-1275)
Si2O5(OH)4at a basal
, JCPDS no. d hkl -spacing
27-1275) of 7.33
at a basal A (2θ ofangle
dhkl-spacing 7.33 Aof(2θ12.07)
angle and 3.65and
of 12.07) A 3.65
(2θ A= 24.37)
(see Table(2θ4).= Other
24.37) crystalline
(see Table 4). Other(calcium
phases crystalline phases (calcium
carbonates, carbonates,
and calcium and calcium
silicates) silicates)
originating from the
originating
cement matrix were from the cement
found: matrix were
(i) aragonite found:, (i)
(CaCO aragonite (CaCO3, JCPDS no. 41-1475); (ii) calcite
3 JCPDS no. 41-1475); (ii) calcite (CaCO3 , JCPDS no.
(CaCO3, JCPDS no. 01-0837); (iii) vaterite (CaCO3, JCPDS no. 33-0268); (iv) alite (Ca3SiO5, JCPDS no.
01-0837); (iii) vaterite (CaCO3 , JCPDS no. 33-0268); (iv) alite (Ca3 SiO5 , JCPDS no. 49-0442); (v) larnite
49-0442); (v) larnite (Ca2SiO4, JCPDS no. 29-0371). The presence of hydration products such as
(Ca2 SiO4portlandite,
, JCPDS no. 29-0371).
calcium silicateThe presence
hydrates, of hydration
calcium aluminateproducts
hydrates, such as portlandite,
ettringite, and calcium calcium
silicate hydrates, calcium aluminate
monosulfoaluminate formed in hydrates,
a long-termettringite,
hardened and calcium monosulfoaluminate
asbestos–cement sample was not identified.formed in a
long-term Byhardened
calculatingasbestos–cement
the crystallinity of thesample was
asbestos not identified.
cement By calculating
sample through Diffrac.EVA the crystallinity
v4.2.2 software in of the
asbestosthe range sample
cement of 10–80°through
2θ, it wasDiffrac.EVA
found that thev4.2.2
samplesoftware
contained in
only
the30% 10–80◦ 2θ,
of theofcrystalline
range phase and found
it was
up to 70% of the amorphous phase. As is known, the main hydration
that the sample contained only 30% of the crystalline phase and up to 70% of the amorphous phase. cement products—calcium
silicate hydrates (CSH phases)—are amorphous in nature with more complicated composition,
As is known, the main hydration cement products—calcium silicate hydrates (CSH phases)—are
therefore they were not observed on XRD pattern as expected. In addition, the presence of crystalline
amorphous phasesin nature with
of calcium more complicated
carbonates indicates thatcomposition,
the carbonationtherefore they were
degree increased notthe
during observed
long-term on XRD
pattern as expected.
aging process In addition,
of the the presence
asbestos–cement of crystalline phases of calcium carbonates indicates that
sample.
the carbonation degree increased during the long-term aging process of the asbestos–cement sample.Appl. Sci. 2020, 10, 4048 11 of 17
Appl. Sci. 2020, 10, x FOR PEER REVIEW 12 of 19
6. X-ray
FigureFigure diffraction
6. X-ray diffraction(XRD) pattern
(XRD) pattern of AC
of AC waste
waste sample.
sample.
Table 4. d4.hkl
Table -spacing
dhkl -spacing ofofclinochrysotile.
clinochrysotile.
hklhkl dd 2θ
2θ Intensity
Intensity
7.70681 11.473 11
002 7.70681
7.32795 11.473
12.068 10011
002020 7.32795
4.52638 12.068
19.597 16100
020004 4.52638
3.64902 19.597
24.373 71 16
004 3.64902
2.74175 24.373
32.634 6 71
131 2.74175
2.60217 32.634
34.438 9 6
131
−202 2.60217
2.53238 34.438
35.418 6 9
−202
202 2.53238
2.45262 35.418
36.610 16 6
202204 2.45262
2.09669 36.610
43.109 6 16
204060 2.09669
1.53239 43.109
60.355 12 6
060247 1.53239
1.31305 60.355
71.839 6 12
247 1.31305 71.839 6
The crystalline phases such as calcium carbonates and calcium silicates identified by the XRD
measurements correspond to the revealed zones rich in Ca and Si elements forming matrix
The crystalline phases
compounds (see Figuresuch as calcium
2b,c,e). Zones thatcarbonates and
can be related to calcium silicates
the magnesium identified
silicate compound by the XRD
measurements correspond to the revealed zones rich in Ca and Si elements forming matrix to
forming chrysotile fibers can be seen in Figure 2b,d. The presence of potassium can be attributed compounds
foreign matter present in the cement matrix.
(see Figure 2b,c,e). Zones that can be related to the magnesium silicate compound forming chrysotile
fibers can 3.2.
be seen in Figure
Monitoring 2b,d.Asbestos
of Airborne The presence
Fibers of potassium can be attributed to foreign matter present
in the cement Thematrix.
air concentrations of the released asbestos particles from the AC composite structures into
the indoor air during demolition of the construction elements in the selected building at seven work
3.2. Monitoring of Airborne Asbestos
posts corresponding Fibers sites were assessed by the mean values of the number
to floor sampling
concentrations of fibers before (BR), during (DR), and after removal (AR) of the materials containing
The air concentrations of the released asbestos particles from the AC composite structures into the
asbestos.
indoor air during demolition
In Figure ofnumber
7, the mean the construction elements
concentrations of asbestosinoccurring
the selected
in the building at seven
working indoor air arework posts
corresponding
given. to
Thefloor sampling
low mean values sites wereconcentrations
of number assessed byofthe meanfibers
asbestos values ofbuildings
in the the number
beforeconcentrations
ACP
removal
of fibers before were during
(BR), observed.(DR),
They ranged fromremoval
and after 111 to 257 m −3 and no sample exceeded the exposure limit
(AR) of the materials containing asbestos.
of 1000 m−3. The values obtained during the removal of ACM significantly depended on the work
In Figure 7, the mean number concentrations of asbestos occurring in the working indoor air are
site and time of sampling. The measurements carried out at the work posts during the
given. The low mean values of number concentrations of asbestos fibers in the buildings before ACP
removal were observed. They ranged from 111 to 257 m−3 and no sample exceeded the exposure limit
of 1000 m−3 . The values obtained during the removal of ACM significantly depended on the work site
and time of sampling. The measurements carried out at the work posts during the asbestos–cement
materials removal showed the mean number concentrations of asbestos fiber ranged from 318 up to
2063 m−3 . The differences in these measured values are probably related to the amount of AC materials
removed at a given sampling site in the building. The absolute highest mean fibers concentrations
were recorded at the sampling site located in the middle part of the building´s floor (sample C2).
This is consistent with the statement that the highest asbestos fiber concentration exceeded the hygieneAppl. Sci. 2020, 10, x FOR PEER REVIEW 13 of 19
asbestos–cement materials removal showed the mean number concentrations of asbestos fiber
ranged from 318 up to 2063 m−3. The differences in these measured values are probably related to the
amount of AC materials removed at a given sampling site in the building. The absolute highest
Appl. Sci. 2020,
mean10, 4048 concentrations were recorded at the sampling site located in the middle part of the 12 of 17
fibers
building´s floor (sample C2). This is consistent with the statement that the highest asbestos fiber
concentration exceeded the hygiene standard at the sampling sites inside buildings [15]. The
standardexposure
at the sampling −3 was exceeded
limit of 1000sites inside
m−3 was buildings
exceeded [15].
only at four The exposure
sampling limit
posts (B2; B3;ofC1;
1000
C2)m
during ACM
only at four sampling
removal. posts (B2;
The permissible B3; C1;limit
exposure C2)for
during
mineralACM removal.
fibrous The permissible
solid aerosols exposure
like asbestos in limit for
a working
environment is 0.1 cm −3
−3 (1.105 m−3). On the basis of this limiting value, all the determined
mineral fibrous solid aerosols like asbestos in a working environment is 0.1 cm (1.105 m ). On the −3
number
basis of concentrations do not pose
this limiting value, anydetermined
all the health risk. number concentrations do not pose any health risk.
Figure 7. Mean number concentrations of asbestos on the sampling sites in the building before, during,
and afterFigure 7. Mean
removal number concentrations of asbestos on the sampling sites in the building before,
of ACPs.
during, and after removal of ACPs.
The lower concentrations were measured two days after removal in the morning (108–295 m−3 ).
The lower concentrations were measured two days after removal in the morning (108–295 m−3).
These obtained values of fibers concentrations are similar to the concentrations measured outside the
These obtained values of fibers concentrations are similar to the concentrations measured outside
buildingthe
(i.e., 104–218
building m−3 ). The
(i.e., 104–218 m−3).measured
The measured airair
pollution
pollution levels
levels bybyasbestos
asbestos fibers
fibers are inare in accordance
accordance
with thewith
occurrence of fibers
the occurrence published
of fibers in in
published [18].
[18].
The mass Theconcentrations
mass concentrations of dust in in
of dust the
thestudied
studied work postswere
work posts werealsoalso determined.
determined. In Figure
In Figure 8, 8,
the mean values of mass concentrations of asbestos dust are presented.
the mean values of mass concentrations of asbestos dust are presented. Although demolition activities Although demolition
activities were performed under controlled conditions the fibrous dust was present in the indoor air
were performed under controlled conditions the fibrous dust was present3 in the indoor air and its mass
and its mass concentration values ranged from 0.077 to 2.64 mg/m . According to [46], the
concentration values ranged from 0.077 to 2.64 mg/m3 . According to [46], the permissible exposure
permissible exposure mass limit for the respirable fraction of asbestos dust in the air was not
mass limit for the respirable
established. fraction
For solid aerosols ofpossible
with asbestos dust ineffects,
fibrogenic the airthe
was not established.
highest exposure limitFor solid
in the aerosols
air of
with possible fibrogenic
a working environment effects,
is inthe
thehighest
range ofexposure limit
0.3 to 6 mg/m inamorphous
3 (for the air of asilica,
working
it wasenvironment
set at 0.3 mg/mis 3 in the
range ofand
0.3 4tomg/m
6 mg/m 3 (for amorphous
3 depending on the process of dust
silica, set at 0.3 mg/m3 and 4 mg/m3 depending on the
formation).
it was
process ofAppl.
dustSci.formation).
2020, 10, x FOR PEER REVIEW 14 of 19
Figure 8. Mean values of mass concentrations of asbestos dust on the work posts in the building before,
Figure 8. Mean values of mass concentrations of asbestos dust on the work posts in the building
during, and after removal of ACPs.
before, during, and after removal of ACPs.
Although fiber concentrations are considered to be a more relevant parameter than dust mass
concentration, the fiber-to-dust concentration ratio is often used as an indicator of occupational
exposure to asbestos [59]. The values of the calculated fiber/dust ratio for samples taken at four
sampling sites (B2; B3; C1; C2) with the measured highest concentrations during the demolition
work ranged from 0.745 × 10⁻³ to 1.41 × 10⁻³. These values are three orders of magnitude lower than
those found during processing in chrysotile mines [59]. It should be noted that numerous asbestosAppl. Sci.Figure
2020, 10,8.4048
Mean values of mass concentrations of asbestos dust on the work posts in the building 13 of 17
before, during, and after removal of ACPs.
Although
Although fiber
fiberconcentrations
concentrationsare areconsidered
considered to to be
be aa more
more relevant
relevantparameter
parameterthan than dust
dust mass
mass
concentration, the fiber-to-dust concentration ratio is often used as an indicator
concentration, the fiber-to-dust concentration ratio is often used as an indicator of occupational of occupational
exposure
exposure to to
asbestos
asbestos[59].
[59].The
The values
values of of the
the calculated fiber/dustratio
calculated fiber/dust ratiofor
forsamples
samplestaken
takenat at four
four
sampling
sampling sites (B2;(B2;
sites B3;B3;
C1;C1;C2)C2)
withwith
the the
measured
measured highest concentrations
highest concentrations during the the
during demolition work
demolition
ranged
work from
ranged 0.745 10−3 ×to101.41
from×0.745 −3 to × 10×−310
1.41 . −3These
. Thesevalues
valuesarearethree
three orders of of magnitude
magnitudelower lower than
than
those
those found
found duringprocessing
during processingininchrysotile
chrysotile mines
mines [59]. ItIt should
shouldbe benoted
notedthatthatnumerous
numerous asbestos
asbestos
concentrations
concentrations during
during thethe
ACMACM demolition
demolition activities
activities inin our
our case
case studywere
study werelower
lowerinincomparison
comparisontotothe
the measured
measured fiber concentrations
fiber concentrations in workplaces
in workplaces involvinginvolving
asbestosasbestos
mining and mining and processing.
processing. As
As illustrated
illustrated in Figure 9, there is a relationship between mean values
in Figure 9, there is a relationship between mean values of number and mass concentration of asbestos of number and mass
concentration
dust. It confirms of someasbestos dust. Itofconfirms
dependence the fibersome dependence
concentration of the
on the fiber concentration
measured on the
dust levels. However,
measured dust levels. However, the conclusion stated in [59] was not
the conclusion stated in [59] was not confirmed, i.e., that the fiber-to-dust ratio increased with confirmed, i.e., that the a
fiber-to-dust ratio increased with a
decreasing mass concentration of asbestos dust. decreasing mass concentration of asbestos dust.
Figure 9. Relationships between mean values of number and mass concentration of asbestos dust.
Figure 9. Relationships between mean values of number and mass concentration of asbestos dust.
4. Conclusions
This study focused on two important issues regarding the removal of asbestos-containing materials
incorporated into the construction of an old three-story industrial building. It also contributed to
the knowledge of the nature of asbestos–cement materials after their demolition and provided an
assessment of asbestos-fiber emissions during ACM removal, which is needed to protect public health.
This article is devoted to the description of a demolition working plan, the presentation of the
results obtained in characterizing the chemical and phase composition of the AC waste material, as
well as the surface morphologies in connection with mapping the distribution of the elements in the
demolition AC waste, and the interpretation of the measured concentrations of the released asbestos
dust during ACM dismantling compared to the concentrations before and after ACMs removal. These
measurements were made under controlled conditions in compliance with the Slovak legal regulations,
and personal hygiene and engineering controls during asbestos removal.
In view of the experimental investigations of AC waste samples taken from the selected sampling
sites, XRF and EDS techniques proved the presence of oxides/elements related to cement and asbestos
compounds without significant differences. Calcium silicates, calcium carbonate and chrysotile were
identified in the AC waste samples using FTIR and XRD analyses. The morphological observation of
the AC waste sample surface showed its relatively high roughness and the inhomogeneous distribution
of the bundles of asbestos fibers with clearly visible primary fibers. This inhomogeneity in fiber
bundles distribution on the whole studied area of the AC sample was observed through EDS mapping
of the magnesium and silicon elements.Appl. Sci. 2020, 10, 4048 14 of 17
More than 200 air samples from seven sampling sites were tested to determine the asbestos
dust number and mass concentrations. The relationship between the mean values of number and
mass concentrations of asbestos dust was proved. The determined number concentration of airborne
asbestos fibers during removal of asbestos containing materials in the building clearly demonstrated
the low concentration levels of asbestos respirable fibers, not exceeding the threshold value of 1000
fibers per one m3 , except in three spots out of all the sampling sites inside the building. Therefore,
the determined concentrations of asbestos dust during the demolition of ACPs do not pose any health
risk. These results clearly point to prioritizing the introduction of a demolition management system of
asbestos–cement products in buildings in terms of protecting workers from the harmful health impacts
of asbestos dust during the execution of such activities.
Author Contributions: N.S.: (1) initiated the overall research conceptualization, supervised the research work
and participated in experimental fibers monitoring; (2) analyzed data and interpreted the measured data, prepared
the original draft manuscript; (3) revised critically the content of paper. A.E.: (1) carried out experimental fibers
monitoring and XRF measurements; (2) contributed to manuscript writing. M.H.: performed and interpreted
XRD measurements. E.S.: (performed and interpreted FTIR measurements. K.C.: performed and interpreted EDS
and SEM measurements. All authors have read and agreed to the published version of the manuscript.
Funding: The authors are grateful to the Agency of the Ministry of the Education, Science, Research and Sport of
the Slovak Republic for the Structural Funds of EU for supporting the project NFP 26220120051 and VEGA project
No. 1/0648/17.
Acknowledgments: The authors thank Stefan Demcak for ensuring the EDS and SEM measurements of
asbestos–cement waste samples.
Conflicts of Interest: The authors declare no conflict of interest.
References
1. International Agency of Research on Cancer (IARC) monographs, suppl. 7, 1987, 139–142. In Overall
Evaluations of Carcinogenity: An Updating of IARC Monographs Volumes 1 to 42; International Agency of
Research on Cancer: Lyon, France, 1987.
2. World Health Organization (WHO). Elimination of Asbestos-Related Diseases. 2006. Available online:
https://apps.who.int/iris/handle/10665/69479 (accessed on 14 May 2020).
3. Abelmann, A.; Glynn, M.E.; Pierce, J.S.; Scott, P.K.; Serrano, S.; Paustenbach, D.J. Historical ambient
airborne asbestos concentrations in the United States—An analysis of published and unpublished literature
(1960s–2000s). Inhal. Toxicol. 2015, 27, 754–766. [CrossRef] [PubMed]
4. Światkowska,
˛ B.; Szeszenia-Dabrowska,
˛ N.; Wilczyńska, U. Medical monitoring of asbestos-exposed workers:
Experience from Poland. Bull. World. Health Organ. 2016, 94, 599–604. [CrossRef] [PubMed]
5. Baur, X.; Soskolne, C.L.; Lemen, R.A.; Schneider, J.; Woitowitz, H.J.; Budnik, L.T. How conflicted authors
undermine the World Health Organization (WHO) campaign to stop all use of asbestos: Spotlight on
studies showing that chrysotile is carcinogenic and facilitates other non-cancer asbestos-related diseases.
Int. J. Occup. Environ. Health 2015, 21, 176–179. [CrossRef]
6. Commission Directive 1999/77/EC of 26 July 1999. Official Journal of the European Communities, 6 August 1999.
7. Li, J.; Dong, Q.; Yu, K.; Liu, L. Asbestos and asbestos waste management in the Asian-Pacific region: Trends,
challenges and solutions. J. Clean. Prod. 2014, 81, 218–226. [CrossRef]
8. Baur, X.; Frank, A.L.; Budnik, L.T.; Woitowitz, H.J.; Oliver, L.C.; Welch, L.S.; Landrigan, P.; Lemen, R.
Collegium Ramazzini: Comments on the 2014 Helsinki consensus report on asbestos. Am. J. Ind. Med. 2016,
59, 591–594. [CrossRef] [PubMed]
9. Marsili, D.; Terracini, B.; Santana, V.S.; Ramos-Bonilla, J.P.; Pasetto, R.; Mazzeo, A.; Loomis, D.; Comba, P.;
Algranti, E. Prevention of asbestos-related disease in countries currently using asbestos. Int. J. Environ. Res.
Public Health 2016, 13, 494. [CrossRef] [PubMed]
10. Hurbánková, M. Ceramic fibres—Properties, use, effects on respiratory system. Czech Occup. Med. 2006,
4, 203–208.
11. Bobst, S. The history of risk assessment within OSHA and ACGIH: Asbestos case study. In History of Risk
Assessment in Toxicology, A Volume in History of Toxicology and Environmental Health; Bobst, S., Ed.; Elsevier:
Amsterdam, The Netherlands, 2017; pp. 27–30. [CrossRef]Appl. Sci. 2020, 10, 4048 15 of 17
12. OSHA Fact Sheet. Asbestos. Available online: https://www.osha.gov/Publications/OSHA3507.pdf (accessed
on 14 May 2020).
13. Directive 2003/18/EC of the European Parliament and of the Council of 27 March 2003 Amending Council
Directive 83/477/EEC on the Protection of Workers from the Risks Related to Exposure to Asbestos at
Work. Official Journal L 97, 15/04/2003, pp. 48–52. Available online: http://data.europa.eu/eli/dir/2003/18/oj
(accessed on 14 May 2020).
14. Directive 2009/148/EC of the European Parliament and of the Council of 30 November 2009 on the Protection
of Workers from the Risks Related to Exposure to Asbestos at Work. Official Journal L 330, 16.12.2009,
pp. 28–36. Available online: http://data.europa.eu/eli/dir/2009/148/oj (accessed on 14 May 2020).
15. Bujak-Pietrek, S.; Szadkowska-Stańczyk, I. Exposure to respirable asbestos fibers at various stage of asbestos
removal work. Med. Pr. 2012, 63, 191–198.
16. Neitzel, R.L.; Sayler, S.K.; Demond, A.H.; Arcy, H.; Garabant, D.H.; Franzblau, A. Measurement of asbestos
emissions associated with demolition of abandoned residential dwellings. Sci. Total Environ. 2020, 722, 137891.
[CrossRef]
17. Sakol, G.; Muszyňska-Graca, M. Air pollution during asbestos removal. Pol. J. Environ. Stud. 2019, 28, 1–5.
[CrossRef]
18. Szeszenia-Dabrowska,
˛ N.; Sobala, W.; Swiatkowska,
˛ B.; Stroszejn-Mrowca, G.; Wilczyńska, U. Environmental
asbestos pollution—Situation in Poland. Int. J. Occup. Med. Environ. Health 2012, 25, 3–13. [CrossRef]
[PubMed]
19. Lange, J.; Thomulka, K. Airborne exposure concentrations during asbestos abatement of ceiling and wall
plaster. Bull. Environ. Contam. Toxicol. 2002, 69, 712–718. [CrossRef] [PubMed]
20. Perkins, R.A.; Hargesheimer, J.; Fourie, W. Asbestos release from whole-building demolition of buildings
with asbestos-containing material. J. Occup. Environ. Hyg. 2007, 4, 889–894. [CrossRef] [PubMed]
21. Brown, S.K. Asbestos exposure during renovation and demolition of asbestos cement clad buildings. Am. Ind.
Hyg. Assoc. J. 1987, 48, 478–486. [CrossRef] [PubMed]
22. Darcy, D.J.; Feltner, C. Occupational and environmental exposure to asbestos. In Pathology of Asbestos-Associated
Diseases, 1st ed.; Oury, D., Sporn, T.A., Roggli, V.L., Eds.; Springer: Berlin/Heidelberg, Germany, 2014;
pp. 11–24.
23. Obminski, A.; Janeczek, J. The effectiveness of asbestos stabilizers during abrasion of asbestos-cement sheets.
Constr. Build. Mater. 2020, 249, 118767. [CrossRef]
24. Kinney, P.L.; Satterfield, M.H.; Shaikh, R.A. Aiborne fiber levels during asbestos operations and maitance
work in a large office building. Appl. Occup. Environ. Hyg. 1994, 9, 825–835. [CrossRef]
25. Boulanger, G.; Andujar, P.; Pairon, J.C.; Billon-Galland, M.A.; Dion, C.; Dumortier, P.; Brochard, P.; Sobaszek, A.;
Bartsch, P.; Paris, C.; et al. Quantification of short and long asbestos fibers to assess asbestos exposure:
A review of fiber size toxicity. Environ. Health 2014, 13, 59. [CrossRef]
26. Suzuki, Y.; Yuen, S.R.; Ashley, R. Short, thin asbestos fibers contribute to the development of human malignant
mesothelioma: Pathological evidence. Int. J. Hyg. Environ. Health 2005, 208, 201–210. [CrossRef]
27. IARC Monograph: Asbestos (Chrysotile, Amosite, Crocidolite, Tremolite, Actinolite, and Anthophyllite).
In Metals, Arsenic, Dusts and Fibres; IARC Monographs on the Evaluation of Carcinogenic Risks to Humans
Volume 100C; IARC: Lyon, France, 2012; pp. 219–309; Available online: http://monographs.iarc.fr/ENG/
Monographs/vol100C/mono100C-11.pdf (accessed on 14 May 2020).
28. Bernstein, D.M. The health risk of chrysotile asbestos. Curr. Opin. Pulm. Med. 2014, 20, 366–370. [CrossRef]
29. Hashim, D.; Boffetta, P. Occupational and environmental exposures and cancers in developing countries.
Ann. Glob. Health 2014, 80, 393–411. [CrossRef]
30. Kratzke, P.; Kratzke, R.A. Asbestos-related disease. J. Radiol. Nurs. 2018, 37, 21–26. [CrossRef]
31. Nynäs, P.; Pukkala, E.; Vainio, H.; Oksa, P. Cancer incidence in asbestos-exposed workers: An update on four
Finnish cohorts. Saf. Health Work 2017, 8, 169–174. [CrossRef]
32. Takala, J. Eliminating occupational cancer. Ind. Health 2015, 53, 307–309. [CrossRef]
33. Gilham, C.; Rake, C.; Hodgson, J.; Darnton, A.; Burdett, G.; Wild, J.P.; Newton, N.A.; Davidson, L.; Shires, M.;
Treasure, T.; et al. Current asbestos exposure and future mesothelioma risks in Britain: The Inhaled Particles
Study (TIPS). Int. J. Epidemiol. 2018, 47, 1745–1756. [CrossRef]You can also read