PROBING THE STRUCTURE OF A MASSIVE FILAMENT: ARTÉMIS 350 AND 450 ΜM MAPPING OF THE INTEGRAL-SHAPED FILAMENT IN ORION A
←
→
Page content transcription
If your browser does not render page correctly, please read the page content below
Astronomy & Astrophysics manuscript no. orion_artemis                                                                                ©ESO 2021
                                              April 9, 2021

                                                   Probing the structure of a massive filament: ArTéMiS 350 and
                                                   450 µm mapping of the Integral-Shaped Filament in Orion A?
                                               F. Schuller1, 2 , Ph. André1 , Y. Shimajiri3, 1 , A. Zavagno4 , N. Peretto5 , D. Arzoumanian6, 4 , T. Csengeri7 , V. Könyves8 ,
                                              P. Palmeirim6 , S. Pezzuto9 , A. Rigby5 , H. Roussel10 , H. Ajeddig1 , L. Dumaye1 , P. Gallais1 , J. Le Pennec1 , J. Martignac1 ,
                                                                                 M. Mattern1 , V. Revéret1 , L. Rodriguez1 , and M. Talvard1

                                                     1
                                                         Laboratoire d’Astrophysique (AIM), CEA, CNRS, Université Paris-Saclay, Université Paris Diderot, Sorbonne Paris Cité, 91191
                                                         Gif-sur-Yvette, France
                                                     2
                                                         Leibniz-Institut für Astrophysik Potsdam (AIP), An der Sternwarte 16, 14482 Potsdam, Germany - e-mail: fschuller@aip.de
                                                     3
                                                         National Astronomical Observatory of Japan, Osawa 2-21-1, Mitaka, Tokyo 181-8588, Japan
arXiv:2104.03717v1 [astro-ph.GA] 8 Apr 2021

                                                     4
                                                         Université Aix Marseille, LAM & Institut Universitaire de France, 38 rue F. Joliot-Curie, F-13388 Marseille CEDEX 13, France
                                                     5
                                                         Cardiff University, School of Physics & Astronomy, Queen’s buildings, The parade, Cardiff CF24 3AA, UK
                                                     6
                                                         Instituto de Astrofísica e Ciências do Espaço, Universidade do Porto, CAUP, Rua das Estrelas, PT4150-762 Porto, Portugal
                                                     7
                                                         Laboratoire d’Astrophysique de Bordeaux, Univ. Bordeaux, CNRS, B18N, allée Geoffroy Saint-Hilaire, 33615 Pessac, France
                                                     8
                                                         Jeremiah Horrocks Institute, University of Central Lancashire, Preston PR1 2HE, UK
                                                     9
                                                         INAF-IAPS, Via Fosso del Cavaliere 100, Rome, Italy
                                                    10
                                                         Institut d’Astrophysique de Paris, Sorbonne Université, CNRS (UMR 7095), 98 bis bd. Arago, 75014 Paris, France
                                                   Received xxx; accepted xxx

                                                                                                                ABSTRACT

                                                   Context. The Orion molecular cloud is the closest region of high-mass star formation. It is an ideal target to investigate the detailed
                                                   structure of massive star-forming filaments at high resolution and the relevance of the filament paradigm for the earliest stages of
                                                   intermediate- to high-mass star formation.
                                                   Aims. Within the Orion A molecular cloud, the integral-shaped filament (ISF) is a prominent, degree-long structure of dense gas and
                                                   dust, with clear signs of recent and on-going high-mass star formation. Our aim is to characterize the structure of this massive filament
                                                   at moderately high angular resolution (800 or ∼ 0.016 pc), in order to measure the intrinsic width of the main filament, down to scales
                                                   well below 0.1 pc, identified as the characteristic width of filaments.
                                                   Methods. We used the ArTéMiS bolometer camera at APEX to map a ∼0.6×0.2 deg2 region covering OMC-1, OMC-2, OMC-3 at 350
                                                   and 450 µm. We combined these data with Herschel-SPIRE maps to recover extended emission. The combined Herschel-ArTéMiS
                                                   maps provide details on the distribution of dense, cold material, with a high spatial dynamic range, from our 800 resolution up to the
                                                   transverse angular size of the map ∼ 10–150 . By combining Herschel and ArTéMiS data at 160, 250, 350 and 450 µm, we constructed
                                                   high-resolution temperature and H2 column density maps. We extracted radial intensity profiles from the column density map in
                                                   several, representative portions of the ISF, that we fitted with Gaussian and Plummer models to derive their intrinsic widths. We also
                                                   compared the distribution of material traced by ArTéMiS with that seen in the higher density tracer N2 H+ (1–0) recently observed
                                                   with the ALMA interferometer.
                                                   Results. All the radial profiles that we extracted show clear deviation from a Gaussian, with evidence for an inner plateau, previously
                                                   not clearly seen using Herschel-only data. We measure intrinsic half-power widths in the range 0.06 to 0.11 pc. This is significantly
                                                   larger than the Gaussian widths measured for fibers seen in N2 H+ , which probably traces only the dense innermost regions of the
                                                   large-scale filament. These half-power widths are within a factor of two of the value of ∼ 0.1 pc found for a large sample of nearby
                                                   filaments in various low-mass star-forming regions, which tends to indicate that the physical conditions governing the fragmentation
                                                   of prestellar cores within transcritical or supercritical filaments are the same over a large range of masses per unit length.
                                                   Key words. Stars: formation – Stars: massive – ISM: structure – Submillimeter: ISM – ISM: individual objects: Orion A

                                              1. Introduction                                                            the environmental conditions? Are there notable differences in
                                                                                                                         the physical processes leading to the formation of low-mass and
                                              It is well established that star formation takes place in dense            high-mass stars?
                                              molecular clumps embedded in large molecular clouds. The evo-
                                              lution of these dense clumps toward the onset of gravitational                 The Herschel Space Observatory has revealed ubiquitous fil-
                                              collapse and the formation of solar-type stars is relatively well          amentary structures in the cold interstellar medium (ISM) (e.g.
                                              understood in outline, but several key questions remain unan-              André et al. 2010; Molinari et al. 2010; Arzoumanian et al. 2011,
                                              swered: How do the star formation rate and efficiency depend on            2019; Schisano et al. 2020). Many subsequent studies, including
                                                                                                                         theoretical work (e.g. Federrath 2016), have confirmed how im-
                                                ?
                                                  This publication is based on data acquired with the Atacama            portant filaments are to the evolution of interstellar matter and
                                              Pathfinder Experiment (APEX), project 098.F-9304. APEX is a col-           star formation activity and supported a filament paradigm for
                                              laboration between the Max-Planck-Institut für Radioastronomie, the        star formation (see the review by André et al. 2014). However,
                                              European Southern Observatory, and the Onsala Space Observatory.           most detailed (resolved) studies to date have concentrated on a
                                                                                                                                                                    Article number, page 1 of 17
A&A proofs: manuscript no. orion_artemis

few, typically nearby clouds, where mostly low-mass and solar-          accurate, since zero-level offsets as estimated from Planck and
type stars are forming (Arzoumanian et al. 2011; Hacar et al.           IRAS data were applied (cf. Bernard et al. 2010).
2013; Könyves et al. 2015, among others).                                   Initial results from the HGBS observations towards Orion A
     The Orion A giant molecular cloud is the nearest site of ac-       were published by Roy et al. (2013), who investigated the physi-
tive star formation including high-mass stars. At a distance of         cal properties of the dust in this region, by Stutz et al. (2013),
only 410 pc (Menten et al. 2007; Stutz et al. 2018), it is an ideal     who made a systematic census of the reddest protostars, and
target to investigate the initial phases of high-mass star formation    by Polychroni et al. (2013), who found two different core mass
in great detail. It is located within the Barnard’s Loop, which is      functions for cores within and out of the filaments. Here, we fo-
part of a large complex of bubbles and filaments in a superbub-         cus on the northern part of the Orion A cloud, covering a large
ble (Ochsendorf et al. 2015). A large filamentary structure with        fraction of the ISF, including OMC 1, OMC 2, and OMC 3.
a length of several 10 pc is seen along the north-south direction           The Herschel-SPIRE parallel-mode data are affected by sat-
across Orion A. The densest part of this filament is a ∼1.5 deg         uration in the vicinity of the bright source Orion-KL: 55 pixels
long structure (∼10 pc if in the plane of the sky), known as the        cannot be used in the original (1000 /pixel) map at 350 µm, as well
integral-shaped filament (ISF, Bally et al. 1987). This structure       as 14 pixels in the original (1400 /pixel) map at 500 µm. We cor-
is clearly visible in dust continuum emission (Nutter & Ward-           rected for this by using dedicated SPIRE-only data taken toward
Thompson 2007; Shimajiri et al. 2011) or in CO molecular lines          Orion-KL and interpolating the values measured on neighbour-
(Kong et al. 2018; Suri et al. 2019). The Orion Nebula Cluster          ing pixels. This leads to an extra uncertainty in the flux calibra-
(ONC) appears approximately projected on the middle of this             tion for this region, which covers ∼0.70 × 20 , a scale well probed
dense filament.                                                         by the ArTéMiS observations (see below).
     On large physical scales (0.05 to 8.5 pc), Stutz & Gould
(2016) concluded from the analysis of Herschel data at ∼3600
angular resolution that the radial distribution of the gas surface      2.2. ArTéMiS observations
density near the ISF follows a power law. At much higher an-
                                                                        New observations were conducted with ArTéMiS installed at
gular resolution (4.500 ), using ALMA observations in the high-
                                                                        the APEX telescope (Güsten et al. 2006) in Chile. The first maps
density tracer N2 H+ (1–0) line, Hacar et al. (2018) argued that
                                                                        were acquired in July 2013, during the commissioning run of
the ISF contains a large number of fibers, organised in a com-
                                                                        the first incarnation of the camera, with only one focal plane
plex network. They measured emission profiles characterised by
                                                                        at 350 µm. Most observations were done with the current ver-
FWHM in the range 0.015–0.065 pc, with a median value of
                                                                        sion of ArTéMiS (Talvard et al. 2018), which covers the same
0.035 pc, significantly smaller than the typical 0.1 pc half-power
                                                                        ∼5×2.5 arcmin2 field of view at 350 and 450 µm, in several runs
width derived from Herschel column density maps in a num-
                                                                        between October and December 2016. All observations consist
ber of nearby molecular complexes (Arzoumanian et al. 2011,
                                                                        of large on-the-fly maps, with a scanning speed of 2000 /s (resp.
2019). Since these column density maps were derived from dust
                                                                        6000 /s) and steps between lines of 500 (resp. 3000 ) for the data
thermal emission in the sub-millimetre, they also trace lower
                                                                        taken in 2016 and in 2013, respectively. In total, about 16 hr
density material than the N2 H+ (1–0) transition. Therefore, the
                                                                        were spent on-source.
question remains open whether the observed difference in fila-
ment widths can be explained by the difference in the angular               The weather conditions were generally very good, with a to-
resolution of the data, or if they trace different material with dif-   tal amount of precipitable water vapour (PWV) between 0.25
ferent physical conditions.                                             and 0.7 mm. The zenith opacity at 350 and 450 µm was fre-
     With an angular resolution of 800 at 350 µm, more than three       quently measured with skydip observations and found to be be-
times better than Herschel at the same wavelength, the ArTéMiS          tween 0.8 and 1.2 at 350 µm, and between 0.6 and 1.1 at 450 µm.
camera installed at the APEX 12 m telescope (Revéret et al.             The absolute flux calibration was checked and corrected for us-
2014; André et al. 2016) is an ideal tool to probe the cold, dusty      ing maps of the primary calibrator Uranus and several secondary
ISM at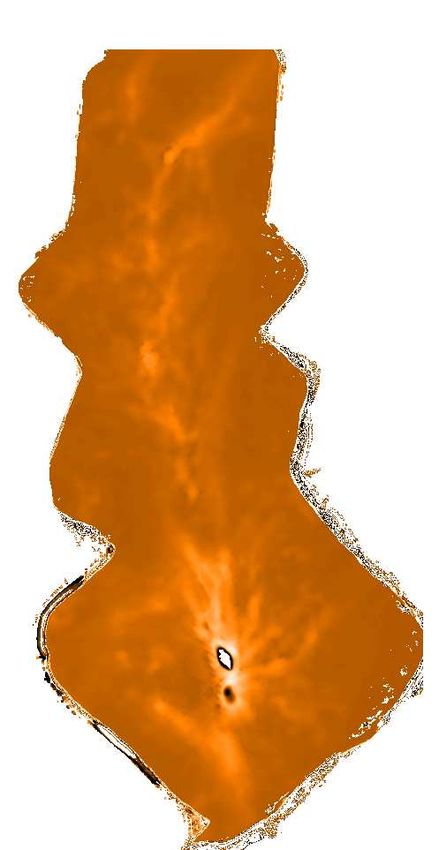
F. Schuller et al.: ArTéMiS mapping of the Integral-Shaped Filament in Orion A

Fig. 1. ArTéMiS maps at 350 µm combined with Herschel-SPIRE data at 350 µm (left) and at 450 µm combined with Herschel-SPIRE data at
500 µm (right), shown in logarithmic color scale. Some regions discussed in the text are indicated in the right panel.

et al. 1995). The immerge algorithm combines the available data      0) at 4.500 resolution. They report the detection of 55 fiber-like
in the Fourier domain after determining an optimal calibration       structures, with typical FWHM (as derived from Gaussian fit-
factor to align the flux scales of the input images (here from       ting) in the range 0.02 to 0.06 pc. We will discuss the associa-
ArTéMiS and SPIRE) in a common annulus of the uv plane.              tions of these fiber-like structures with the large-scale filament
Here, we adopted an annulus corresponding to the range of            seen in submillimetre continuum in Sect. 4.2.
baselines from 0.5 m (the baseline b sensitive to angular scales
λ/b ∼ 2.40 at λ = 350 µm) to 3.5 m (the diameter of the Herschel
telescope) to align the flux scale of the ArTéMiS 350 µm map         3. Radial profile analysis
to the flux scale of the SPIRE 350 µm map. We used the same
method to combine the ArTéMiS 450 µm data with Herschel-             3.1. High-resolution temperature and column density maps
SPIRE maps at 500 µm, which is the nearest wavelength ob-
served with SPIRE.                                                   In order to characterize the physical structures present in our
                                                                     maps, we first derived a map of H2 column density at the high-
    The combined maps at 350 µm and 450 µm, covering about
                                                                     est possible angular resolution, using the following method.
30×10 arcmin2 , are shown in Fig. 1. The effective resolution is
                                                                     First, we re-projected the Herschel-PACS 160 µm, SPIRE
∼800 and ∼1000 (FWHM) at 350 and 450 µm, respectively. The
                                                                     250 µm, ArTéMiS–SPIRE 350 µm and ArTéMiS 450 µm–
typical rms noise in this mosaic is between 0.3 and 0.5 Jy/800 -
                                                                     SPIRE 500 µm maps to a common grid and smoothed all data to
beam in regions with no strong emission at 350 µm. All the dis-
                                                                     a common angular resolution of 18.200 (the lowest resolution of
cussion in the following is based on this combined Scanamor-
                                                                     the above four maps, set by the SPIRE 250 µm data). We then
phos-processed-ArTéMiS and SPIRE map.
                                                                     generated a dust temperature map at 18.200 resolution by fitting a
    We stress that the ArTéMiS observations allow us not only        modified blackbody of the form Bν (T d ) × κν to the four measure-
to improve the angular resolution compared to Herschel, but also     ments between 160 µm and 500 µm on a pixel-by-pixel basis,
to properly measure the peak of the emission towards Orion-KL,       where Bν (T d ) is the Planck blackbody function at frequency ν
where the SPIRE emission maps are saturated.                         (or wavelength λ) for a dust temperature T d and κν (or κλ ) is
                                                                     the dust opacity. For simplicity and easier comparison with Her-
2.4. Archival ALMA observations in N2 H+
                                                                     schel work, our nominal assumption for the dust opacity law is
                                                                     the same as that adopted in HGBS papers:
Hacar et al. (2018) combined newly obtained ALMA data with
data from the IRAM 30 m telescope to build a map in N2 H+ (1–        κλ = 0.1 × (λ/300 µm)−β cm2 per g of gas + dust                  (1)
                                                                                                              Article number, page 3 of 17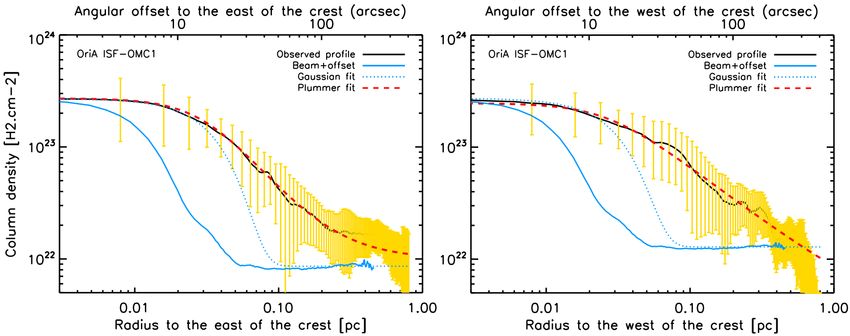
A&A proofs: manuscript no. orion_artemis
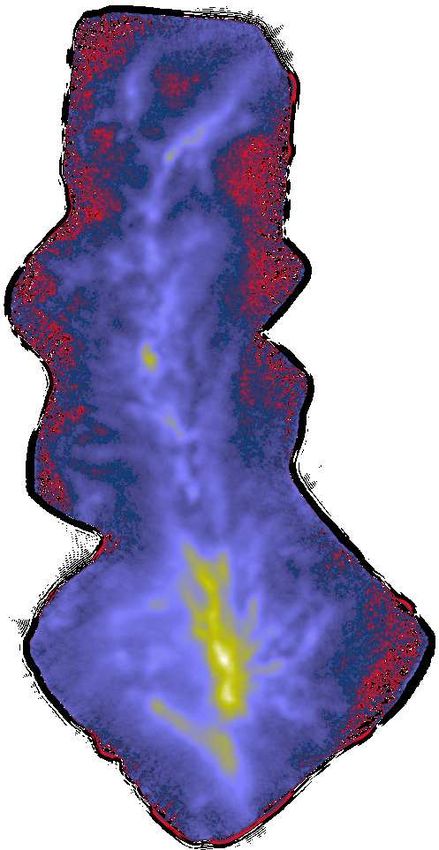
Fig. 3. Column density map at ∼800 resolution, derived from the 350 µm
Fig. 2. Dust temperature map at 1800 resolution, derived from the com- emission map and the temperature map shown in Fig. 2 assuming the
bined analysis of ArTéMiS and Herschel–PACS+SPIRE data. uniform dust opacity law given by Eq. (1) (see text for details).
with an emissivity index β = 2 (Hildebrand 1983; Roy et al.
2014). The resulting dust temperature map is shown in Fig. 2. emissivity index β, although the effect is rather small. For in-
The dust temperature values range from 14 K to 25 K in the stance, changing β from 2 to 1.5 would only increase the dust
northern part, and from 22 K to 52 K in the southern part of temperatures by ∼ 20% in the northern part, and by ∼ 35% on
our map, with the largest values (above 45 K) only found to- average in the southern part of the main filament. This would in
wards the Orion-KL Hii region. The general trends seen in our turn decrease the derived column densities by ∼ 50% and ∼ 70%
map agree well with the temperature map published by Lom- on average in the northern and southern parts, respectively. Ob-
bardi et al. (2014) based on Herschel data only, but our data servationally, the spectral index map obtained between 450 µm
provide a better spatial resolution and allow us to properly es- and 850 µm by Johnstone & Bally (1999) with SCUBA is con-
timate the temperature around the Orion-KL region, where the sistent with 1.5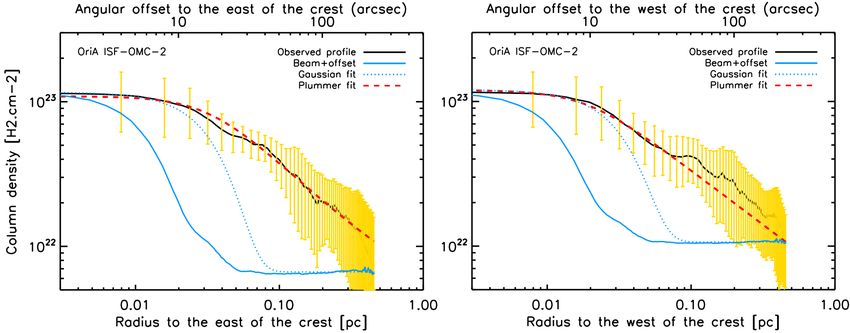
F. Schuller et al.: ArTéMiS mapping of the Integral-Shaped Filament in Orion A

                                                                               NHalt2 ) derived using Eq. (3) and the nominal maps (T dstd , NHstd2 )
                                                                               derived using Eq. (1). As expected, the alternative dust temper-
                                                                               ature map has slightly higher values than the nominal dust tem-
                                                                               perature map (Fig. 2) by ∼ 10–20% in the bulk of the integral
                                                                               filament and up to ∼ 50% toward Orion KL (see Fig. A.1). In
                                                                               the OMC-1 subregion, and especially in the immediate vicin-
                                                                               ity of Orion KL, the spectral energy distributions (SEDs) peak
                                                                               at wavelengths shorter than 160 µm and the dust temperature
                                                                               derived from measurements made longward of 160 µm is more
                                                                               uncertain. Accordingly, the alternative column density map has
                                                                               lower values than the nominal column density map (Fig. 3) by
                                                                               up to a factor of ∼ 3–4 toward Orion KL and only a factor of ∼ 2
                                                                               along the bulk of the integral filament (see Fig. A.2).

                                                                               3.2. Extraction of filamentary structures
                                                                               We applied the DisPerSE algorithm (Sousbie 2011) to a version
                                                                               of the ArTéMiS+SPIRE 350 µm image smoothed to 1600 resolu-
                                                                               tion to trace the crests of the most prominent filamentary struc-
                                                                               tures seen in our data, including the spine of the ISF. Apart from
                                                                               the main filament (i.e., the ISF), DisPerSE identified a network
                                                                               of fainter filamentary structures, most of which correspond to
                                                                               sub-filaments or branches directly connected to the ISF, espe-
                                                                               cially in the OMC-1 region (see Fig. 4)
                                                                                    In the present paper, we mostly focus our analysis on the den-
                                                                               sity structure of the main filament, whose DisPerSE crest is high-
                                                                               lighted in red and yellow in Fig. 4. We stress that the definition
                                                                               of this main crest depends only weakly on the algorithm used
                                                                               to trace filamentary structures. In particular, we checked that the
                                                                               crests obtained with the alternative algorithms FilFinder (Koch
                                                                               & Rosolowsky 2015) and getsf (Men’shchikov 2021) are very
Fig. 4. Skeleton map with the filament crests identified with DisPerSE         similar to that shown in Fig. 4 from DisPerSE (cf. Fig. B.1 in
overlaid on the ArTéMiS + SPIRE 350 µm map (logarithmic color                  Appendix B). Indeed, filament-finding algorithms tend to yield
scale). The numbers mark filament segments roughly corresponding to            consistent results for high-contrast filaments such as the ISF.
N2 H+ fibers discussed by Hacar et al. (2018), as listed in Col. 1 of Ta-           We constructed radial density profiles by taking perpendic-
ble 1. The yellow crest corresponds to the ISF portion referred to as          ular cuts at each pixel of the 800 -resolution column density map
"ISF-OMC-2/3" in the text, and the red one corresponds to "ISF-OMC-            along each filament crest, using a similar method to that used by
1".                                                                            André et al. (2016) for NGC 6334.
                                                                                    The column density profiles derived for the northern (OMC-
of κ300 may be a factor of 2 to 2.5 higher than our default value.             2 and OMC-3) and southern (OMC-1) parts of the main filament
In turn, the map shown in Fig. 3 may overestimate the actual col-              (the ISF) are shown in Figs. 5, 6 and 7. We also investigated a
umn density along the spine of the integral filament by a factor               smaller, relatively isolated filament (marked with number 9 in
of ∼2 to 2.5. Significant changes in dust opacity may also oc-                 Fig. 4) in the south-western part of our map (Figs. 9 and 10).
cur in the Orion bar and the photodissociation region around the
Hii region (cf. Salgado et al. 2016), but these do not affect our
                                                                               3.3. Fits to the radial profiles
analysis of the structure of the ISF away from OMC–1.
    To summarize and illustrate the influence of dust opacity un-              To estimate the physical width of each filament, we fitted the me-
certainties, we derived alternative temperature and column den-                dian column density profiles with both Gaussian and Plummer-
sity maps from a two-parameter fitting similar to that employed                like functions. We fitted the two sides of each filament sepa-
for Fig. 2 and Fig. 3 but using the following alternative opacity              rately to account for strongly-varying background emission. We
law instead of the nominal HGBS opacity law:                                   also cut the main filament in three portions, corresponding to the
                                                                               OMC-1, OMC-2 and OMC-3 subregions as marked in Fig. 1, to
κλ = 0.1 × (NH2 /NH0 2 )0.28 × (λ/300 µm)−β(NH2 ) cm2 g−1               (3)    account for the varying physical conditions between the northern
                                                                               and southern part of our map. While it is clear that other nearby
with NH0 2 = 1.7 × 1022 cm−2 and                                               features can affect individual measurements, the use of median
β(NH2 ) = {2 × [100 − (NH2 /1021 )] + 1.5 × [(NH2 /1021 ) − 1]}/99,            profiles allows us to derive the average global properties of each
i.e., a dust emissivity index decreasing linearly between β = 2 at             portion of the main filament.
NH2 = 1021 cm−2 and β = 1.5 at NH2 = 1023 cm−2 . This alterna-                     Most of the filamentary structures observed here exhibit
tive opacity law combines the trend found by Roy et al. (2013)                 power-law emission wings, so that Gaussian functions do not
with a plausible variation of β with column density. We show the               reproduce well their entire radial profiles, as evident in Figs. 5,
results in Appendix A, in the form of maps of relative difference              6 and 7. Only the inner part of the radial profiles was thus fit-
in temperature, (T dalt − T dstd )/T dstd (Fig. A.1), and column density,      ted with a Gaussian function. To do so, the width of each col-
(NHalt2 − NHstd2 )/NHstd2 (Fig. A.2), between the alternative maps (T dalt ,   umn density profile at half power above the background emis-
                                                                                                                        Article number, page 5 of 17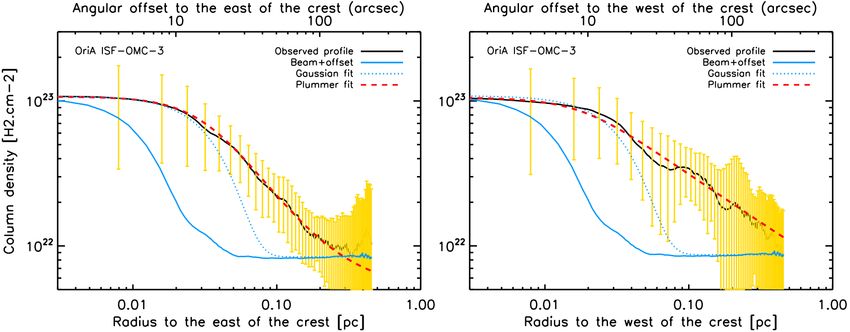
A&A proofs: manuscript no. orion_artemis

Fig. 5. Median radial profiles for the northernmost part of the ISF (black solid curves), covering OMC-3, measured on the H2 column density map
perpendicular to the filament crest (see Fig. 4), on the eastern (left panel) and western (right panel) sides of the filament. One data point is shown
every half beam (Nyquist sampling). The yellow error bars show the (±1σ) dispersion of the distribution of radial profiles observed along the
filament crest. The blue solid curves show the effective beam profile of the ArTéMiS 350 µm data shifted by a constant offset corresponding to the
typical background observed nearby. The blue dotted curves show the best-fit Gaussian (+ constant offset) model to the inner part of the observed
profile and the red dashed curves the best-fit Plummer model (convolved with the beam) on either side of the filament crest.

Fig. 6. Same as Fig. 5 for the portion of the main filament covering the OMC-2 region.

sion was first roughly estimated using the closest point to the              a more detailed description of the fitting procedure, see Sect. 3
filament crest for which the logarithmic derivative of the profile,          in Arzoumanian et al. (2019). For a cylindrical model filament
d ln NH2 /d ln r, showed a significant switch from negative to pos-          with a Plummer-like column density profile following Eq. (4),
itive (or negligible) values. The observed profile was then fitted           the underlying volume density profile has a similar form:
with a Gaussian function over a range of radii corresponding to
twice this initial width estimate.
                                                                                                    n0
    The Plummer-like model function that was fitted to the full              nPlummer (r) = h                i p/2 ,                              (5)
radial profile of H2 column density [N(r), after convolution with                            1 + (r/Rflat )2
the approximately Gaussian ∼ 800 beam of the observations] is
the following:
                                        p−1                                  where n0 is the central volume density of the filament. Moreover,
NPlummer (r) = N0 /[1 + (r/Rflat )2 ]    2    + Nbg ,                  (4)   n0 is related to the projected central column density N0 by the
where Rflat is the radius of the flat inner region with roughly con-         simple relation, n0 = N0 /(A p Rflat ), where A p = cos1 i × B 12 , p−1
                                                                                                                                                  2
stant emission in the profile, p is the power-law exponent of the            is a constant factor which depends on the inclination angle i of
profile at radii larger than Rflat , N0 is the central column den-           the filament to the plane of sky, and B is the Euler beta function
sity, and Nbg is the column density of the background cloud. For             (cf. Palmeirim et al. 2013).
Article number, page 6 of 17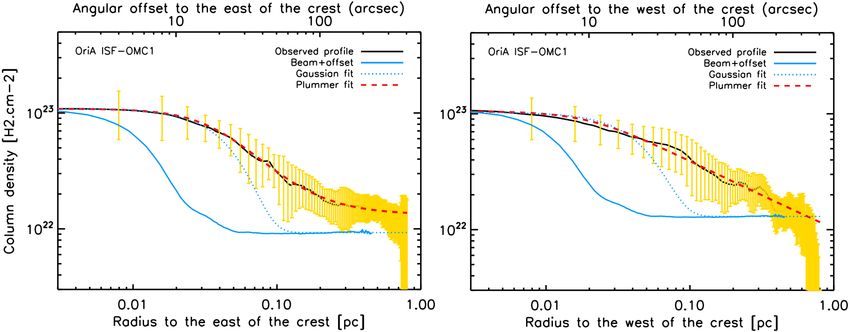
F. Schuller et al.: ArTéMiS mapping of the Integral-Shaped Filament in Orion A

Fig. 7. Same as Fig. 5 for the southern part of the main filament (including the OMC-1 region).

Table 1. Median inner widths of selected filaments, as derived from both Plummer and Gaussian fitting to the observed radial column density
profiles, and power-law indices of the best-fit Plummer profiles. The fibers’ numbers (Col. 1) refer to the fibers discussed by Hacar et al. (2018)
that we tentatively associate with some segments of the filaments seen with ArTéMiS (Sect. 4.2). Cols. 2 to 5 give the parameters of the best-fit
models on the H2 column density map (Fig. 3); the values in Cols. 6 to 8 were extracted from Fig. 10 in Hacar et al. (2018) and refer to the
structures seen in N2 H+ .

 Fiber /                          NH2 map (ArTéMiS + Herschel)                            FWHM (Hacar et al. 2018)
 Filament           Dflat            p          FWHM           DPlummer
                                                                 HP                       min  max     median
                    (pc)                        (pc)           (pc)                       (pc) (pc)    (pc)
 ISF-OMC-3
 West               0.04±0.01          1.7±0.3         0.06±0.02        0.08±0.02
 East               0.05±0.01          2.3±0.3         0.06±0.01        0.08±0.01
 ISF-OMC-2
 West               0.045±0.01         1.7±0.3         0.06±0.02        0.08±0.02
 East               0.06±0.01          2.0±0.2         0.06±0.01        0.11±0.02
 Fiber 41 (W)       0.045 ± 0.01       2.0±0.2         0.05±0.01        0.08±0.01         0.025     0.095     0.04
 Fiber 41 (E)       0.06 ± 0.01        2.2±0.3         0.05±0.02        0.09±0.02
 Fiber 44 (E)       (0.06 ± 0.02)      (2.0±0.3)       0.06±0.03        0.10±0.03         0.045     0.065     0.06
 Fiber 43 (W)       (0.04 ± 0.02)      (2.0±0.3)       0.05±0.01        (0.07±0.02)       0.02      0.06      0.035
 Fiber 43 (E)       (0.05 ± 0.02)      (2.3±0.3)       (0.08±0.02)      (0.07±0.02)
 Fiber 37 (W)       (0.07 ± 0.03)      (2.0±0.5)       (0.07±0.02)      (0.09±0.04)       0.03      0.11      0.05
 Fiber 37 (E)       0.09 ± 0.03        2.4±0.3         0.14±0.03        0.11±0.03
 ISF-OMC-1
 West               0.05±0.01          2.0±0.1         0.055±0.01       0.085±0.01
 East               0.05±0.02          2.4±0.3         0.06±0.01        0.06±0.02
 Fiber 29 (W)       (0.05 ± 0.02)      (2.3±0.5)       0.05±0.01        (0.07±0.02)       0.025     0.040     0.035
 Fiber 29 (E)       (0.06 ± 0.02)      (2.5±0.5)       0.07±0.01        0.11±0.02
 Fiber 21 (W)       0.04 ± 0.01        (2.0±0.3)       0.05±0.01        0.07±0.01         0.015     0.090     0.030
 Fiber 21 (E)       (0.04 ± 0.02)      (2.0±0.5)a      0.05±0.02        0.06±0.01
 Fiber 19 (W)       (0.06 ± 0.01)      (2.0±0.3)a      0.07±0.02        0.10±0.02         0.005     0.030     0.020
 Fiber 19 (E)       (0.04 ± 0.01)      (2.2±0.3)a      0.06±0.01        0.06±0.01
 Fiber 9 (W)        (0.04 ± 0.02)      (2.3±0.5)a      0.06±0.01        0.06±0.02         0.025     0.055     0.035
    Notes:
    − Unless otherwise specified, the Plummer fits on either side of each filament segment were performed over the whole range of radii shown in
    Figs. 5 to 7, i.e., from 0 to ∼ 0.45 pc; the Gaussian fits from 0 to twice the simple half-power radius derived without any fitting (see text), i.e.,
    typically ∼ 0.08–0.1 pc. The western side of the OMC-2 segment was fitted with a Plummer model only out to a radius of 0.08 pc due to the
    presence of a shoulder in the background beyond that radius (see Fig. 6b); the eastern side of the OMC-1 segment was fitted out to a radius
    0.3 pc; the western side of Fiber 9 out to a radius 0.1 pc.
    − The values shown in parentheses denote cases where the column density profile does not exhibit clear evidence of a power-law wing (for
    example Fiber 9, see Fig. 10), or where nearby emission strongly affects the measured profile, resulting in higher uncertainties in the fitted
    values.

                                                                                                                          Article number, page 7 of 17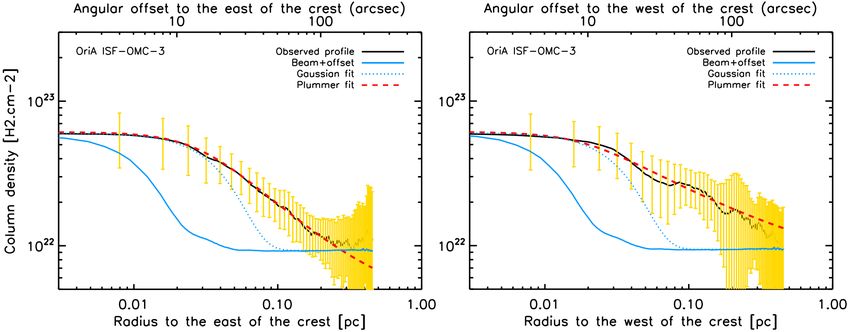
A&A proofs: manuscript no. orion_artemis

3.4. Results
We report the best-fit values of Dflat ≡ 2 × Rflat and p from
Plummer fitting, as well as the deconvolved FWHM widths from
Gaussian-fitting, for several segments of the ISF in Table 1. As
pointed out by several authors, the errors in Dflat and p are sig-
nificantly correlated, leading to some degeneracy in the deriva-
tion of these two parameters (e.g. Malinen et al. 2012; Smith
et al. 2014; Arzoumanian et al. 2019). For this reason, we also
provide, in the fifth column of Table 1, the half-power diameter
derived from Plummer fitting:
            q
                 2
  Plummer
DHP       = 2 p−1 − 1 × Dflat ,                                (6)
defined by:
NPlummer (DPlummer
           HP      /2) = N0 /2 + Nbg .                           (7)
The advantage of DPlummer
                      HP     is that it is a more robust estimator of   Fig. 8. Histogram of 221 independent individual width measurements
the inner width of a Plummer-like profile than Dflat because its        made at beam-spaced positions along the whole (OMC-1 + OMC-2
derivation is not as strongly correlated to that of p. It is worth      + OMC-3) ISF filament (solid black line), compared to a similar his-
pointing out that, for high-contrast filaments (Nbg             4   −3
                                                                                                                           ∼ 10 cm (cf.
the NGC 6334 filament (DPlummer
                              HP       = 0.16 ± 0.05 pc at 1.7 kpc,     Shirley 2015), it may not properly sample the outer parts of the
or 0.12 ± 0.03 pc adopting a revised distance of 1.3 kpc to             underlying radial density profiles, therefore biasing the results
NGC 6334 – cf. Chibueze et al. 2014). Particularly remarkable           toward lower width values.
is the similarity in width with the Taurus B211/B213 filament               The p exponents of the best-fit Plummer profiles for the var-
(DPlummer
    HP      = 0.11 ± 0.02 pc – Palmeirim et al. 2013) which has         ious portions of the ISF are consistent with the typical values
an order of magnitude lower column density than the ISF. The            p = 2.2 ± 0.3 found by Arzoumanian et al. (2019) for a large
Article number, page 8 of 17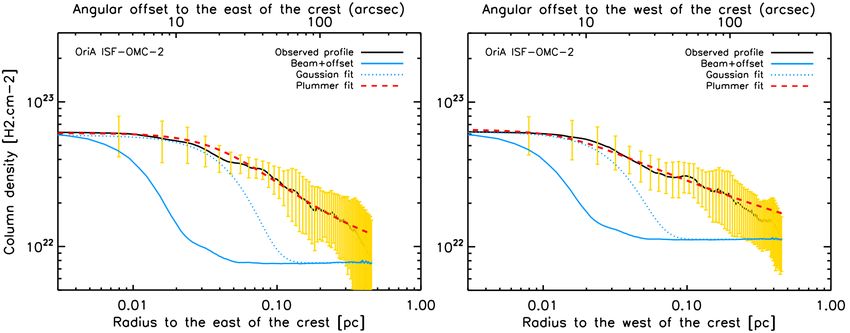
F. Schuller et al.: ArTéMiS mapping of the Integral-Shaped Filament in Orion A

        a)                             b)

Fig. 9. Comparison of our ArTéMiS column density map (cyan con-
tours) with a) the ALMA+30m N2 H+ moment-0 map from Hacar et al.
(2018) and b) the VLA+GBT NH3 moment-0 map from Monsch et al.
(2018) for the filament we associate with Fiber #9. The ArTéMiS col-      Fig. 10. Same as Fig. 5 for the south-western side of the filament ex-
umn density contours are 5, 7, and 9 × 1022 cm−2 . The green line shows   tracted with DisPerSE that coincides with Fiber #9 of Hacar et al.
the filament’s crest as derived with DisPerSE.                            (2018).

sample of nearby Herschel filaments in the Gould Belt. For the            line mass estimates were validated by comparison with the low-
ISF North, they are also roughly consistent with the power-law            resolution (50 ) dust optical depth map of Planck Collaboration
exponent p = 1.5 ± 0.5 reported by Mattern et al. (2018) for an-          et al. (2014). They are more than one order of magnitude higher
other wide sample of almost 200 larger-scale, velocity-coherent           than the line masses of the "fertile fibers" observed in the nearby
filaments in the inner Galaxy from the ATLASGAL 870 µm                    Taurus cloud (Hacar et al. 2013) or the many transcritical fila-
and SEDIGISM 13 CO(2–1) surveys (Schuller et al. 2009, 2017).             ments which dominate the filament line mass function (FLMF)
These relatively shallow exponents indicate that the main fila-           in the Arzoumanian et al. (2019) HGBS sample (see Fig. 1 of
ment features pronounced non-Gaussian wings of lower-density              André et al. 2019), but they are consistent with the bulk of con-
material that extend well beyond 0.1 pc from the ridge, as evident        firmed Galactic filaments discussed by Mattern et al. (2018). Our
in Figs. 5 to 7. The profile of the ISF-OMC-1 is strongly affected        measurements are also in agreement with the results of Schisano
by the Orion-KL star forming region, resulting in a somewhat              et al. (2020), who found a mean value of 250 M /pc for a sample
steeper exponent.                                                         of 18,000 Galactic filaments with reliable distance estimates. It
    The mean central H2 densities inferred from our Plummer fits          is not surprising to find such high line mass values in the Orion
range from ∼ 4×105 cm−3 for OMC-3 and OMC-2 to ∼ 106 cm−3                 ISF, since it is known to be undergoing fragmentation and ongo-
for OMC-1, assuming the ISF is in the plane of the sky (i.e.,             ing embedded star formation (e.g. Takahashi et al. 2013; Teixeira
i = 0). The mean central density we infer for the OMC-1 portion           et al. 2016).
of the ISF is a factor of 3 lower than the nominal volume den-
sity of 3 × 106 cm−3 found by Teng & Hirano (2020) for N2 H+              4. Discussion
filamentary structures in OMC-1 (outside of cores) through non-
LTE modeling of the N2 H+ (3–2) and (1–0) lines. Our dust con-            4.1. Density structure
tinuum estimate of the volume density is however affected by a
                                                                          The large scale distribution of gas and dust in the northern part
rather large uncertainty of a factor of ∼2–3 or more in the OMC-
                                                                          of Orion A is dominated by the ISF. Based on a column density
1 subregion, due to particularly uncertain dust opacity and tem-
                                                                          map at 3600 resolution built from Herschel GBS data, Stutz &
perature gradient effects in this unusually dense and strongly ir-
                                                                          Gould (2016) found that the radial distribution of gas near the
radiated area (see, e.g., Figs. A.1 & A.2 in Appendix A). The
                                                                          ISF is well represented by a power law. They reported a line
N2 H+ density estimates of Teng & Hirano (2020) are also uncer-
                                                                          mass profile λ(w) (in M /pc) as a function of enclosing radius w
tain by a factor of ∼3 (see their Table 3). Given these uncertain-
                                                                          that follows well the function:
ties, the two sets of density estimates are broadly consistent.
                                                                                        !γ
    By integrating the radial profiles measured in the column                         w
density map of Fig. 3 over radius up to DHP , i.e., twice the half-       λ(w) = K         ,                                            (8)
                                                                                     pc
power radius, we also derived robust estimates of the mean mass
per unit length of the inner portion of each ISF segment, exclud-         with K = 385 M /pc and γ=3/8. This value of K was derived
ing low-density material at large radii. The Herschel GBS results         assuming the dust opacity law OH5 of Ossenkopf & Henning
suggest that most stars form within this inner portion of molec-          (1994), which roughly corresponds to the same dust opacity pa-
ular filaments (e.g. Könyves et al. 2015, 2020). We obtained              rameterization as adopted in Sect. 3 but with β = 1.8 instead
average values of ∼ 200 M /pc for OMC-3, ∼ 250 M /pc for                  of β = 2. More precisely, the OH5 dust opacity at ArTéMiS
OMC-2, ∼ 500 M /pc for the OMC-1 portion, and ∼ 300 M /pc                 wavelengths is a factor ∼30% higher than the HGBS opacity law
for the whole northern ISF (i.e., OMC-1+OMC-2+OMC-3). For                 of Eq. (1). Equation (8) also corresponds to a line mass profile
the filament shown in Fig. 9, which can be associated with fiber          averaged over the full 1◦ length of the ISF, including a 0.4◦ -
#9 of Hacar et al. (2018), we estimate a mean line mass of                long portion south of the field mapped with ArTéMiS, whose
∼ 100 M /pc (see the column density profile in Fig. 10). These            average column density is a factor of 2 or more lower than the
                                                                                                                   Article number, page 9 of 17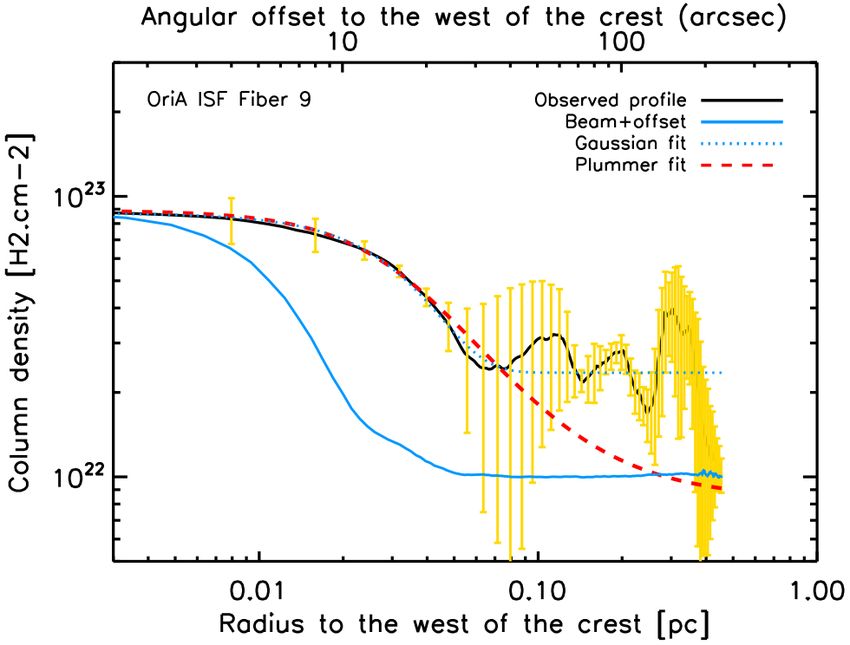
A&A proofs: manuscript no. orion_artemis

                                                                            Fig. 12. Comparison between the inner widths (DPlummer
                                                                                                                                 HP     ) measured on
                                                                            the high-resolution column density map (Fig. 3) and the FWHM fitted
                                                                            on the associated fibers seen in N2 H+ . Each point is located at the aver-
                                                                            age of the DPlummer
                                                                                         HP     values measured eastward and westward of the crest
                                                                            vs. the median value of the fiber’s distribution of FWHMs. The error
                                                                            bars indicate the full range of values on both axes. The red dotted line
                                                                            shows the position of a linear fit to the data.

Fig. 11. ALMA N2 H+ moment-0 map (from Hacar et al. 2018) overlaid
with our H2 column density map (black contours) for the ISF-OMC-2           files of different segments of the ISF, corresponding to different
region. The thick white line shows the crest of the filament extracted
                                                                            ranges in declination, as shown in Fig. 11. For each segment, we
with DisPerSE. The thin horizontal lines indicate the limits of the vari-
ous segments discussed in § 4.2.1.                                          give the parameters of the best-fit Plummer and Gaussian models
                                                                            in Table 1, together with the range of FWHM measured in N2 H+
                                                                            by Hacar et al. (2018) for each fiber that we tentatively associate
northern part of the ISF discussed here according to Herschel               with the ArTéMiS filaments (see also Fig. 4 for the numbering
and Planck data. Considering these differences, the average line            of the fibers).
mass of ∼ 300 M /pc that we derived in Sect. 3.4 for the north-                  The segment from δ = −05◦ 110 to δ = −05◦ 090 3000 , which
ern part of the ISF, integrated over a transverse enclosing radius          roughly corresponds to fiber #43 from Hacar et al. (2018), con-
DHP ∼ 0.07–0.1 pc, is consistent with the value of K reported by            tains the bright infrared source OMC-2 FIR 4. The values of
Stutz & Gould (2016) for a radius w = 1 pc.                                 the inner width that we measure for this segment (DPlummer
                                                                                                                                     HP      =
     The column density map used by Stutz & Gould (2016) is                 0.07 ± 0.025 pc) are in the lowest boundary of our sample. How-
sensitive to scales between 0.05 pc and 8.5 pc. Based on our                ever, we caution the reader that this measurement is strongly af-
higher resolution data, we find an inner plateau with a total half-         fected by the presence of the centrally-condensed protostellar
power width of order ∼ 0.06 pc to 0.11 pc (see Table 1). There-             source OMC-2 FIR 4 within this short segment (Shimajiri et al.
fore, while our results are consistent with the analysis of Stutz           2008; López-Sepulcre et al. 2013). Assessing the intrinsic width
& Gould (2016), they allow us to resolve an inner break in the              of the underlying parent filament at this location is more uncer-
radial density/line mass profile of the ISF that could not be seen          tain. Nevertheless, such peculiar sources have very little effect
with Herschel data only.                                                    on our estimates of the global properties of the ISF, since we
     From their analysis at 3600 resolution, Stutz & Gould (2016)           evaluated them from median radial profiles.
did not find any significant variation of the column density pro-
file along the extent of the ISF, but this is not surprising since          4.2.2. ISF-OMC-1
they did not resolve the inner plateau in the density profile.
                                                                            In the southern part of our ArTéMiS map, we also split the ISF in
                                                                            several segments, but only north of the Hii region Orion-KL. We
4.2. Comparison with high-density fibers
                                                                            tentatively associated these segments with fibers seen in N2 H+
Although it is nearly impossible to associate each N2 H+ fiber              (see numbering in Fig. 4). The inner widths as measured from
reported by Hacar et al. (2018) with the ArTéMiS/SPIRE fila-                Gaussian and Plummer models fitting are also given in Table 1,
ments that we extracted with DisPerSE, we will now discuss a                together with the FWHM measured in the N2 H+ data.
few examples.                                                                   Here also, we derive inner widths significantly smaller than
                                                                            0.1 pc for some portions of the main filament (e.g. the segment
                                                                            associated with fiber 21), where a dense protostellar core is em-
4.2.1. ISF-OMC-2                                                            bedded and locally affects our measurements.
First, we focus on the northern part of the ISF, where the main
filament shows a relatively clear structure as compared to the              4.2.3. Comparison between ArTéMiS and N2 H+
highly complex network of filaments around the extreme region
Orion-KL. The map published by Hacar et al. (2018) covers only              We show in Fig. 12 the comparison between the DPlummer
                                                                                                                                 HP       diame-
−05◦ 250 ≤ δ ≤ −05◦ 050 ; therefore we will consider only the               ters measured on our column density map and the FWHM of the
southern part of what we called ISF-OMC-2/3, roughly corre-                 N2 H+ fibers that we associated with the different segments of the
sponding to OMC-2. We analyzed the radial column density pro-               ISF, as listed in Table 1. This figure shows that there is a trend of
Article number, page 10 of 17
F. Schuller et al.: ArTéMiS mapping of the Integral-Shaped Filament in Orion A
increasing FWHM for the N2 H+ fibers with increasing DPlummer HP : – The mean line masses that we derive from our data (be-
a linear fit to the data results in a slope of 0.53 (±0.24) and an in- tween ∼100 and ∼ 500 M /pc) are in the extreme upper
tercept of -0.005 (±0.020); the Pearson correlation coefficient is range of those found for Herschel filaments in the Gould
equal to 0.66. Although the correlation is only marginal, we in- Belt (Arzoumanian et al. 2019; André et al. 2019), and also
terpret this as an indication that N2 H+ emission generally traces in the upper range of those measured for more than 18,000
the densest portion along the central axis of the main filament. filaments found in the Hi-GAL survey by Schisano et al.
Slight but significant deviations between the peaks of N2 H+ (2020). Our values are comparable to the line masses mea-
emission and the filament crests traced by our submillimeter dust sured for larger-scale filaments throughout the Galaxy in the
continuum data are visible in some cases such as the filament as- APEX/SEDIGISM survey (Mattern et al. 2018); this is con-
sociated with fiber #9 of Hacar et al. (2018) (see Fig. 9a). In sistent with the picture in which filament fragmentation and
that particular case, it is noteworthy that there is better agree- star formation occurs within the densest, transcritical or su-
ment between the ArTéMiS-SPIRE filament and the filamen- percritical portions of long, roughly ∼ 0.1 pc wide filaments.
tary structure detected in NH3 by Monsch et al. (2018) at 600
resolution (see Fig. 9b) At least in projection, fiber #9 lies be- The present study also highlights the importance of combin-
tween two large-scale H2 “fingers” associated with the explosive ing data covering a wide range of spatial scales, and probing
CO outflow emanating from the immediate vicinity of Orion KL material at various densities. In particular, large, high-resolution
(cf. Zapata et al. 2009; Bally et al. 2017). The southern end of dust continuum maps with a high spatial dynamic range can ef-
fiber #9 also overlaps with the area where high-velocity CO(6-5) ficiently trace a broad range of column densities, while comple-
emission was detected in the APEX observations of Peng et al. mentary spectroscopic data are either sensitive to the densest in-
(2012). As CO is known to be a destroyer of N2 H+ (e.g. Aikawa ner regions of filaments (e.g. N2 H+ ) or to the surrounding diffuse
et al. 2001), it is possible that energetic finger-like outflow fea- medium (e.g. CO and isotopologues).
tures may significantly reduce the abundance of N2 H+ in the lat- Acknowledgements. We thank the anonymous referee for their detailed re-
eral edges of the dense filamentary structure. Strong anisotropic port, which helped us improving the robustness and the presentation of our
irradiation of fiber #9 by the Orion nebula (see, e.g., the dust results. We are very thankful for the continuous support provided by the
APEX staff during ArTéMiS operations. FS acknowledges support from a
temperature map shown in Fig. 2) may also play a role via des- CEA/Marie Sklodowska-Curie Enhanced Eurotalents fellowship. DA acknowl-
orption of CO molecules from grain mantles. In any event, com- edges support by FCT/MCTES through national funds (PIDDAC) by the grant
parison of the N2 H+ map of Hacar et al. (2018) with the NH3 UID/FIS/04434/2019. PP acknowledges support from FCT through the research
map of Monsch et al. (2018) clearly indicates that the abundance grants UIDB/04434/2020 and UIDP/04434/2020. PP receives support from fel-
lowship SFRH/BPD/110176/2015 funded by FCT (Portugal) and POPH/FSE
of N2 H+ is far from uniform in the OMC-1 region. The most ex- (EC). Part of this work has received support from the European Research Council
treme difference between the two maps is that no N2 H+ emission under the European Union’s Seventh Framework Programme (ERC Advanced
is detected in the immediate vicinity of Orion KL (see also Teng Grant Agreement no. 291294 – ORISTARS), from the French National Re-
& Hirano 2020), presumably due to the destruction of N2 H+ by search Agency (Grant no. ANR–11–BS56–0010 – STARFICH), and from “Ile
de France” regional funding (DIM-ACAV+ Program). We also acknowledge
CO, while strong NH3 (1,1) and NH3 (2,2) emission is seen in support from the French national programs of CNRS/INSU on stellar and ISM
the Monsch et al. (2018) data and a prominent column density physics (PNPS and PCMI). The present study has made use of data from the Her-
peak is observed in our data (cf. Figs. 1& 3). schel Gould Belt survey (HGBS) project (http://gouldbelt-herschel.cea.fr). The
HGBS is a Herschel Key Programme jointly carried out by SPIRE Specialist
Astronomy Group 3 (SAG 3), scientists of several institutes in the PACS Con-
sortium (CEA Saclay, INAF-IFSI Rome and INAF-Arcetri, KU Leuven, MPIA
5. Conclusions Heidelberg), and scientists of the Herschel Science Center (HSC). This docu-
ment was prepared using the Overleaf web application, which can be found at
We presented 350 and 450 µm observations with ArTéMiS of www.overleaf.com.
the integral shaped filament in Orion, the nearest site of active
high- and intermediate-mass star formation. With angular resolu-
tions of 800 and 1000 , the ArTéMiS data, combined with Herschel-
SPIRE maps to recover large-scale emission, probe scales from References
0.015 pc to a few pc. By combining the new ArTéMiS data with Aikawa, Y., Ohashi, N., Inutsuka, S.-i., Herbst, E., & Takakuwa, S. 2001, ApJ,
Herschel data at shorter wavelengths, we could build for the first 552, 639
time high-resolution temperature and column density maps cov- André, P., Arzoumanian, D., Könyves, V., Shimajiri, Y., & Palmeirim, P. 2019,
ering a large region around OMC 1 that are not affected by satu- A&A, 629, L4
André, P., Bouwman, J., Belloche, A., & Hennebelle, P. 2003, in SFChem 2002:
ration; these maps are publicly available from the CDS1 Chemistry as a Diagnostic of Star Formation, ed. C. L. Curry & M. Fich, 127
We extracted the radial profiles and intrinsic widths of sev- André, P., Di Francesco, J., Ward-Thompson, D., et al. 2014, Protostars and Plan-
eral segments of the Orion ISF from the high-resolution column ets VI, 27
density map. Our conclusions can be summarized as follows: André, P., Men’shchikov, A., Bontemps, S., et al. 2010, A&A, 518, L102
André, P., Revéret, V., Könyves, V., et al. 2016, A&A, 592, A54
Arzoumanian, D., André, P., Didelon, P., et al. 2011, A&A, 529, L6
– We resolve an inner plateau with a typical half-power width Arzoumanian, D., André, P., Könyves, V., et al. 2019, A&A, 621, A42
in the range 0.06 to 0.11 pc along the northern and southern Bally, J., Ginsburg, A., Arce, H., et al. 2017, ApJ, 837, 60
parts of the main filament. This plateau could not be seen Bally, J., Langer, W. D., Stark, A. A., & Wilson, R. W. 1987, ApJ, 312, L45
in the Herschel-SPIRE data because of their limited spatial Bernard, J.-P., Paradis, D., Marshall, D. J., et al. 2010, A&A, 518, L88
Bouwman, J., Meeus, G., de Koter, A., et al. 2001, A&A, 375, 950
resolution of ∼0.06 pc; Chibueze, J. O., Omodaka, T., Handa, T., et al. 2014, ApJ, 784, 114
– These values of the inner width are consistent within bet- Federrath, C. 2016, MNRAS, 457, 375
ter than a factor of 2 with the values measured in several Güsten, R., Nyman, L. Å., Schilke, P., et al. 2006, A&A, 454, L13
nearby molecular clouds of the Gould Belt (Arzoumanian Hacar, A., Tafalla, M., Forbrich, J., et al. 2018, A&A, 610, A77
Hacar, A., Tafalla, M., Kauffmann, J., & Kovács, A. 2013, A&A, 554, A55
et al. 2011, 2019; Palmeirim et al. 2013), or in the massive Hildebrand, R. H. 1983, QJRAS, 24, 267
star-forming complex NGC 6334 (André et al. 2016); Johnstone, D. & Bally, J. 1999, ApJ, 510, L49
Koch, E. W. & Rosolowsky, E. W. 2015, MNRAS, 452, 3435
1
Link to A&A online or to the CDS... Kong, S., Arce, H. G., Feddersen, J. R., et al. 2018, ApJS, 236, 25
Article number, page 11 of 17A&A proofs: manuscript no. orion_artemis Könyves, V., André, P., Arzoumanian, D., et al. 2020, A&A, 635, A34 Könyves, V., André, P., Men’shchikov, A., et al. 2015, A&A, 584, A91 Lombardi, M., Bouy, H., Alves, J., & Lada, C. J. 2014, A&A, 566, A45 López-Sepulcre, A., Taquet, V., Sánchez-Monge, Á., et al. 2013, A&A, 556, A62 Malinen, J., Juvela, M., Rawlings, M. G., et al. 2012, A&A, 544, A50 Mattern, M., Kauffmann, J., Csengeri, T., et al. 2018, A&A, 619, A166 Men’shchikov, A. 2021, arXiv e-prints, arXiv:2102.11565 Menten, K. M., Reid, M. J., Forbrich, J., & Brunthaler, A. 2007, A&A, 474, 515 Molinari, S., Swinyard, B., Bally, J., et al. 2010, A&A, 518, L100 Monsch, K., Pineda, J. E., Liu, H. B., et al. 2018, ApJ, 861, 77 Nutter, D. & Ward-Thompson, D. 2007, MNRAS, 374, 1413 Ochsendorf, B. B., Brown, A. G. A., Bally, J., & Tielens, A. G. G. M. 2015, ApJ, 808, 111 Ossenkopf, V. & Henning, T. 1994, A&A, 291, 943 Palmeirim, P., André, P., Kirk, J., et al. 2013, A&A, 550, A38 Peng, T. C., Zapata, L. A., Wyrowski, F., Güsten, R., & Menten, K. M. 2012, A&A, 544, L19 Planck Collaboration, Abergel, A., Ade, P. A. R., et al. 2014, A&A, 571, A11 Polychroni, D., Schisano, E., Elia, D., et al. 2013, ApJ, 777, L33 Revéret, V., André, P., Le Pennec, J., et al. 2014, in Proc. SPIE, Vol. 9153, Mil- limeter, Submillimeter, and Far-Infrared Detectors and Instrumentation for Astronomy VII, 915305 Roussel, H. 2013, PASP, 125, 1126 Roussel, H. 2018, arXiv e-prints [arXiv:1803.04264] Roy, A., André, P., Palmeirim, P., et al. 2014, A&A, 562, A138 Roy, A., Martin, P. G., Polychroni, D., et al. 2013, ApJ, 763, 55 Sadavoy, S. I., Stutz, A. M., Schnee, S., et al. 2016, A&A, 588, A30 Salgado, F., Berné, O., Adams, J. D., et al. 2016, ApJ, 830, 118 Sault, R. J., Teuben, P. J., & Wright, M. C. H. 1995, in Astronomical Society of the Pacific Conference Series, Vol. 77, Astronomical Data Analysis Software and Systems IV, ed. R. A. Shaw, H. E. Payne, & J. J. E. Hayes, 433 Schisano, E., Molinari, S., Elia, D., et al. 2020, MNRAS, 492, 5420 Schuller, F., Csengeri, T., Urquhart, J. S., et al. 2017, A&A, 601, A124 Schuller, F., Menten, K. M., Contreras, Y., et al. 2009, A&A, 504, 415 Shimajiri, Y., Kawabe, R., Takakuwa, S., et al. 2011, PASJ, 63, 105 Shimajiri, Y., Takahashi, S., Takakuwa, S., Saito, M., & Kawabe, R. 2008, ApJ, 683, 255 Shirley, Y. L. 2015, PASP, 127, 299 Smith, R. J., Glover, S. C. O., & Klessen, R. S. 2014, MNRAS, 445, 2900 Sousbie, T. 2011, MNRAS, 414, 350 Stutz, A. M., Gonzalez-Lobos, V. I., & Gould, A. 2018, ArXiv e-prints [arXiv:1807.11496] Stutz, A. M. & Gould, A. 2016, A&A, 590, A2 Stutz, A. M., Tobin, J. J., Stanke, T., et al. 2013, ApJ, 767, 36 Suri, S., Sánchez-Monge, Á., Schilke, P., et al. 2019, A&A, 623, A142 Takahashi, S., Ho, P. T. P., Teixeira, P. S., Zapata, L. A., & Su, Y.-N. 2013, ApJ, 763, 57 Talvard, M., Revéret, V., Le-Pennec, Y., et al. 2018, in SPIE Conference Series, Vol. 10708, 1070838 Teixeira, P. S., Takahashi, S., Zapata, L. A., & Ho, P. T. P. 2016, A&A, 587, A47 Teng, Y.-H. & Hirano, N. 2020, ApJ, 893, 63 Zapata, L. A., Schmid-Burgk, J., Ho, P. T. P., Rodríguez, L. F., & Menten, K. M. 2009, ApJ, 704, L45 Article number, page 12 of 17
F. Schuller et al.: ArTéMiS mapping of the Integral-Shaped Filament in Orion A

Fig. A.1. Map of relative temperature difference, (T dalt − T dstd )/T dstd , be-   Fig. A.2. Map of relative difference in column density, (NHalt2 −NHstd2 )/NHstd2 ,
tween the alternative dust temperature T dalt , derived using the modified          between the alternative column density NHalt2 , derived using the modified
dust opacity law given by Eq. (3), and the standard dust temperature                dust opacity law given by Eq. (3), and the standard column density NHstd2 ,
T dstd , derived using the HGBS opacity law of Eq. (1). Contours are +5%,           derived using the HGBS opacity law of Eq. (1). Contours are −30%,
+20%, +35%.                                                                         −50%, −70%.

Appendix A: Results derived with a modified dust
  opacity law

In this section, we present results derived from the alternative
column density map, NHalt2 derived using the modified dust opac-
ity law given by Eq. (3) instead of a constant value for the dust
opacity as expressed in Eq. (1). We show maps of the relative
differences in the derived dust temperature and column density
in Figs. A.1 and A.2, respectively. We measured the inner widths
of the northern and southern parts of the main filament by fitting
Gaussian and Plummer-like profiles to the NHalt2 map, using the
same method as described in Sect. 3.3.

     The median radial intensity profiles computed for the ISF-
OMC-3, ISF-OMC-2 and ISF-OMC-1 are shown in Figs. A.3,
A.4 and A.5, respectively. The parameters of the best-fit mod-
els are reported in Table A.1, also including the results obtained
when splitting these filaments in small segments that can be as-
sociated with the fibers discussed by Hacar et al. (2018), as de-
tailed in Sect. 4.2 and in Table 1.
                                                                                                                                   Article number, page 13 of 17
A&A proofs: manuscript no. orion_artemis Fig. A.3. Median radial profiles for the northernmost part of the ISF (black solid curves) measured on the alternative column density map, on the eastern (left panel) and western (right panel) sides of the filament. The various lines have the same meanings as in Fig. 5. Fig. A.4. Same as Fig. A.3 for the portion of the main filament covering OMC-2. Fig. A.5. Same as Fig. A.3 for the southern part of the main filament (ISF-OMC-1). Article number, page 14 of 17
F. Schuller et al.: ArTéMiS mapping of the Integral-Shaped Filament in Orion A

Table A.1. Median inner widths of selected filaments, as derived from both Plummer and Gaussian fitting to the radial profiles measured in the
alternative column density map derived assuming the modified dust opacity law of Eq. (3).

 Filament             Dflat (pc)          p             FWHM (pc)       DPlummer
                                                                         HP      (pc)
 ISF-OMC-3
 West                 0.045±0.01          1.6±0.3       0.06±0.02       0.09±0.01
 East                 0.06±0.01           2.1±0.2       0.07±0.01       0.10±0.02
 ISF-OMC-2
 West                 0.04±0.02           1.5±0.3       0.065±0.02      0.10±0.03
 East                 0.075±0.02          2.0±0.2       0.08±0.02       0.13±0.02
 Fiber 41 (West)      0.05 ± 0.01         1.8±0.2       0.05±0.01       0.11±0.02
 Fiber 41 (East)      0.06 ± 0.02         1.7±0.3       0.05±0.02       0.10±0.02
 Fiber 44 (West)      –                   –             –               –
 Fiber 44 (East)      (0.07 ± 0.02)       (1.9±0.3)     0.06±0.03       0.12±0.03
 Fiber 43 (West)      (0.05 ± 0.02)       (1.8±0.3)     0.06±0.01       (0.09±0.03)
 Fiber 43 (East)      (0.05 ± 0.02)       (2.0±0.3)     (0.09±0.02)     (0.09±0.02)
 Fiber 37 (West)      (0.07 ± 0.03)       (2.0±0.5)     (0.07±0.02)     (0.12±0.04)
 Fiber 37 (East)      0.09 ± 0.03         2.3±0.3       0.14±0.03       0.15±0.03
 ISF-OMC-1
 West                 0.04±0.01           1.7±0.3       0.08±0.02       0.11±0.02
 East                 0.05±0.02           2.2±0.3       0.08±0.01       0.08±0.02
 Fiber 29 (West)      (0.05 ± 0.01)       (2.0±0.5)     0.05±0.01       (0.08±0.02)
 Fiber 29 (East)      (0.07 ± 0.02)       (2.1±0.3)     0.07±0.01       0.12±0.02
 Fiber 21 (West)      0.04 ± 0.02         1.8±0.2       0.05±0.01       0.10±0.02
 Fiber 21 (East)      (0.05 ± 0.02)       (2.0±0.5)     0.06±0.02       0.07±0.01
 Fiber 19 (West)      (0.09 ± 0.03)       (1.6±0.4)     0.08±0.02       0.16±0.04
 Fiber 19 (East)      (0.07 ± 0.02)       (2.0±0.3)     0.06±0.01       0.12±0.03
 Fiber 9 (West)       (0.04 ± 0.02)       (2.2±0.5)     0.06±0.01       0.07±0.02
Notes. Values shown in parentheses denote cases with higher uncertainties in the fitted values.

Appendix B: Influence of the filament-finding                              Appendix C: Influence of temperature variations
  algorithm                                                                  along the line of sight
To check whether the choice of the algorithm employed to trace             To evaluate the effect of temperature gradients along the line of
filament crests had any significant effect on our results, we              sight on our results, we constructed synthetic images for a model
used two alternative algorithms, FilFinder (Koch & Rosolowsky              filament with a Plummer-type density distribution (Eq. 4 with
2015) and getsf (Men’shchikov 2021), in addition to DisPerSE               p = 2) and a realistic temperature distribution assuming an ambi-
(Sousbie 2011) to define the spine of the ISF. Figure B.1 shows            ent interstellar radiation field (ISRF) typical of the Orion region
the results. Although getsf tends to break up filamentary struc-           (G0 = 1000)2 The cylindrical model filament was assumed to
tures into smaller pieces than the other two algorithms, it can be         have a central column density N0 = 2 × 1023 cm−2 on its crest,
seen that the three methods agree quite well in all three portions         an intrinsic half-power diameter DHP = 0.075 pc, and an outer
(OMC-1, 2, 3) of the ISF.                                                  diameter of 0.55 pc. It was also assumed to be embedded in a
    Moreover, the three distributions of individual widths mea-            background cloud of column density Nbg = 9 × 1021 cm−2 and,
sured along the whole ISF filament using the three sets of crests          for simplicity, to lie in the plane of sky. The properties of this
are very similar (see Fig. B.2). A Kolmogorov-Smirnov test con-            model filament are roughly similar to those derived for the ISF
firms that the distribution of widths found with the DisPerSE              (see Sect. 3 and Table 1). The synthetic dust temperature profile
crests (Fig. 8) is statistically indistinguishable from the other two      within the model filament was calculated for G0 = 1000 using
distributions (with p-values > 0.05).                                      an analytic approximation formula to a grid of radiative trans-
                                                                           fer models performed with the MODUST code (see Bouwman
                                                                           et al. 2001 and André et al. 2003). Two sets of synthetic emission
                                                                           maps for the model filament were generated at all observed Her-
                                                                           schel and ArTéMiS wavelengths, assuming optically thin dust
                                                                           emission with the nominal dust opacity law given by Eq. (1) on
                                                                           one hand (“B.1 test”) and the alternative dust opacity law given
                                                                           by Eq. (3) on the other hand (“B.2 test”). Column density and
                                                                           dust temperature maps were then produced from these synthetic
                                                                           emission maps in the same manner as for the real data by fitting a
                                                                            2
                                                                              The radiation field in the OMC-1 subregion is somewhat higher than
                                                                           the value adopted in the model described here. Accordingly, the internal
                                                                           dust temperature gradient within the OMC-1 portion of the ISF and the
                                                                           corresponding effects on the OMC-1 column density profiles may be
                                                                           somewhat stronger than shown in Figs. C.1 & C.2.

                                                                                                                    Article number, page 15 of 17
You can also read