Flame interactions in a stratified swirl burner: flame stabilization, combustion instabilities and beating oscillations
←
→
Page content transcription
If your browser does not render page correctly, please read the page content below
Flame interactions in a stratified swirl burner: flame
                                                    stabilization, combustion instabilities and beating
                                                                        oscillations
arXiv:2103.01001v1 [physics.flu-dyn] 1 Mar 2021

                                                    Xiao Hana , Davide Laerab , Dong Yangb , Chi Zhanga,∗, Jianchen Wanga ,
                                                         Xin Huia , Yuzhen Lina , Aimee S. Morgansb , Chih-Jen Sungc
                                                             a
                                                             National Key Laboratory of Science and Technology on Aero-Engine
                                                      Aero-thermodynamics, Co-innovation Center for Advanced Aero-Engine, School of
                                                      Energy and Power Engineering, Beihang University, Beijing, 100083, P. R. China
                                                   b
                                                     Department of Mechanical Engineering, Imperial College London, London SW7 2AZ,
                                                                                            UK
                                                   c
                                                     Department of Mechanical Engineering, University of Connecticut, Storrs, CT 06269,
                                                                                           USA

                                                  Abstract
                                                      The present article investigates the interactions between the pilot and
                                                  main flames in a novel stratified swirl burner using both experimental and nu-
                                                  merical methods. Experiments are conducted in a test rig operating at atmo-
                                                  spheric conditions. The system is equipped with the BASIS (Beihang Axial
                                                  Swirler Independently-Stratified) burner fuelled with premixed methane-air
                                                  mixtures. To illustrate the interactions between the pilot and main flames,
                                                  three operating modes are studied, where the burner works with: (i) only
                                                  the pilot flame, (ii) only the main flame, and (iii) the stratified flame (with
                                                  both the pilot and main flames). We found that: (1) In the pilot flame
                                                  mode, the flame changes from V-shape to M-shape when the main stage is
                                                  switched from closed to supplying a pure air stream. Strong oscillations in
                                                  the M-shape flame are found due to the dilution of the main air to the pi-
                                                  lot methane flame. (2) In the main flame mode, the main flame is lifted
                                                  off from the burner if the pilot stage is supplied with air. The temperature
                                                  of the primary recirculation zone drops substantially and the unsteady heat
                                                  release is intensified. (3) In the stratified flame mode, unique beating oscil-
                                                  lations exhibiting dual closely-spaced frequencies in the pressure spectrum

                                                    ∗
                                                        Corresponding author: zhangchi@buaa.edu.cn

                                                  Preprint submitted to Combustion and Flame                              March 2, 2021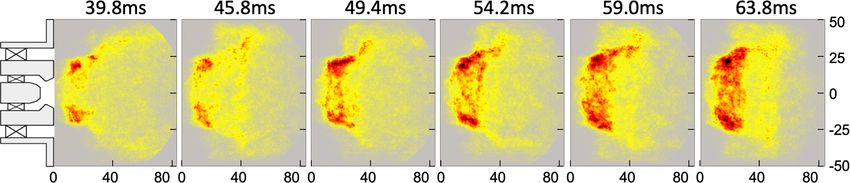
is found. This is observed within over narrow window of equivalence ratio
combinations between the pilot and main stages. Detailed analysis of the
experimental data shows that flame dynamics and thermoacoustic couplings
at these two frequencies are similar to those of the unstable pilot flame and
the attached main flame cases, respectively. Large Eddy Simulations (LESs)
are carried out with OpenFOAM to understand the mechanisms of the time-
averaged flame shapes in different operating modes. Finally, a simple acoustic
analysis is proposed to understand the acoustic mode nature of the beating
oscillations.
Keywords:
Swirl flame, Stratified flame, Flame interaction, Combustion instabilities,
Beating, Large Eddy Simulation,

1. Introduction
    Lean premixed prevaporized (LPP) combustors are widely used to reduce
NOx emissions of modern aero-engine and land-based gas turbines. These
combustors face combustion instability challenges coming from a resonant
coupling between acoustic modes and unsteady heat release rate (HRR) [1].
To broaden the stable operating range, LPP combustors are often designed
as a centrally-staged structure where a pilot flame is surrounded by a main
flame. These two flames are often operated with different mass flow rates
(ṁa ) and equivalence ratios (φ) [2], leading to a local equivalence ratio dif-
ference when they interact with each other. This mixture inhomogeneity
forms a so-called stratified flame that has attracted many studies [3, 4]. Usu-
ally, a richer and stable pilot flame is preferable to stabilise a leaner main
flame and thus reduce emissions [5]. These two flames are usually separated
by a lip structure, as sketched in Fig. 1(a), to delicately adjust the mixing
and merging of the two streams – this has a direct impact on the entire flow
field and equivalence ratio distribution and has been shown to play a key role
in NOx reduction [6].
    There are some recent studies on structures and dynamics of stratified
swirl flames in centrally-staged combustors. For example, in a non-separated
stratified swirl burner, Chong et al. [7] observed that with a larger mass flow
rate in the pilot stream, the flame has a longer and stronger reaction zone.
Kim and Hochgreb [8] found that the split of equivalence ratios between the
two stages plays a key role in determining the flame shape and the flame

                                       2
dynamics. The flame response of the above stratified flames and the spatial
distribution of heat release were then measured experimentally by Han et
al. [9, 10]. In a staged dual swirl burner with liquid fuel, Renaud et al. [11]
observed bistable behaviour and flame shape transition, which can be trig-
gered by acoustic perturbation. The above two burners do not feature a
separation structure, therefore the pilot and main flames often blend with
each other. Using industrial LPP combustors, self-excited limit cycle oscilla-
tion operated at elevated-pressure conditions was measured and analyzed by
Temme et al. [12]. Li et al. [6] found that the equivalence ratios affect the
combustion efficiency and emissions significantly in a high-pressure configu-
ration. But both combustors in Refs [6, 12] feature complicated geometries
and were not shown in detail. Recently, a simplified stratified burner was
developed by the authors’ group [13] to elucidate the role of the pilot flame
in anchoring the main flame experimentally.
    From these studies, it has been shown that interactions between the pilot
and the main flames play an important role in the dynamics of stratified
swirl flames. However, to the best knowledge of the authors, none of the pre-
vious works on combustion instabilities in centrally-staged combustors have
studied the characteristics of each of these two swirl flames and their inter-
actions in detail. Chen et al. [14] performed Large Eddy Simulations (LESs)
in a dual-swirl burner without fuel-staging, finding that, due to their acous-
tic impedance difference, the velocity perturbations at the two air passages
are different during self-excited oscillations, leading to the flapping of the
fuel jets and radial equivalence ratio fluctuations. Recently, Kim et at. [15]
reported interesting beating oscillations in a stratified swirl burner without
lip structures, with a slight difference in oscillating frequencies between the
pilot and the main flames. This beating phenomenon may shed light on how
flame interactions between the pilot and the main stages could affect com-
bustion instabilities in centrally-staged combustors. However, no detailed
measurements and analysis were provided and thus physical insights of the
flame dynamics and flame-acoustic interaction mechanisms are still missing.
    Even in simple configurations, such as a Rijke tube or a single swirler
burner, many complex nonlinear behaviours have been widely observed, e.g.
see Refs. [16–19]. A recent comprehensive review can be found in [20]. Among
these cases, beating comes in as an oscillation phenomenon characterised by
a moduled periodic pressure fluctuation with a low-frequency envelope in its
amplitude. Mathematically, it comes from the linear superposition of two

                                      3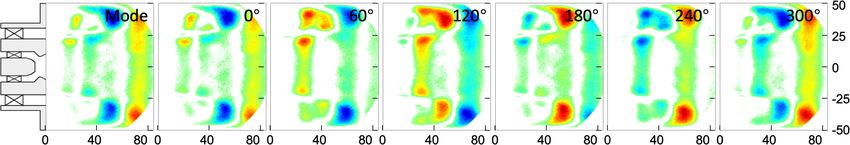
periodic signals with close frequencies and similar amplitudes:
                P = A1 cos(2πf1 + ψ1 ) + A2 cos(2πf2 + ψ2 ),               (1)
where A, f , and ψ are the amplitude, frequency, and phase shift of each
signal, with the frequency of the wave package being the difference between
f1 and f2 . Choi et al. [21] measured the flame structure during the beating
oscillations of a premixed swirl flame and found that the flame is highly dis-
torted near the medium perturbation amplitude. Beating oscillations were
also found by Kabiraj and Sujith [17] with the elongation and pinch-off of a
laminar premixed conical flame. Weng et al. [22] investigated beating oscil-
lations in a Rijke burner, showing that flame heat loss can play an important
role in the low-frequency flame pulsation. Moon et al. [23] observed beat-
ing oscillations in adjacent model combustors with cross-talk area. However,
these beating phenomena come from either nonlinear behaviours of a single
flame or cross-talk between different burners. The effect of flame interac-
tions between the pilot and main stages on affecting the beating phenomena
in centrally-staged combustors is relevant to many modern gas turbine ap-
plications but remains unclear.
    In the present study, we aim to investigate the effect of pilot-main flame
interactions on flame stabilization, flame shape, flame dynamics and acoustic-
flame interactions during self-excited combustion instabilities within a strat-
ified swirl burner. Three operating modes are studied: pilot flame mode
(fuel comes from only the pilot stage), main flame mode (fuel comes from
only the main stage), and stratified flame mode (fuel comes from both the
pilot and main stages). Both experiments and LES are performed. The
paper is organized as follows: the experimental and numerical setups are
introduced first, each flame mode is then studied in detail – including their
time-averaged flame shapes, LES results, pressure fluctuations, flame dy-
namics and acoustic-flame couplings, and a simplified acoustic analysis is
proposed at last to qualitatively illustrate the mechanism of the observed
beating oscillations.

2. Experimental and numerical setup
2.1. Experimental setup
    In the present work, a novel burner (BASIS) designed at Beihang Uni-
versity [13, 24] is used to study the aero-thermodynamic behaviour and com-
bustion instabilities of LPP combustors. Its detailed geometry is sketched in

                                      4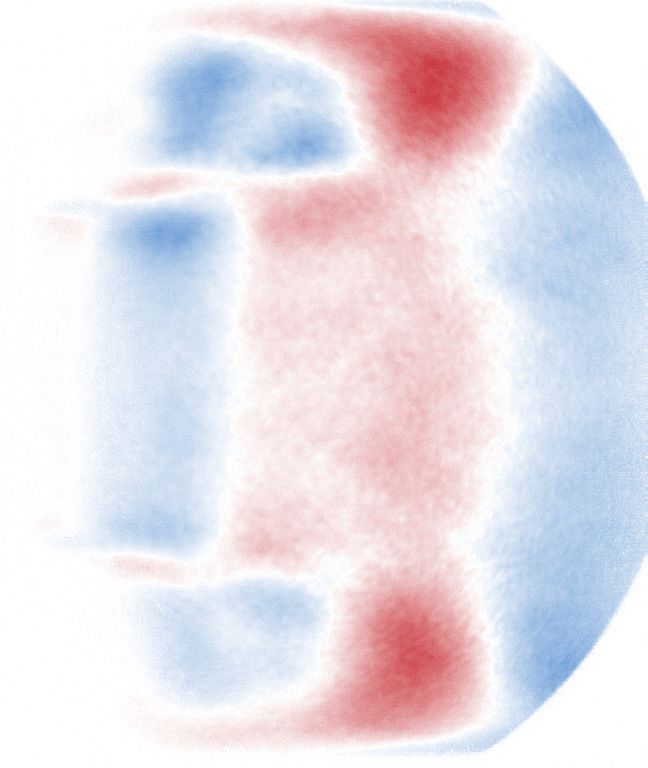
(a)

                                          (b)

Figure 1: (a) A schematic view of the BASIS burner. CSL stands for the central shear
layer originating from the pilot stage, while ISL and OSL stand for the inner and outer
shear layer of the main stage, respectively. (b) A schematic view of the test rig (not to
scale) [13]. All dimensions are in millimetre.

                                           5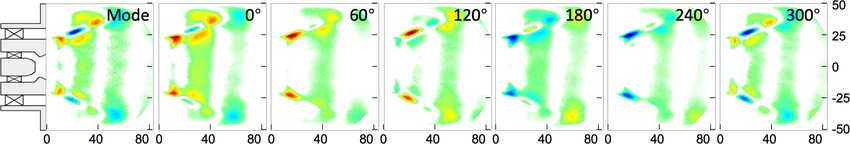
Fig. 1(a). Two co-axial co-rotation axial swirlers are used – one for the pilot
stage and the other for the main stage, with swirl numbers 0.68 and 0.50,
respectively.
     Figure 1(b) shows the setup of the test rig. The burner is operated at
atmospheric pressure with fully premixed methane-air mixtures. The burner
is connected to a quartz tube of 100 mm in diameter. Two quartz tubes with
different lengths are chosen. The shorter one has a length of 200 mm and is
employed only to measure the time-averaged flame shape, without triggering
combustion instabilities. The longer tube has a length of 800 mm and is used
to investigate combustion instabilities.
     During the experiments, the mass flow rates of air are monitored by stan-
dard orifice flowmeters (accuracy of 2 %), while those for the methane are
regulated by two Mass Flow Controllers (Sevenstar, CS200) (accuracy of 1
%). A high-speed camera (Photron, Fastcam SA4) equipped with an inten-
sifier is used to record the flame dynamics. The view window is set as 648
× 768 pixels, corresponding to an actual dimension of 84 mm × 100 mm.
3882 snapshots are obtained for each case with a sampling rate of 5000 fps. A
digital single-lens reflex (DSLR) camera is used to capture the time-averaged
flame shape with an aperture of f/10, exposure time of 1/2 s, and ISO value
of 640. The global CH∗ chemiluminescence (I 0 ) is measured by a photomul-
tiplier (PMT) (Hamamatsu, H9306) as a representative of HRR [8]. CH∗
filters (430±5 nm) are equipped to the above three optical instruments. Five
pressure sensors (PCB, 112A22) are mounted along with the test rig to mea-
sure the pressure fluctuation P 0 , as shown in Fig. 1(b). Note that S1 and S2
are flush mounted to the main channel, while S3-S5 are recess mounted with
semi-infinite tubes due to high temperature. All the above data are synchro-
nised and collected by a DAQ system (National Instruments, NI9215). In
each case, signals of I 0 and P 0 are recorded at a sampling frequency of 20
kHz for 5 seconds.
     The test conditions are chosen as follows: the air mass flow rates for the
pilot and main stages are kept at 2.2 g/s and 17.8 g/s, respectively. This
results in an air split ratio of about 1:8, being consistent with the typical
split in LPP combustors. The mean axial velocities of in the pilot and main
channels are about 6.5 m/s and 11 m/s, resulting in Reynolds numbers of
approximate 4000 and 12000, respectively.
     Five cases are chosen to study interactions between the pilot and main
stages, as listed in Table 1. The capital letters P and M stand for the pilot
and main stages, respectively, while the subscripts f , a and c denote supplied

                                      6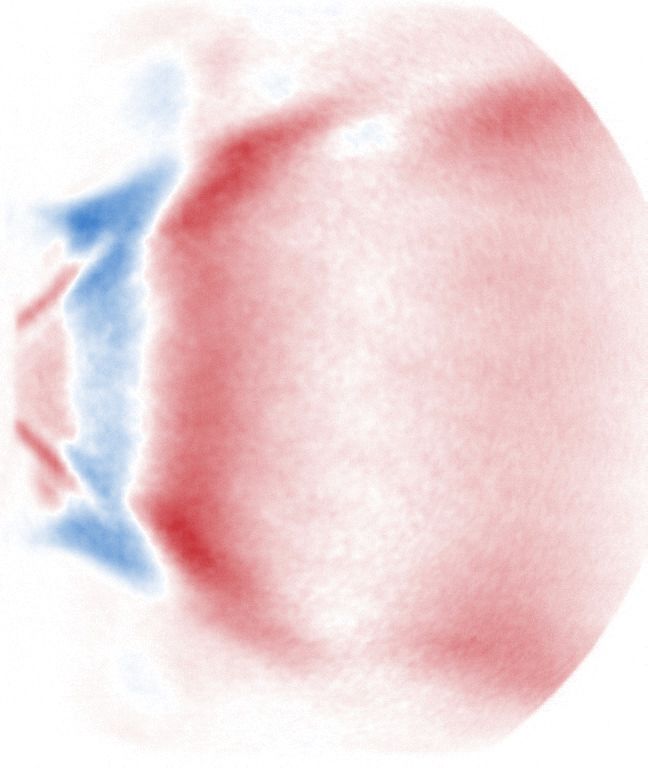
Table 1: Operating conditions of the current testing.

                                              ṁap     ṁam                   P
 Case            Operating mode                    φp         φm φtotal
                                             (g/s)     (g/s)                (kW)
 Pf Mc      Pilot flame + Main closed         2.2 0.85   0     0  0.85        6.1
 Pf Ma       Pilot flame + Main air           2.2 0.85 17.8    0  0.09        6.1
 Pc Mf      Pilot closed + Main flame          0    0   17.8 0.63 0.63       36.4
 Pa Mf       Pilot air + Main flame           2.2   0   17.8 0.63 0.56       36.4
 Pf Mf      Pilot flame + Main flame          2.2 0.85 17.8 0.63 0.65        42.5

with fuel, supplied with air and stage closed, respectively. Cases Pf Mc and
Pf Ma are operated with the pilot flame where the fuel is provided only in
the pilot stage (in the form of the premixed mixture). The difference is that
Pf Mc works with only the pilot stream (the main stage is closed), while in
Pf Ma the main stage is open but supplies only air rather than a fuel-air
mixture. Cases Pc Mf and Pa Mf follow the same rules except that the fuel is
now provided only in the main stage. Case Pf Mf is the stratified flame case,
i.e., fuels are provided in both the pilot and main stages.

2.2. Numerical methods
    To investigate the time-averaged flow fields and reveal the flame stabiliza-
tion mechanisms of different cases, LES using OpenFOAM1 [25] is performed
with the incompressible solver ReactingFoam. With the approximation that
density is only a function of the temperature, an incompressible solver can
capture the time-averaged flame shapes and flow fields, as validated previ-
ously [24, 26, 27]. The WALE sub-grid model [28] is applied to close the
Favre-filtered reactive flow conservation equations. The partially-stirred re-
actor (PaSR) combustion model [29] is used to model the filtered chemical
reaction rates based on a global four-step methane-air reaction mechanism
with six intermediate species [30]. The computational domain begins 55 mm
upstream of the dump plane (11 mm upstream of the outer swirler) and ends
200 mm downstream, and is discretised using a 10-million-elements struc-
tured mesh. The near-wall cells in the flame tube are locally refined to meet

  1
      https://openfoam.org

                                            7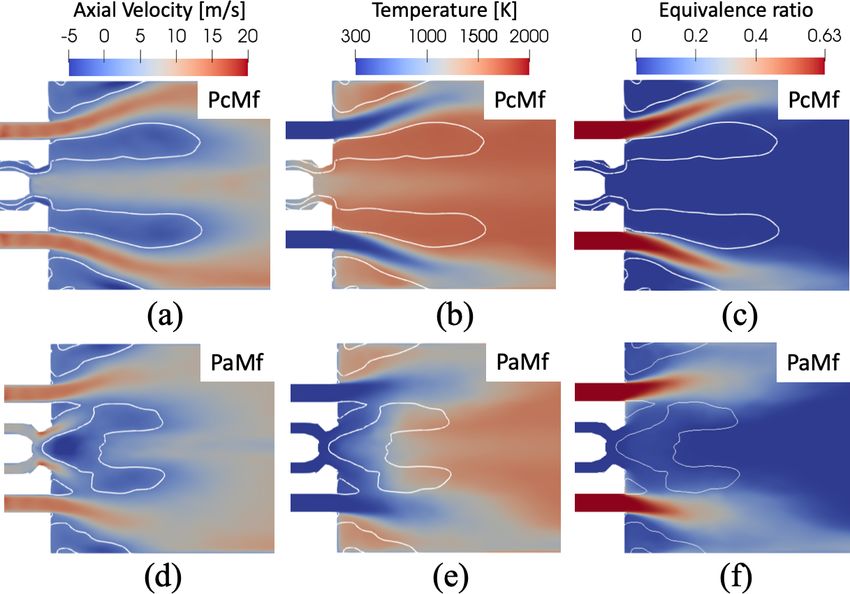
the y+
LES HRR (right). It is found that Case Pf Mc (Fig. 2(a-b)) features a V-
shape flame with thin flame sheets, and the flame anchors only at the centre
body of the pilot stage. On the contrary, Case Pf Ma (Fig. 2(c-d)) sees a
more-expanded M-shape flame with two stagnation points, one at the centre
body and the other at the lip structure. The flame sheets of Case Pf Ma are
thicker, indicating that the shear layer is more turbulent than Pf Mc .

Figure 2: Time-averaged flame shapes captured by the DSLR camera (a, c) and LES HRR
(b, d) for Cases Pf Mc and Pf Ma .

Figure 3: Time-averaged LES results for Cases Pf Mc and Pf Ma . The distributions of
axial velocity (a, d), temperature (b, e), and equivalence ratio (c, f) are shown respectively.
White lines mark the zero contour of axial velocity.

  An explanation for the above differences is provided by analysing the
LES results shown in Fig. 3. In Case Pf Mc , the pilot flow is not subject to

                                              9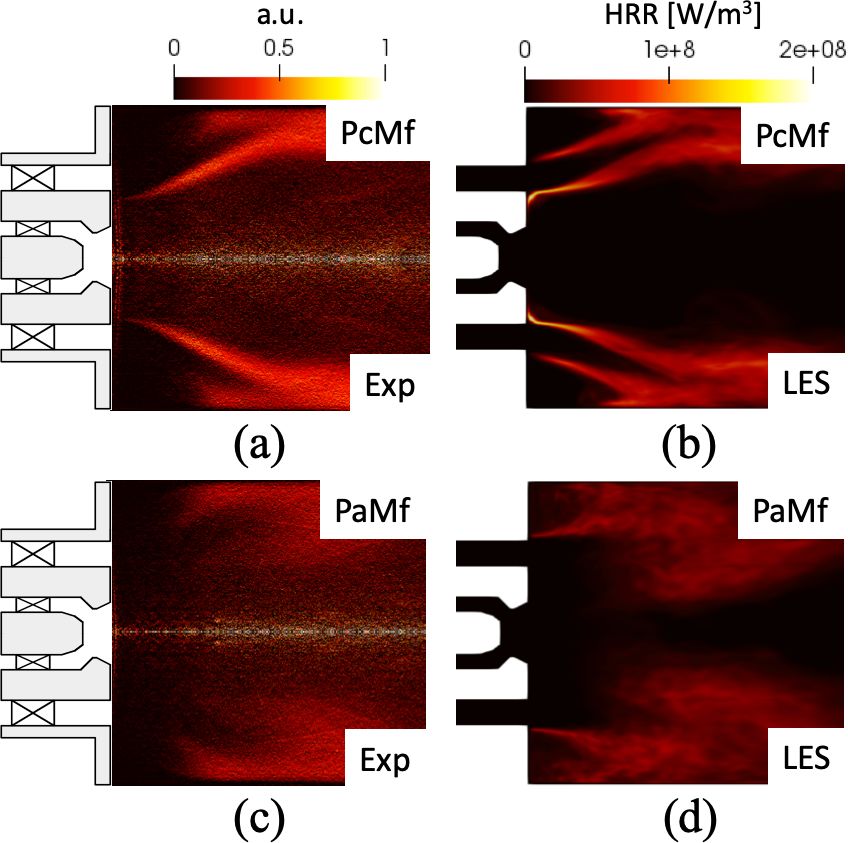
interference as the main stage is closed. Indeed, it forms a nearly straight
jet (Fig. 3(a)) with the jet/flame angle dominated by the diverging angle
of the pilot stage (52◦ in Fig. 1(a)) and swirl effect. The equivalence ratio
distribution in Fig. 3(c) exhibits a concentration along the jet, confirming
the above findings. Contrarily, in Case Pf Ma the main stage is supplied with
an air stream at 11 m/s. This introduces a stronger shear effect, and forces
the pilot stream to expand more and eventually merge with the main jet, as
shown in Fig. 3(d). Therefore, methane from the pilot stage enters the lip
recirculation zone (LRZ) and is then diluted by the main stream, as marked
by the white arrows in Fig. 3(f), leading to the formation of the observed
thicker M-shape flame. The temperature maps in the two cases are also quite
different. In Case Pf Mc (Fig. 3(b)), hot gasses occupy the entire flame tube,
leading to a higher mean combustion chamber temperature than Case Pf Ma
(Fig. 3(e)).
    The pressures recorded by sensor S3 are used to study the system ther-
moacoustic behaviours. The comparison of Cases Pf Mc and Pf Ma is shown
in Fig. 4. Time-series of pressure fluctuation P 0 and flame intensity fluctua-
tion I 0 (from PMT) are plotted together on the top. The spectra are obtained
with the Fast Fourier Transform (FFT) method, while the phase space recon-
structions follow the method stated in [34]. Case Pf Mc is thermoacoustically
stable, as the pressure fluctuation signal shown in Fig. 4(a) sees a flat spec-
trum and a chaotic phase trajectory. Contrarily, a strong periodic oscillation
is found in Case Pf Ma (Fig. 4(b)) where I 0 is almost synchronous with P 0 ,
resulting in a high single peak in the spectrum at 159 Hz with amplitude
over 1000 Pa. The analysis of the frequency will be shown in Section 3.4.
    The sequential flame images within one cycle are shown in Fig. 4(c).
Starting from a tiny kernel at 20.8 ms, the flame grows to a trapezoidal
shape (21.8 ms). Then it reaches its largest size (with the highest flame
intensity) at 22.8 ms where a curly flame tip is noticeable – this is most
probably caused by the vortex roll-up [35]. After that, the flame shrinks
back to the exit of the pilot stage, becomes almost invisible at 24.8-25.8 ms
and appears again in the next cycle as what happens at 20.8 ms. Overall, the
flame features a periodic expansion and contraction in fluctuations of both
flame area and heat release intensity, but without significant convective effect
in space. To differentiate this from convective motions in later cases, we call
it “bulk oscillation”. This bulk oscillation behaviour is often experienced in
partially premixed [36, 37] and spray [12, 34] flames. It is driven by both
velocity and equivalence ratio fluctuations, resulting in both flame area and

                                      10
2000 2000
P [Pa] P [Pa]
1000 I [a.u.] 1000 I [a.u.]
0 0
-1000 -1000
-2000 -2000
0.01 0.015 0.02 0.025 0.03 0.035 0.04 0.045 0.05 0.01 0.015 0.02 0.025 0.03 0.035 0.04 0.045 0.05
1500 1500
2000 2000
1000 0 1000 0
-2000 -2000
500 -2000 500 -2000
0 -2000 0 -2000
0 0 0 0
0 250 500 2000 2000 0 250 500 2000 2000
(a) (b)
(c)
Figure 4: Pressure fluctuations and flame dynamics of the pilot flame mode. Comparison
of pressure fluctuations of S3 sensor for Cases Pf Mc (a) and Pf Ma (b). The time-series
is shown on the top, while the spectra and the phase space trajectories are shown in
the bottom left and right, respectively. (c) Sequential flame images of Case Pf Ma with
corresponding locations in the time signal shown in (b) by red dots.
11heat release intensity modulations. However, for a premixed flame, as its
equivalence ratio is fixed, flame area modulations, such as surface wrinkling
or vortex roll-up, dominate the flame dynamics when it is exposed to velocity
fluctuations [18, 36, 38]. In the present configuration, as shown in Fig. 3, the
mixture from the pilot stream is diluted by the main stream, leading to very
lean combustion (closer to the lean blowout limit) which is susceptible to
instability [39]. Furthermore, with the main stage air, the premixed pilot
stream is turned into a partially premixed combustion regime, where the
unsteady mixing between the two streams intensifies the perturbation of the
equivalence ratio.
(a)
50
4
3
Radial distance [mm]
25 2
1
0 0
-1
-2
-25
-3
-4
-50
0 20 40 60 80
Axial distance [mm]
(b)
Figure 5: DMD modes (a) and local Rayleigh index map (b) for Case Pf Ma .
More insights of flame dynamics are given via a Dynamic Mode Decompo-
sition (DMD) [40] of the flame images, which extracts the coherent structures
during the oscillations. In Fig. 5(a), the DMD mode is plotted at the very
left, with the phase sequences on its right. This result also confirms the bulk
motion of Case Pf Ma flame, as the axial location of the mode is almost fixed
and features only area changes.
A more quantitative analysis of the thermoacoustic coupling can be illus-
trated by the local Rayleigh index map. This index map can be calculated
12by Rlocal = τ −1 τ P 0 · ICH
0
R
∗ dt for each pixel of the measured domain [12],
0
where τ is the chosen processing period, ICH ∗ represents the HRR fluctua-
tion, using the CH∗ chemiluminescence recorded by the high-speed camera.
For each case, a period of 60 cycles is chosen so τ ≈ 0.38 s. According to the
Rayleigh criterion [41], a positive (negative) value stands for a constructive
(destructive) effect driving (damping) the thermoacoustic instabilities. The
Rayleigh index map of Case Pf Ma is shown in Fig. 5(b) where the whole
flame is positive, indicating that the flame heat release perturbation in the
whole region is positively coupled with P 0 . The dynamics of Pf Ma flame does
not see noticeable phase shift in space. This is in consistency with the bulk
motion observed in Fig. 4(c) and 5(a), that the pilot flame features global
expansion-contraction without obvious convection in space, which is similar
to that of a partially premixed flame [36, 37].
3.2. Main flame mode
Figure 6: Time-averaged flame shapes captured by the DSLR camera (a, c) and LES HRR
(b, d) for Cases Pc Mf and Pa Mf , respectively.
The comparison between the experimental and numerical time-averaged
flame shapes for Cases Pc Mf and Pa Mf is shown in Fig. 6. In Case Pc Mf
(Fig. 6(a)), a V-shape flame attached only to the edge of the main stage
is captured by the DSLR camera. This flame expands at a 50◦ angle ap-
proximately, then impinges on the side wall. One can notice that the LES
captures the main experimental flame shape in Fig. 6(b), with a mismatch
at the OSL most probably due to an underestimated heat loss from the wall.
13The flame in Case Pa Mf is instead lifted far from the burner, as shown in
Fig. 6(c). This lift-off phenomena is well reproduced by LES (Fig. 6(d)).
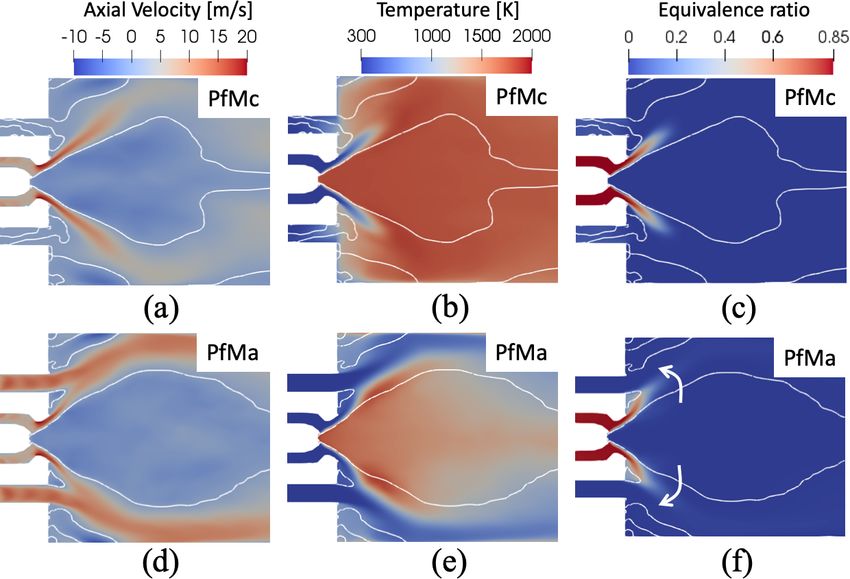
Figure 7: Time-averaged LES results for Cases Pc Mf and Pa Mf . The distributions of
axial velocity (a, d), temperature (b, e), and equivalence ratio (c, f) are shown respectively.
White lines mark the zero contour of axial velocity.
More insights on these two cases are provided by the numerical analysis
in Fig. 7. The time-averaged axial velocity distribution (Fig. 7(a)) sees a pair
of primary recirculation zones (PRZs) resembling a “double kidney” shape.
This is because as the pilot stage is closed, the recirculation zones are widely
separated. A pair of corner recirculation zones (CRZs) are also found. Due to
the recirculation of hot reaction products, both the PRZs and CRZs remain
high temperature as shown in Fig. 7(b), enabling the stabilisation of the V-
shape flame. The flame in Case Pa Mf is instead lifted-off and tackles the side
wall. In this configuration, the pilot is supplied with pure air leading to a
different PRZ structure (Fig. 7(d)) with a horseshoe shape. Due to the cold
stream from the pilot stage, the temperature in the PRZ is low, as shown in
Fig. 7(e). This low-temperature PRZ prevents combustion and pushes the
flame downstream, resulting in a lifted flame as shown in Fig. 6(c).
The pressure spectra for Cases Pc Mf and Pa Mf of S3 sensor are shown
in Fig. 8(a, b). Both cases are unstable with oscillations at almost the same
frequency, i.e., 222 Hz for Pc Mf and 224 Hz for Pa Mf . However, the peak
amplitude in the spectrum of Case Pa Mf is about 400 Pa. This agrees with
what is shown in the time series plots. The phase difference between P 0 and
I 0 in Case Pa Mf (Fig. 8(b)) is about 38◦ . In this configuration the Rayleigh
141000 1000
P [Pa] P [Pa]
500 I [a.u.] 500 I [a.u.]
0 0
-500 -500
-1000 -1000
0 0.005 0.01 0.015 0.02 0.025 0.03 0 0.005 0.01 0.015 0.02 0.025 0.03
500 500
1000 1000
400 400
300 0 300 0
200 -1000 200 -1000
-1000 -1000
100 100
0 -1000 0 -1000
0 0 0 0
0 250 500 1000 1000 0 250 500 1000 1000
(a) (b)
(c)
(d)
Figure 8: Pressure fluctuations and flame dynamics of the main flame mode. Comparison
of pressure fluctuations of the S3 sensor for Cases Pc Mf (a) and Pa Mf (b). The time-
series are shown at the top, while the spectra and the phase space trajectories shown at
the bottom left and right, respectively. Sequential flame images of Cases Pc Mf are shown
in (c) and Pa Mf in (d) (marked as red dots in the time-series plots).
15criterion [41] is satisfied and the coupling between P 0 and I 0 is enhanced.
Contrarily, in Fig. 8(a), the phase-shift between P 0 and I 0 is larger, thereby
obstructing the amplification of the oscillations.
The sequential flame images of Cases Pc Mf and Pa Mf are shown in
Fig. 8(c, d). Note that the flame in Case Pc Mf is slightly lifted off from
the burner and the flame surface is distorted subject to acoustic perturba-
tions. It is also seen that the flame intensity in Fig. 8(c) does not vary much
compared to Fig. 8(d). For Case Pa Mf , the flame is lifted off, so the flame
surface is more distributed and no clear edge can be seen in Fig. 8(d). How-
ever, fluctuation of flame intensity can still be identified in the lift-off region
as marked by double-end arrows. This will be more clearly seen from the
DMD results in Fig. 9(b).
(a)
(b)
50 0.3 50 0.8
0.6
0.2
Radial distance [mm]
Radial distance [mm]
25 25 0.4
0.1
0.2
0 0 0 0
-0.2
-0.1
-25 -25 -0.4
-0.2
-0.6
-50 -0.3 -50 -0.8
0 20 40 60 80 0 20 40 60 80
Axial distance [mm] Axial distance [mm]
(c) (d)
Figure 9: DMD modes (a, b) and local Rayleigh index maps (c, d) for Cases Pc Mf and
Pa Mf , respectively.
16The DMD mode of Case Pc Mf is shown in Fig.9(a). Contrary to Case
Pf Ma , the convective motion of flame dynamics is clearly seen in the phase
sequences. The coherent structure of flame moves downstream step by step.
Note that no air is supplied to the pilot stage in Case Pc Mf , therefore the
methane in the main stage is not diluted and is kept fully premixed. As for
Case Pa Mf , DMD modes in Fig. 9(b) do not exhibit convective motion but
feature alternative red-blue bulk oscillation in the lift-off region.
The Rayleigh index maps of Cases Pc Mf and Pa Mf are shown in Fig. 9(c,
d). As the driving is much stronger than damping, their respective locations
with respect to the flame motion could be more interesting. In Fig. 9(c), the
damping zone (blue) is found in the upstream of the flame, corresponding to
the CRZ and PRZ, while the driving zone (red) concentrates in the flame-
wall-interaction region. This flame-wall-interaction was found in this rig
before and discussed in [13]. For Case Pa Mf , as the flame is lifted off, the
main driving zone is located in the lift-off region while the convective delay
gives a damping zone further downstream near the side wall. In this case,
the flame is lifted with high turbulence and can only stabilise along the side
wall.
3.3. Stratified flame mode
In Case Pf Mf , premixed fuel-air mixtures are injected from both the
pilot and main stages with different equivalence ratios to give a stratified
swirl flame, similar to that widely used in LPP combustors. The measured
time-averaged flame image is shown in Fig. 10(a). The pilot flame is anchored
inside the pilot stage and develops along the CSL while the main flame is
anchored at the exit of the main stage along the ISL. The two flame sheets
merge downstream and then impinge towards the side wall. The overall flame
shape is well captured by LES reported in Fig. 10(b), with some mismatch
at the root of the main flame.
With respect to Case Pa Mf (Fig. 7(d)), a more extended horseshoe shape
PRZ is revealed by LES for this case (Fig. 11(a)). As the pilot stage is sup-
plied with the methane-air mixture, the PRZ is now full of high-temperature
gases, providing a suitable condition for flame stabilization. The merging
and mixing of the pilot and main streams can also be seen in Fig. 11(a),
leading to an equivalence ratio gradient at the merging region as shown in
Fig. 11(c). As expected, the PRZ is filled with high temperature gas, which
helps the stabilization of the stratified flame (Fig. 11(b)).
17Figure 10: Time-averaged flame shapes captured by the DSLR camera (a) and LES HRR
(b) for Case Pf Mf .
Figure 11: Time-averaged LES results for Case Pf Mf . The distributions of axial velocity
(a), temperature (b), and equivalence ratio (c) are shown respectively. White lines mark
the zero contour of axial velocity.
181000
P [Pa]
500 I [a.u.]
0
-500
-1000
0 0.02 0.04 0.06 0.08 0.1 0.12
150 1000
1000 500
100
0 0
50
-500
-1000 -1000
-1000 0
0 0 -1000
0 250 500 1000 1000 -1000 0 1000
(a)
(b)
(c)
Figure 12: Beating oscillations found in Case Pf Mf . (a) The fluctuations of pressure and
flame intensity. Time-series plot is shown on the top, while the spectrum (left), the phase
space trajectory (middle), and the Poincaré map (right) are shown in the bottom. (b)
Sequential flame images along the envelope line (marked as red dots). (c) Sequential flame
images during one period (marked as the blue arrow).
19Compared to previous cases, the present stratified flame case sees a very
different combustion instability oscillation. Figure 12(a) reports the recorded
pressure oscillations in which P 0 is seen to be periodic but shows a low-
frequency envelope in its oscillation amplitude. In the spectrum, this corre-
sponds to the presence of two peaks with close frequency: the first peak is
198 Hz and has an amplitude of 145 Pa, and the second is 223 Hz with a
similar amplitude.
In a dynamic system, this is usually referred to as “beating” [15, 22]. As
shown in Eq. 1, it includes two sinusoidal signals with close frequencies. In
the current case, f1 = 198 Hz, f2 = 223 Hz, and f1−2 =25 Hz – this frequency
difference being consistent with the frequency of the signal envelope shown in
Fig. 12. In the time domain signal, the heat release perturbation, I 0 , slightly
lags the pressure perturbation, P 0 , and also exhibits beating oscillations.
Phase space reconstruction shows that the oscillation is not a limit cycle.
The Poincaré map is also plotted on the right side, which is the intersection
of the phase space trajectory with a certain lower-dimensional subspace and
is widely used in nonlinear time series analyses [42]. In a Poincaré map, a
pure sinusoidal signal is projected onto a discrete point, while a quasi-periodic
signal into a closed ring. In the observed beating oscillations, the Poincaré
points are scattering along a ring, indicating the signal is a quasi-periodic
oscillation accompanied with strong noise [43].
To evaluate the strength of beating oscillations, a beating index, B, is
defined as follow:
|A1 | × |A2 |
B= , (2)
max(|A1 |, |A2 |)2
where A1 and A2 are Fourier amplitudes of the two sinusoidal signals. The
results in Fig. 12 were obtained by considering equivalence ratios φp =0.85
and φm =0.63. Extra experiments with different φp and φm have also been
conducted. The beating index results for these different cases are summarised
in Table 3. One can see that beating oscillations are only found over a narrow
window of operating conditions and the beating index reaches its maximum
at φp =0.85 and φm =0.63. This indicates that beating oscillations are highly
sensitive to the equivalence ratio variations. Note that when the main and
pilot flames are independently operated (see Case Pf Ma in which φp =0.85 is
studied and Case Pa Mf in which φm =0.63 is studied), intense thermoacoustic
instabilities have been observed. This indicates that beating oscillations in
Case Pf Mf may originate from the interactions between the pilot and main
flame dynamics. The frequencies of the beating cases in Table 3 are shown
20in Table A in Supplemental Material.
Table 3: Dependence of beating index on equivalence ratios of the pilot and main flames.
φm
0.58 0.61 0.63 0.65
φp
0.48 0 0 0 0.27
0.67 0.08 0.12 0.16 0.17
0.85 0 0.27 0.86 0.79
1.04 0 0 0 0
1.22 0 0 0 0
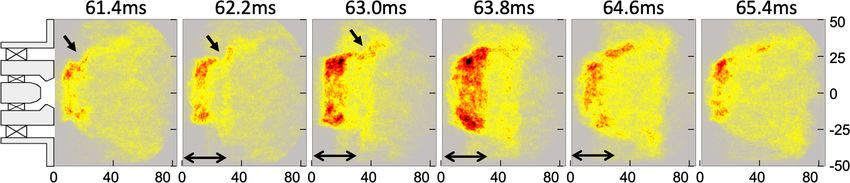
We now study Case Pf Mf in more detail. Two sequences of flame images
are shown in Fig. 12(b, c). The first is chosen along the beating envelope
from 39.8 ms to 63.8 ms, as shown by red dots in Fig. 12(a). It can be
seen that the overall flame shape remains similar with the main heat release
region locate near the merging region between the pilot and main flames,
but the flame intensity increases gradually since the perturbation amplitude
increases. In one oscillation cycle, between 61.4 ms and 65.4 ms as shown by
the blue arrow in Fig. 12(a), detailed flame dynamics are shown in sequence
in Fig. 12(c). Two types of flame dynamics are identified. From 61.4 ms to
63.0 ms, flame surface wrinkling can be clearly seen by following the black
arrow marks, which is most probably caused by the velocity perturbation
and vortex roll-up effect [35]; this being a typical flame dynamics of premixed
swirl flame [44]. Significant flame intensity fluctuation at the merging region
between the pilot and main flames can also be clearly seen, e.g. between
62.2 ms and 64.6 ms by following the double-end arrows. This periodic bulk
fluctuation is similar to what has been observed in Fig. 4(c) for Pf Ma . As
stated in Section 3.1, this bulk flame motion has similar characteristics of
the typical dynamics of partially premixed flame [36, 37]. Note again that
in this merging region, equivalence ratio fluctuation could exist due to the
unsteady mixing of the two different premixed streams.
In order to see the flame dynamics more clearly, DMD modes of the flame
images are extracted for each of the two peak frequencies in the oscillation
spectrum, with results shown in Fig. 13(a, b). In the phase sequence of
Fig. 13(a), both the red and blue regions have nearly fixed axial locations –
proving that bulk oscillation is the dominant mechanism of flame dynamics
21(a)
(b)
50 0.8 50 50
0.6 1
0.6
0.4
Radial distance [mm]
Radial distance [mm]
Radial distance [mm]
25 0.4 25 25
0.5
0.2 0.2
0 0 0 0 0 0
-0.2 -0.2
-0.5
-25 -0.4 -25 -25
-0.4
-0.6
-0.6 -1
-50 -0.8 -50 -50
0 20 40 60 80 0 20 40 60 80 0 20 40 60 80
Axial distance [mm] Axial distance [mm] Axial distance [mm]
(c) (d) (e)
Figure 13: DMD modes (a, b) and local Rayleigh index maps (c-d) of Case Pf Mf . Dy-
namics of DMD modes at 198 Hz (a) and 223 Hz (b). Rayleigh index map via the original
data (c), Rayleigh index map at 198 Hz (d) and 223 Hz (e).
22for the 198 Hz mode. This resembles a similar bulk oscillation as shown in
Fig. 5(a) (of Case Pf Ma ), indicating that both of them are most probably
relevant to equivalence ratio fluctuations.
On the contrary, convective, and thus spatially distributed, coherent
structures along the ISL are found at the DMD results at 223 Hz in Fig. 13(b).
It can be seen from the phase sequence of Fig. 13(b) that two red spots (one
at the top and one at the bottom) start from the LRZ at 0◦ , move towards
the merging region at 60◦ with an increased amplitude. The two red spots
move further downstream along the ISL at 120◦ and gradually disappear at
180◦ . Two new blue spots are then generated from the LRZ at 180◦ and move
downstream in a similar way. This convective flame motion has similarities
to the one shown in Fig. 9(a) (of Case Pc Mf ) which is obtained when only the
main stage has an attached flame. Note again that similar flame dynamics
have been widely seen in premixed swirl flames [44].
It can be seen that flame dynamics in Case Pf Mf have two types of os-
cillations which respectively share similarities with the ones observed when
the main and pilot flames are independently operated. This reveals the com-
plexity of the current stratified flame, and also indicates the fundamental
mechanisms for the beating phenomena. In order to see how the two types of
flame dynamics are correlated to the thermoacoustic oscillations, three local
Rayleigh index maps are shown in Fig. 13(c-e). The Rayleigh index map
using the original data for both the pressure and flame images is plotted in
Fig. 13(c). Similar to Section 3.2, we pay more attention to the respective
locations of the damping and driving zones. Damping zones (blue) are iden-
tified both near the pilot-main flame merging region and outside of the flame
sheet while driving zones (red) are found along with the flame sheet, near
the flame merge and the flame-wall-interaction regions. We then use FFT
to extract the two frequencies components for each pixel of the flame images
and combine each of them with its corresponding frequency component in
the pressure signal to give Local Rayleigh index for the two frequencies sepa-
rately. These are shown in Fig. 13(d, e). It can be clearly seen that although
a damping region is seen at the merging region of the pilot-main flame at 198
Hz, the acoustics at both frequencies are in general driven by their coupling
with the corresponding flame dynamic modes. These decoupled Rayleigh
index maps provide important information on how both frequencies in the
beating oscillations are sustained by the complex pilot-main flame interac-
tions.
233.4. Acoustic analysis of beating oscillations
Based on the LES results, the change in vortex structures and related
velocity fluctuations are found to be unrelated to the frequencies of the ther-
moacoustic oscillations. Please refer to Figs. D and E in Supplemental
Material for more details. In order to understand the nature of the two fre-
quencies, f1 and f2 , observed in Case Pf Mf , a simplified acoustic analysis is
now conducted.
(a)
(b)
Figure 14: Simplified models for acoustic analysis: (a) Arrangement A: plenum + flame
tube, and (b) Arrangement B : flame tube only.
As shown in Fig. 1(b), the test rig can be considered the combination of
two parts: the upstream plenum and the flame tube. Following the works
of Lamraoui et al. [45] and Schuller et al. [46], the presence of the sud-
den expansion between these two sections means the system can feature
coupled or decoupled acoustic modes. The coupling index is defined as:
Ξ ' S1 /S2 (Tu /Tb )1/2 , where S1 and S2 are the cross-sectional areas of the
plenum and flame tube respectively, and Tu and Tb are the fresh and burnt
gas temperatures respectively. The resonant frequencies can be calculated
using the two simplified arrangements as shown in Fig. 14: 1) Arrangement
A: plenum + flame tube; 2) Arrangement B : flame tube only. The plenum
temperature Tu is 300 K, while the average temperature of the flame tube,
Tb , is obtained by averaging thermocouple measurements at different axial
locations along the flame tube. Due to heat loss, Tb is lower than the adia-
batic temperature. Tb and the coupling index Ξ are listed in Table 4. As Tb
is higher for Case Pf Mf and Pc Mf than for Case Pf Ma , Ξ is lower for Cases
24Pc Mf and Pf Mf , indicating a weaker coupling between the plenum and flame
tube [46]. The frequencies of the first acoustic mode for the two arrangements
are calculated using the open-source toolbox OSCILOS2 [47], which can be
applied to both longitudinal [47, 48] and annular configurations [49]. For
simplicity, the mean heat release of the flame is considered via imposing a
mean temperature jump across the flame, but unsteady heat release is not
considered. A velocity node is imposed at the inlet and a pressure node at
the outlet for both.
Table 4: Predicted acoustic resonant frequencies for the test rig.
Case Averaged Tb Ξ fA fB Experimental results
Pf Ma 746 K 0.137 156.2 Hz 168.5 Hz 159 Hz
Pc Mf 1294 K 0.102 198.5 Hz 218.7 Hz 224 Hz
Pf Mf 1379 K 0.099 203.9 Hz 225.4 Hz 198/223 Hz
Table 4 shows the resonant frequencies of the first longitudinal mode
predicted by the two models for three unstable operating conditions, i.e.,
Cases Pf Ma , Pc Mf and Pf Mf . The frequency in Case Pf Ma is captured
by Model A. In Case Pf Ma , only the pilot flame is operated, so the average
temperature in the flame tube appears not to be high enough to sustain a
decoupled mode. Conversely, a decoupled mode does occur for the main flame
mode (Case Pc Mf ); thermoacoustic instability occurs close to a decoupled
flame tube area. Finally, in Case Pf Mf , both of the two predicted resonant
frequencies, i.e., fA =203 Hz and fB =225.4 Hz agree approximately with
the experimental observations f1 =198 Hz and f2 =223 Hz. The frequency
difference, fA−B =20 Hz, also agrees approximately with the experimental
beating oscillations frequency of f1−2 =25 Hz. In contrast to the two previous
cases, this stratified flame couples simultaneously with both acoustic modes,
resulting in unique beating oscillations. To further validate this simplified
acoustic analysis, we have conducted an extra experiment with a longer flame
tube of 1200 mm in length. The frequency of beating oscillation can also be
predicted by the same approach used here. Please refer to Supplemental
Material for details (cf. Fig. F and Table B).
2
www.oscilos.com
25Based on the flame dynamics and Rayleigh Index analysis in Sections 3.1-
3.3, we can conclude that the beating oscillations come from the interactions
between the pilot and main flames. Of its two frequencies, the 223 Hz acoustic
mode interacts with mainly by the convective flame dynamics along with the
attached main flame and the 198 Hz mode interacts with mainly by the bulk
flame dynamics close to the pilot flame. The simplified acoustic analysis
conducted in this section further suggests that the 223 Hz component is
likely to be the flame tube dominated mode while the 198 Hz one likely to
be a plenum-flame tube coupled mode. As the flame responses to acoustic
perturbations may be nonlinear and the interactions between the main and
pilot stages increase the complexity, a detailed study into the nonlinear flame
response would be needed in order to provide a quantitative prediction for
the beating oscillations.
4. Conclusions
This work studies the pilot-main flame interactions in a stratified swirl
burner (BASIS). Premixed methane/air mixtures with different equivalence
ratios between the pilot and main stages are burned at atmospheric con-
ditions. Three categories of tests are conducted, including the pilot flame
mode, the main flame mode, and the stratified flame mode.
In the pilot flame mode, the flame features a V-shape when the main
stage is closed and an M-shape when the main stage is supplied with air.
LES results show that in the case with an air stream in the main stage,
the pilot stream is forced to expand more to join the main stream. The
methane/air mixture from the pilot stage is therefore diluted to generate
local equivalence ratio fluctuations. During combustion instabilities, a large
bulk oscillation of the flame is seen. In the main flame mode, when the pilot
stage is switched from closed to supplying pure air, the flame turns from an
attached V-shape flame to a lifted flame. In the attached V-shape flame case,
a convective motion of the flame is found during combustion instabilities. For
the lifted flame, intensified unsteady heat release and a stronger combustion
instability are found.
In the stratified flame mode, beating oscillations with two close frequen-
cies (198 Hz and 223 Hz) are found. This behaviour is found to be highly
sensitive to the combination of equivalence ratios of the pilot and the main
flames. Flame dynamics and acoustic-flame interactions are carefully studied
by using flame oscillation sequences, Dynamic Mode Decomposition and local
26Rayleigh index maps. Detailed analysis to the heat release dynamics shows
that the flame heat release perturbations at these two frequencies correspond
to a bulk oscillation (has similarities to the unstable pilot flame case) and a
convective motion (has similarities to the attached main flame case), respec-
tively. Local Rayleigh index for each frequency confirms that acoustics at
both frequencies are coupled with, i.e. driven by, their corresponding flame
dynamics. A simplified acoustic model is proposed to study the frequencies
of the two modes leading to the beating oscillations. This suggests that the
198 Hz mode corresponds to a plenum-flame tube coupled mode, while the
223 Hz mode corresponds to a single flame tube mode. Further study is
needed to provide quantitative predictions for the beating oscillations.
In summary, this work illustrates in detail the complexity of pilot-main
flame interactions and shed light on their effect on combustion instabilities
in a stratified swirl burner.
5. Acknowledgment
This work was financially supported by the National Science and Tech-
nology Major Project (2017-III-0004-0028), National Natural Science Foun-
dation of China (91641109, 51606004) and the European Research Council
(Grant No.772080) via the ERC Consolidator Grant AFIRMATIVE (2018-
23). The computational time using the CX2 HPC cluster at Imperial College
is gratefully acknowledged.
6. Supplementary materials
(1) Videos showing flame dynamics for all of the four cases (Cases Pf Ma ,
Pc Mf , Pa Mf and Pf Mf ) can be found in the supplementary materials.
(2) Additional figures and tables and the associate discussion to provide
further information and data.
References
[1] T. C. Lieuwen, V. Yang, Combustion instabilities in gas turbine engines:
operational experience, fundamental mechanisms, and modeling, AIAA,
2005.
27[2] S. K. Dhanuka, J. E. Temme, J. F. Driscoll, H. C. Mongia, Vortex-
shedding and mixing layer effects on periodic flashback in a lean pre-
mixed prevaporized gas turbine combustor, Proc. Combust. Inst. 32
(2009) 2901–2908.
[3] K.-J. Nogenmyr, P. Petersson, X.-S. Bai, A. Nauert, J. Olofsson,
C. Brackman, H. Seyfried, J. Zetterberg, Z. Li, M. Richter, et al.,
Large eddy simulation and experiments of stratified lean premixed
methane/air turbulent flames, Proc. Combust. Inst. 31 (2007) 1467–
1475.
[4] G. Kuenne, F. Seffrin, F. Fuest, T. Stahler, A. Ketelheun, D. Geyer,
J. Janicka, A. Dreizler, Experimental and numerical analysis of a lean
premixed stratified burner using 1D Raman/Rayleigh scattering and
large eddy simulation, Combust. Flame 159 (2012) 2669–2689.
[5] H. C. Mongia, T. Held, G. Hsiao, R. Pandalai, Challenges and progress
in controlling dynamics in gas turbine combustors, J. Propul Power 19
(2003) 822–829.
[6] L. Li, Y. Lin, Z. Fu, C. Zhang, Emission characteristics of a model
combustor for aero gas turbine application, Exp. Therm. Fluid Sci. 72
(2016) 235–248.
[7] C. T. Chong, S. S. Lam, S. Hochgreb, Effect of mixture flow stratification
on premixed flame structure and emissions under counter-rotating swirl
burner configuration, Appl. Therm. Eng. 105 (2016) 905–912.
[8] K. T. Kim, S. Hochgreb, The nonlinear heat release response of stratified
lean-premixed flames to acoustic velocity oscillations, Combust. Flame
158 (2011) 2482–2499.
[9] Z. Han, S. Hochgreb, The response of stratified swirling flames to acous-
tic forcing: Experiments and comparison to model, Proc. Combust. Inst.
35 (3) (2015) 3309–3315.
[10] Z. Han, S. Balusamy, S. Hochgreb, Spatial analysis on forced heat re-
lease response of turbulent stratified flames, J. Eng. Gas Turbines Power
137 (6) (2015) 061504.
28[11] A. Renaud, S. Ducruix, L. Zimmer, Bistable behaviour and thermo-
acoustic instability triggering in a gas turbine model combustor, Proc.
Combust. Inst 36 (2017) 3899–3906.
[12] J. E. Temme, P. M. Allison, J. F. Driscoll, Combustion instability of a
lean premixed prevaporized gas turbine combustor studied using phase-
averaged PIV, Combust. Flame 161 (2014) 958–970.
[13] X. Han, D. Laera, A. S. Morgans, C.-J. Sung, X. Hui, Y. Lin, Flame
macrostructures and thermoacoustic instabilities in stratified swirling
flames, Proc. Combust. Inst. 37 (2019) 5377–5384.
[14] Z. X. Chen, N. Swaminathan, M. Stöhr, W. Meier, Interaction between
self-excited oscillations and fuel–air mixing in a dual swirl combustor,
Proc. Combust. Inst. 37 (2019) 2325–2333.
[15] J. Kim, M. Jang, K. Lee, A. Masri, Experimental study of the beating
behavior of thermoacoustic self-excited instabilities in dual swirl com-
bustors, Exp. Therm. Fluid Sci. 105 (2019) 1–10.
[16] K. Kashinath, I. C. Waugh, M. P. Juniper, Nonlinear self-excited ther-
moacoustic oscillations of a ducted premixed flame: bifurcations and
routes to chaos, J. Fluid Mech. 761 (2014) 399–430.
[17] L. Kabiraj, R. I. Sujith, Nonlinear self-excited thermoacoustic oscilla-
tions: intermittency and flame blowout, J. Fluid Mech. 713 (2012) 376–
397.
[18] D. Durox, T. Schuller, N. Noiray, S. Candel, Experimental analysis of
nonlinear flame transfer functions for different flame geometries, Proc.
Combust. Inst. 32 (2009) 1391–1398.
[19] S. Balusamy, L. K. Li, Z. Han, M. P. Juniper, S. Hochgreb, Nonlinear
dynamics of a self-excited thermoacoustic system subjected to acoustic
forcing, Proc. Combust. Inst. 35 (2015) 3229–3236.
[20] M. P. Juniper, R. I. Sujith, Sensitivity and nonlinearity of thermoacous-
tic oscillations, Annu. Rev. Fluid Mech. 50 (2018) 661–689.
[21] G.-M. Choi, M. Tanahashi, T. Miyauchi, Control of oscillating combus-
tion and noise based on local flame structure, Proc. Combust. Inst. 30
(2005) 1807–1814.
29[22] F. Weng, S. Li, D. Zhong, M. Zhu, Investigation of self-sustained beating
oscillations in a Rijke burner, Combust. Flame 166 (2016) 181–191.
[23] K. Moon, H. Jegal, J. Gu, K. T. Kim, Combustion-acoustic interactions
through cross-talk area between adjacent model gas turbine combustors,
Combust. Flame 202 (2019) 405–416.
[24] X. Han, D. Laera, A. S. Morgans, Y. Lin, C.-J. Sung, The effect of
stratification ratio on the macrostructure of stratified swirl flames: Ex-
perimental and numerical study, J. Eng. Gas Turbines Power 140 (2018)
121004.
[25] H. G. Weller, G. Tabor, H. Jasak, C. Fureby, A tensorial approach to
computational continuum mechanics using object-oriented techniques,
Comput. Phys. 12 (1998) 620–631.
[26] X. Han, J. Li, A. S. Morgans, Prediction of combustion instability
limit cycle oscillations by combining flame describing function simula-
tions with a thermoacoustic network model, Combust. Flame 162 (2015)
3632–3647.
[27] Y. Xia, D. Laera, W. P. Jones, A. S. Morgans, Numerical prediction
of the Flame Describing Function and thermoacoustic limit cycle for a
pressurized gas turbine combustor, Combust. Sci. Technol. (2019) 979–
1002.
[28] F. Nicoud, F. Ducros, Subgrid-scale stress modelling based on the square
of the velocity gradient tensor, Flow Turb. Combust. 62 (1999) 183–200.
[29] V. Sabelnikov, C. Fureby, LES combustion modeling for high Re flames
using a multi-phase analogy, Combust. Flame 160 (2013) 83–96.
[30] W. Jones, R. Lindstedt, Global reaction schemes for hydrocarbon com-
bustion, Combust. Flame 73 (1988) 233–249.
[31] B. Fiorina, R. Mercier, G. Kuenne, A. Ketelheun, A. Avdić, J. Janicka,
D. Geyer, A. Dreizler, E. Alenius, C. Duwig, et al., Challenging model-
ing strategies for LES of non-adiabatic turbulent stratified combustion,
Combust. Flame 162 (2015) 4264–4282.
30[32] M. Bauerheim, G. Staffelbach, N. A. Worth, J. Dawson, L. Y. Gicquel,
T. Poinsot, Sensitivity of LES-based harmonic flame response model for
turbulent swirled flames and impact on the stability of azimuthal modes,
Prog. Energy Combust. Sci. 35 (2015) 3355–3363.
[33] P. Beénard, G. Lartigue, V. Moureau, R. Mercier, Large-eddy simula-
tion of the lean-premixed preccinsta burner with wall heat loss, Proc.
Combust. Inst. 37 (4) (2019) 5233–5243.
[34] X. Han, D. Laera, A. S. Morgans, Y. Lin, C. Zhang, X. Hui, C.-J.
Sung, Inlet temperature driven supercritical bifurcation of combustion
instabilities in a lean premixed prevaporized combustor, Exp. Therm.
Fluid Sci. (2019) 109857.
[35] P. Palies, D. Durox, T. Schuller, S. Candel, The combined dynamics
of swirler and turbulent premixed swirling flames, Combust. Flame 157
(2010) 1698–1717.
[36] M. Stöhr, Z. Yin, W. Meier, Interaction between velocity fluctuations
and equivalence ratio fluctuations during thermoacoustic oscillations in
a partially premixed swirl combustor, Proc. Combust. Inst. 36 (2017)
3907–3915.
[37] X. Wang, X. Han, H. Song, Y. Lin, C.-J. Sung, Combustion instabilities
of separated stratified swirling flames with different degrees of premixed-
ness, in: ASME Turbo Expo 2019, Paper No. GT2019-90852, 2019.
[38] T. Steinbacher, A. Albayrak, A. Ghani, W. Polifke, Consequences of
flame geometry for the acoustic response of premixed flames, Combust.
Flame 199 (2019) 411–428.
[39] T. Lieuwen, B. T. Zinn, The role of equivalence ratio oscillations in driv-
ing combustion instabilities in low NOx gas turbines, Proc. Combust.
Inst. 27 (1998) 1809–1816.
[40] P. J. Schmid, Dynamic mode decomposition of numerical and experi-
mental data, J. Fluid Mech. 656 (2010) 5–28.
[41] L. Rayleigh, The explanation of certain acoustical phenomena, Roy. Inst.
Proc. 8 (1878) 536–542.
31[42] H. Kantz, T. Schreiber, Nonlinear time series analysis, Vol. 7, Cambridge
university press, 2004.
[43] L. Kabiraj, A. Saurabh, N. Karimi, A. Sailor, E. Mastorakos, A. P.
Dowling, C. O. Paschereit, Chaos in an imperfectly premixed model
combustor, Chaos 25 (2015) 023101.
[44] S. Candel, D. Durox, T. Schuller, J.-F. Bourgouin, J. P. Moeck, Dynam-
ics of swirling flames, Annu. Rev. Fluid Mech. 46 (2014) 147–173.
[45] A. Lamraoui, F. Richecoeur, S. Ducruix, T. Schuller, Experimental
analysis of simultaneous non-harmonically related unstable modes in
a swirled combustor, in: ASME Turbo Expo 2011, Paper No. GT2011-
46701, 2011.
[46] T. Schuller, D. Durox, P. Palies, S. Candel, Acoustic decoupling of lon-
gitudinal modes in generic combustion systems, Combust. Flame 159
(2012) 1921–1931.
[47] J. Li, A. S. Morgans, Time domain simulations of nonlinear thermoa-
coustic behaviour in a simple combustor using a wave-based approach,
J. Sound Vib. 346 (2015) 345–360.
[48] J. Li, Y. Xia, A. S. Morgans, X. Han, Numerical prediction of combus-
tion instability limit cycle oscillations for a combustor with a long flame,
Combust. Flame 185 (2017) 28–43.
[49] D. Yang, D. Laera, A. S. Morgans, A systematic study of nonlinear
coupling of thermoacoustic modes in annular combustorscombutors, J.
Sound Vib. 456 (2019) 137–161.
32You can also read