Krill vs salps: dominance shift from krill to salps is associated with higher dissolved n:p ratios - Nature
←
→
Page content transcription
If your browser does not render page correctly, please read the page content below
www.nature.com/scientificreports

            OPEN           Krill vs salps: dominance shift from
                           krill to salps is associated with
                           higher dissolved N:P ratios
                           Christoph Plum1*, Helmut Hillebrand1,2,3 & Stefanie Moorthi1
                           Pronounced atmospheric and oceanic warming along the West Antarctic Peninsula (WAP) has resulted
                           in abundance shifts in populations of Antarctic krill and Salpa thompsoni determined by changes in the
                           timing of sea-ice advance, the duration of sea-ice cover and food availability. Krill and salps represent
                           the most important macrozooplankton grazers at the WAP, but differ profoundly in their feeding
                           biology, population dynamics and stoichiometry of excretion products with potential consequences
                           for the relative availability of dissolved nitrogen and phosphorus. Alternation of the dissolved nutrient
                           pool due to shifts in krill and salp densities have been hypothesized but never explicitly tested by using
                           observational data. We therefore used the Palmer LTER dataset in order to investigate whether the
                           dominance of either grazer is related with the observed dissolved nitrogen:phosphorus (N:P) ratios at
                           the WAP. Across the whole sampling grid, the dominance of salps over krill was significantly correlated
                           to higher concentrations of both N and P as well as a higher N:P ratios. Using actual long-term data,
                           our study shows for the first time that changes in key grazer dominance may have consequences for the
                           dynamics of dissolved nitrogen and phosphorus at the WAP.

                           The ocean around the West Antarctic Peninsula (WAP) is a highly productive system with summer peak phy-
                           toplankton blooms promoting large populations of macrozooplankton such as the Antarctic krill Euphausia
                           superba, the salp Salpa thompsoni (the predominant pelagic tunicate in this region) and many marine mam-
                           mals1–3. The dynamics of this unique ecosystem are commonly driven by the seasonal extent and retreat of sea ice
                           and its interannual variability4. However, the Antarctic Peninsula has experienced major alterations in climate
                           conditions during the last decades4. The rapid warming of winter air temperature and sea surface temperature
                           resulted in declining perennial and seasonal sea-ice extent and duration5–9. Since this warming effect is more pro-
                           nounced in the northern half of the peninsula, the latitudinal climate gradient with warmer, humid conditions in
                           the north but a cold-dry polar-type continental climate in the south has become steeper7–9. These alterations have
                           caused considerable changes in the phytoplankton community2,10. While algal biomass dramatically decreased
                           in the northern region of the WAP involving changes in community composition from large diatoms to smaller
                           flagellate species, phytoplankton biomass increased in the southern part due to the expanding open water areas
                           associated with the decline in sea-ice cover2,10–12.
                               The observed changes in the abiotic environment and phytoplankton community structure have a strong
                           potential to influence reproduction, recruitment and distribution of key grazers such as Euphausia superba (krill
                           hereafter) and the salp Salpa thompsoni (salps) due to a strong bottom-up control of the system9. The temporal
                           and spatial fluctuations in the abundance of krill and salps are commonly assigned to water temperatur, the tim-
                           ing of sea-ice advance, duration of sea-ice cover and food availability13,14. Krill abundance, in particular, is tightly
                           coupled to the sea-ice formation, predominantly in areas of krill recruitment, as well as higher concentrations of
                           chlorophyll14,15. In contrast, S. thompsoni is considered as a typical oceanic species, favoring warmer and ice-free
                           open waters with lower food concentrations13,16,17.
                               During the last decades, several publications have reported a shift in the distribution and abundance of krill
                           and salps in the Southern Ocean3,12,18–23. Previous studies focusing on large-scale spatial and temporal dynamics
                           of the krill population by using the KRILLBASE dataset have reported a considerable decrease in krill density
                           and simultaneous southward shift of the population within the SW Atlantic sector of the SO18. Although another

                           1
                            University of Oldenburg, Institute for Chemistry and Biology of the Marine Environment (ICBM), Wilhelmshaven,
                           Germany. 2Helmholtz Institute for Functional Marine Biodiversity (HIFMB) at the University of Oldenburg,
                           Oldenburg, Germany. 3Alfred Wegener Institute, Helmholtz-Centre for Polar and Marine Research (AWI),
                           Bremerhaven, Germany. *email: c.plum@uni-oldenburg.de

Scientific Reports |   (2020) 10:5911 | https://doi.org/10.1038/s41598-020-62829-8                                                               1
www.nature.com/scientificreports/ www.nature.com/scientificreports
study suggested that the decline is less severe than predicted24, a recently published model confirmed the previ-
ously described trend in decreasing krill density especially north of the WAP21. In addition, the shrinking krill
population is further contracting southward and closer to the shelf21, eventually being replaced by salps which
intrude the warmer, ice-free water bodies16,22,23.
Changes in the frequency of salp and krill occurrence as well as their abundance have been also observed
along the western shores of the Antarctic Peninsula20,25. However, the long-term trend in krill and salp abundance
is less clear. Considering solely the data available from the Palmer LTER grid, a monitoring programm covering
30 years of observations stretching along the WAP, no overall long-term directional trend in krill and salp density
has been observed so far3,25. Here, anomalies in krill and salp abundance were less pronounced or even opposite
to those observed north of the peninsula25. Spatial and temporal overlap of krill and salps has became more com-
mon in recent years, but neither salp peak densities nor the frequency of peak years with high salp abundance
increased along the WAP17,22,25,26. Salp abundance alternated between negative and positive anomalies with no
long-term changes in the northern part of the Palmer grid. However, as with krill, highest salp densities shifted
southward with an increasing trend in abundance with more and larger positive anomalies in the second half of
the Palmer LTER time-series3,25.
Potential long-term shifts in krill and salp populations may have a significant impact on phytoplankton com-
munity structure, food web dynamics and the biogeochemistry of the WAP pelagic ecosystem. Antarctic krill in
particular plays a major role in the system, as it represents a direct link between primary producers and higher
trophic levels27,28. While the importance of salps as a food source for higher trophic levels is controversial29, their
rapid formation of high densities and their high grazing efficiencies can have substantial impacts on primary
production30. As important macrograzers, krill and salps not only directly influence phytoplankton communities
via grazing, but also indirectly through the remineralisation and resupply of macronutrients such as nitrogen and
phosphorus that are pivotal for phytoplankton to thrive31–33. Several studies have highlighted the importance of
zooplankton nutrient recycling in the marine environment of the SO31,34–37. While different abundant zooplank-
ton groups such as copepods, amphipods or pteropods as well as microzooplankton contribute to the recycling of
nutrients and trophic interactions around the WAP, Antarctic krill and S. thompsoni are generally recognized as
key species for the remineralization of inorganic nutrients and the transfer of organic matter32,36,38–43.
Two mechanisms of recycling are commonly proposed for meso- and macrozooplankton – egestion and sub-
sequent degradation of particulate organic matter in form of fecal pellets and the excretion of inorganic nutrients
such as nitrogen and phosphorus. However, Antarctic krill and salps reveal profound differences in their body
stoichiometry, fecal pellet production and excretion rates. Although the previously reported excretion rates of E.
superba and S. thompsoni show a high variability34,44,45, the average carbon specific metabolic rates of N and P as
well as the N:P excretion ratios of salps can be higher than those observed for krill and copepods41,46. Such inter-
specific differences in the stoichiometry of consumer excretion products can substantially modify the nutrient
supply to primary producers by changing the relative availability of essential macronutrients, which in turn can
result in strong indirect effects on primary production and community composition47–49. Accordingly, a previous
model based on experimentally obtained data of individual nutrient excretion rates and respiration predicted
that a shift from krill to salps may significantly change the C, N, and P cycles in the Southern Ocean41. Hence, one
might expect that an increasing occurance of salps at the WAP may lead to a shift towards higher N:P ratios in the
dissolved nutrient pool. Subsequently, phytoplankton community structure as well as trophic interactions could
be modified due to elemental imbalances between planktonic consumers and their food with consequences for
whole food web dynamics.
However, data on krill and salp stoichiometry as well as on dissolved N and P in the SO are still scarce, lim-
iting valid information on potential long-term effects of shifts in krill and salp populations on the dynamics of
dissolved nutrients. While potential top-down effects of the observed changes in krill and salp abundance on
nutrient dynamics at the WAP have been hypothesized and discussed in previous studies37,41,50, the relationship
between krill and salp density and the N and P dynamics has never been explicitly investigated by using envi-
ronmental long-term datasets. In order to evaluate previous assumptions and to predict potential consequences
of a long-term shift from krill to salps on nutrient dynamics along the WAP we analyzed 23 years of the Palmer
Long-Term Environmental Research (Palmer LTER) time-series dataset with regard to the relationship between
salp and krill abundance and the dissolved N and P concentrations as well as dissolved N:P ratios. Based on the
assumption that salps and krill differ in their excretion stoichiometry (i.e. salps excrete more N than krill in
relation to P), we expect a significant positive relationship between higher salp densities and the availability of
dissolved N, P, and the N:P ratio.
Material and Methods
To assess the potential effect of krill and salps on the availability of dissolved N, P and the N:P ratio, we used
the Palmer LTER long-term dataset (https://pal.lternet.edu/data). The Palmer LTER study area is situated at the
west-coast of the Antarctic Peninsula and reaches from Anvers Island in the north to approx 700 km south near
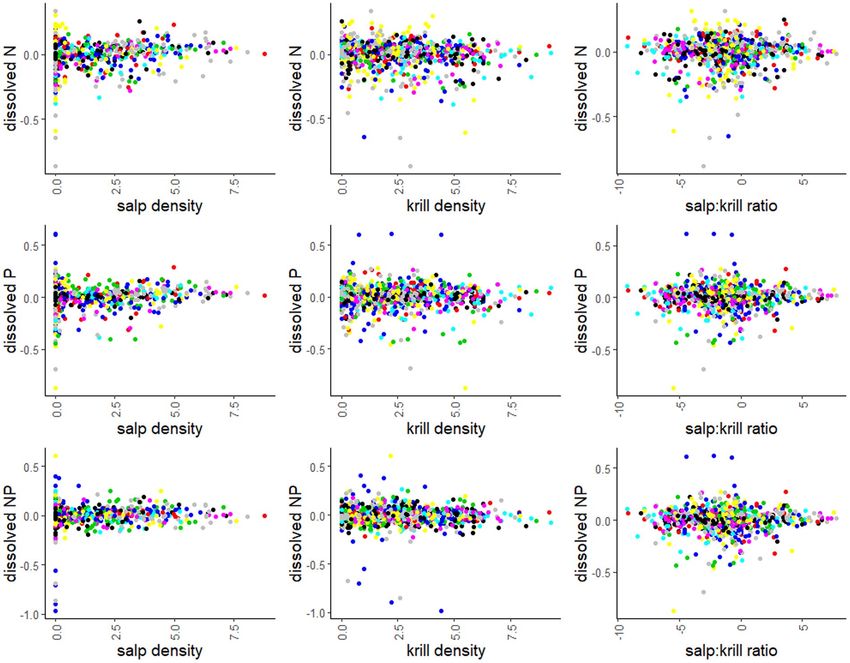
Charcot Island and from coastal to slope waters approx. 200 km offshore (Fig. 1). The Palmer LTER grid was sam-
pled each year during annual research cruises in austral summer (January-February) aboard the MV Polar Duke
and ARSV Laurence M Gould. Consequently, the data we used refer solely to the summer peak season.
From the Palmer cruise data time-series, we extracted the historical and current zooplankton densities as well
as the dissolved inorganic nutrient data including dissolved N and P collected between 1991 and 2016. Detailed
information on zooplankton collection and nutrient sampling processes have been described in previous studies
and reports51–53.
For our analysis, we excluded samples with no or zero concentrations of dissolved nutrients (i.e., we only
included samples with concentrations >0). Some samples showed very high concentrations, therefore we deleted
outliers defined as nutrient concentrations outside of 2.5*standard deviation.
Scientific Reports | (2020) 10:5911 | https://doi.org/10.1038/s41598-020-62829-8 2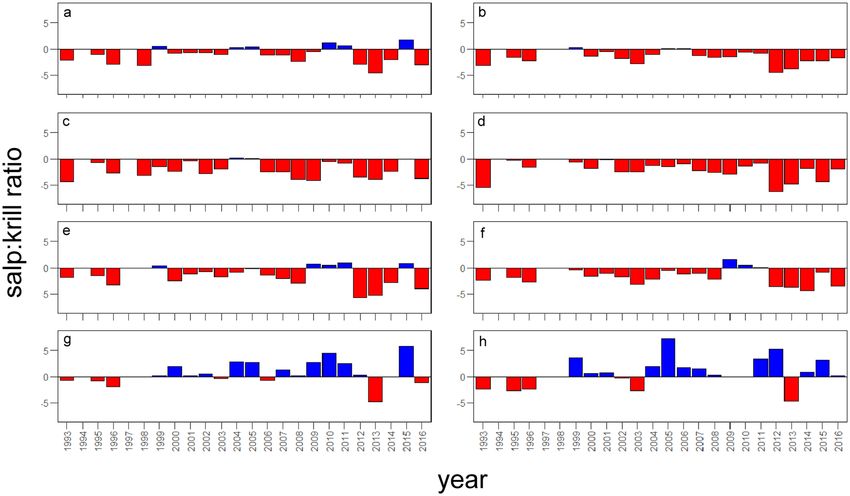
www.nature.com/scientificreports/                                                              www.nature.com/scientificreports

                           Figure 1. Palmer LTER study area location and bathymetry. Stations are located on a grid system (shown
                           within the rectangular box) off the West Antarctic Peninsula. Bathymetry is indicated by grey shading, with
                           depths noted in the greyscale color bar to the right. The grid encompasses continental slope, shelf and coastal
                           regions as separated (and labeled) by dashed and solid lines running roughly parallel to the coast. Position of the
                           physical oceanographic mooring is shown by the green circle. The red dot represents the location of U.S. Palmer
                           Station. An = Anvers Island (home of Palmer Station), R = Renaud Island, L = Lavosier Island, Ad = Adelaide
                           Island (home of U.K. Rothera Station), MB = Marguerite Bay. Figure adapted from Palmer LTER network.
                           Figure courtesy D. Martinson and R. Iannuzzi, Palmer Antarctica LTER.

                               The majority of dissolved nutrient data was obtained from depths that matched the zooplankton hauls from
                           120 m. In most cases, only two nutrient sampling depths per station were deeper than the permanent pycno-
                           cline (150–200 m). However, we decided to include those observations in our analysis for the following reasons.
                           Nutrient concentrations below 100 m revealed very low variability. Consequently, excluding these values from
                           the analysis had no significant effect on the outcome. In addition, krill and in particular salps show a pronounced
                           vertical migration and have been observed at depth deeper than 150 m30,39,54. As a consequence, zooplankton
                           migration may contribute to nutrient fluxes across the pycnocline to depth deeper than 120 m.
                               The nutrient data of the Palmer LTER were measured multiple times at the same station in the same year, but
                           this was not consistent across all variables and time periods. Therefore, we used mean values and combined the
                           mean zooplankton data with the mean nutrient data based on station number, grid line number and year in order
                           to be able to compare the density data with the nutrient variables. As a consequence, the dataset was reduced
                           down to 823 observations across the whole Palmer grid between 1993 and 2016. In the reduced dataset, density
                           values for the years 1994, 1997, 1998, 2009 and 2010 were partly excluded by merging the zooplankton data with
                           the environmental data due to missing N and P measurements. An additional figure of the whole dataset between
                           1993 and 2016 is included in the appendix (Appendix Fig. 1).
                               In accordance with previous zooplankon analyses using the Palmer dataset8, we either included the entire grid
                           for our analysis, or divided the grid into latitudinal sub-regions based on hydrographic and sea-ice conditions.
                           We partly adapted the methods from Steinberg et al.8 but divided the grid into North (sampling lines 400–600)
                           and South (sampling lines −100–300). We also considered the bathymetric gradient from the coast to the oce-
                           anic regions by dividing the grid into coastal stations (1000 m)8.
                               In addition, krill and salp abundance data were corrected for differences between day and night catches in pre-
                           vious studies3,20,55. Based on this, we assessed the potential effect of day vs. night sampling on the outcome of our
                           analyses. Similar to the previous investigations, we determined sun elevation at the time and location of each tow,
                           with night defined as a sun elevation < −0.833° 3,20,55. We then tested for differences between night and day densi-
                           ties by using an analysis of variance (ANOVA) on krill and salp abundance data. As we determined no significant
                           differences in our dataset between day and night catches, we did not correct the densities for further analyses.
                           Similarly, Steinberg et al.3 stated, that the use of corrected or uncorrected data had no significant effect on their

Scientific Reports |   (2020) 10:5911 | https://doi.org/10.1038/s41598-020-62829-8                                                            3
www.nature.com/scientificreports/ www.nature.com/scientificreports
Figure 2. Spatial and temporal patterns of the salp:krill ratio. Negative values (red) indicate higher krill density
relative to salps while positive values (blue) indicate more salps in relation to krill. The salp:krill ratio is plotted
separately for the North (a) and South (b) of the Palmer grid as well as the coastal, shelf and slope sub-regions
for the northern (c,e,g) and southern (d,f,h) area, respectively. Note that only data from the reduced dataset
(n = 823) were used. In the reduced dataset, concurrent nutrient, krill, and salp abundance data are partially not
available for the years 1994, 1997, and 2009.
results. In addition, another previous study demonstrated that the effect of corrected daytime krill densities was
minor for December and January55. Therefore, we decided to test our hypothesis on uncorrected density data.
Statistical analysis. In order to determine the relationship between krill vs. salps and the concentrations
of dissolved N and P as well as the corresponding molar N:P ratio we performed a linear mixed effects model
(LMM) using the lmer function in the R package lme456. As random effects, we used year and the Palmer LTER
stations nested in year to account for the interannual and spatial variation in the data. This allowed for different
intercepts by the temporal and spatial location of the sample. As fixed effects, we entered the salp and krill abun-
dance as interacting terms into the model. Whereas this analysis tested for the effects of salp and krill density
(Model 1), we ran an additional model with only the salp:krill ratio as fixed effect (Model 2). We conducted all
analyses on log transformed data to meet the assumptions of normality. We assumed a Gaussian distribution
and checked the normal distribution of model residuals to confirm goodness of fit. We additionally checked the
residual plots to ensure homoscedasticity. Based on the F-ratios obtained for the fixed factors in the LMM, we
obtained significance levels using the critical F for the appropriate degrees of freedom. We initially included other
abundant zooplankton taxa such as the gastropod Limacina and copepods in the mixed effects models. However,
including them in the model had no effect on the results for krill and salps. Therefore, we decided to focus on the
two target species Euphausia superba and Salpa thompsoni in our analysis.
Results
Spatial patterns of krill and salp abundance. The salp:krill density ratio revealed significant differences
in the regional patterns of co-occurrance and dominance between the investigated areas of the WAP (Fig. 2a).
Over the 23 years of observations, krill densities were higher than salp densities across the whole Palmer grid with
the exception of a few years with high salp abundance (Fig. 2a).
The partition of the grid into different regions additionally showed a strong variability in the relative densi-
ties of krill and salps between north and south as well as coastal, shelf and slope areas. Whereas in the northern
area more positive salp:krill ratios were observed over time, indicating higher salp abundance, krill remained
more abundant than salps in the southern part of the grid (Fig. 2b). Likewise, krill consistently dominated the
coastal and shelf areas (Fig. 2c-f), but salps generally showed significantly higher densities across the slope sta-
tions (>1000 m) since 1999 (Fig. 2g,h).
Relation of krill and salps to dissolved N and P. Across the models, large variation in nutrients (N,
P, N:P) was observed between years and when stations were nested within years (Table 1). The random terms
accounted for 30–47% of the variance, with most variance being observed between years.
However, the mixed effect models revealed significant relationships between krill and salp densities (Model
1) as well as their ratio (Model 2) and the dissolved N and P concentrations as well as the N:P ratios within the
Palmer grid between 1993 and 2016 (Table 2). When considering the whole grid, the concentration of dissolved
N was significantly lower when more krill were present, while N was positively associated with increasing salp
Scientific Reports | (2020) 10:5911 | https://doi.org/10.1038/s41598-020-62829-8 4www.nature.com/scientificreports/ www.nature.com/scientificreports
Fixed Effect Random Effects Response Variance Std Dev
station:year N 0.001231 0.03508
year N 0.012324 0.11101
residuals N 0.01319 0.11485
station:year P 0 0
Model 1 year P 0.01203 0.1097
residuals P 0.01339 0.1157
station:year NP 3.81E-05 0.006176
year NP 1.01E-02 0.100322
residuals NP 1.19E-02 0.108848
station:year N 0.001221 0.03494
year N 0.012443 0.11155
residuals N 0.01321 0.11494
station:year P 6.02E-12 2.45E-06
Model 2 year P 1.22E-02 1.11E-01
residuals P 1.34E-02 1.16E-01
station:year NP 1.12E-09 3.35E-05
year NP 1.01E-02 1.00E-01
residuals NP 1.19E-02 1.09E-01
Table 1. Results for the random effects from the linear mixed effects models. The table shows the variance
and standard deviation of the random effect for each response variable. Model 1 uses log transformed krill and
salp abundance as well as the interaction between krill and salps as a fixed effect. Model 2, in turn, used the
salp:krill ratio as the fixed effect. In both models, year and station were used as random effects. N = nitrogen,
P = phosphorus, NP = nitrogen:phosphorus ratio.
Fixed Effects Response Estimate Se(Estimate) T-Value F p
Model 1
log krill N −0.003806 0.002837 −1.341 9.7719www.nature.com/scientificreports/ www.nature.com/scientificreports
Figure 3. Partial residual plots. Overall relation between dissolved N (µmol), dissolved P (µmol) as well as the
N:P molar ratio and the salp and krill density (ind. 1000 m3) as well as the salp:krill ratio across the Palmer grid.
Note that only data from the reduced dataset (n = 823) were used. The data points display the residuals from the
respective linear mixed effects models (model 1 = krill and salp density, model 2 = salp:krill ratio). The colors
indicate different years to visualize annual variability. All data are ln-transformed.
Contrasting the results for salps, krill density showed a significant negative relation with dissolved N and N:P,
but revealed no correlation with P in the northern area. Similar patterns were detected for the South, where high
abundances of krill were negatively associated with N, but revealed no significant relation with P or the N:P ratio.
The salp:krill ratio, in turn, was positively related to dissolved N and the N:P ratio in the North, i.e. the more
salps, the higher the N:P ratio. In the southern part of the Palmer LTER grid the salp:krill revealed a significantly
positive relationship with dissolved N and P but not with the N:P ratio. For all fixed effects, i.e. salp density, krill
density and the salp:krill ratio, the variance in the data was higher in the South compared to the northern part
(Appendix Fig. 3 and Fig. 4). However, when subsetting the whole grid into coastal, shelf and slope areas, we
could not detect any significant relations between krill or salps and the dissolved inorganic nutrient pool.
Discussion
Spatial patterns of krill and salp abundance. Our results showed that the relative abundance of krill
and salps differed most strongly between coastal waters and the slope areas of the Palmer grid. Krill densities
were higher than salps along the coast across the grid (north and south), while salps revealed higher densities
compared to krill mainly over the slope. The relative abundance data revealed an increasing trend of salp years in
the nothern area when the data of the coast, shelf and slope regions were combined. This is, overall, in accordance
with previous investigations of the spatial and temporal population dynamics of krill and salps along the west-
coast of the Antarctic Pensinsula3,18,21,23,25. The consistency of our results with previously documented distribu-
tion patterns of krill and salps across the Palmer grid demonstrated that the reduced dataset used in our analysis
provided valid information to test our hypothesis regarding dissolved nutrients discussed in the section below.
We deliberately focused our study on krill and salps as they were often described as the dominant macro-
zooplankton taxa along the WAP, showing high grazing impact and recycling rates. Consequently, our study is
mainly aiming at the evaluation of previously stated theoretical assumptions and discussions that shifts in krill
and salp populations may influence biogeochemistry at the WAP on a larger scale, and we were mainly interested
in whether this can be actually supported by real long-term observational data.
Scientific Reports | (2020) 10:5911 | https://doi.org/10.1038/s41598-020-62829-8 6www.nature.com/scientificreports/ www.nature.com/scientificreports
Impact of krill vs salps on dissolved N and P. The concentrations of nitrogen and phosphorus across
the Palmer LTER grid exhibited strong interannual variability and regional differences. Consequently, year and
station (used as the random term in our mixed effects model) accounted for roughly 50% of the variability in the
nutrient data. Nonetheless, across the whole Palmer grid, the outcome of the models indicated that the concentra-
tion of dissolved N and P is significantly positive related with salp densities but negatively correlated with increas-
ing krill densities. Moreover, the more salps were present in absolute or relative terms, the higher the available
dissolved N:P ratio. However, we have to mention that the correlation between grazer density and the dissolved
nutrients accounted for less than 5% of the overall variability in the N and P data. In addition, the models revealed
regional differences in the magnitude and direction of the observed relationships. While the results showed sig-
nificant differences in the observed relations between the southern and the northern area of the grid, there were
no significant relationships along the bathymetrical gradient from the coast to the slope. Although the relative
contribution of krill and salp density may be rather small on a larger temporal scale compared to predominant
physical drivers, the outcome of the mixed effects model indicates that a dominance shift in the zooplankton
compartment from krill to salps can have a significant feedback on the availability and stoichiometry of essential
nutrients in the marine ecosystem of the WAP. Our study thereby supports previous assumptions and statements
on the future role of krill and salps for the nutrient dynamics along the WAP22,37,41. However, the effects of a shift
in krill and salp dominance on the dissolved nutrient pool hypothesized in these studies may be less severe than
assumed.
The general importance of zooplankton as a biological contributor to the nitrogen and phosphorus required
by phytoplankton communities has been recognized in previous field studies and experimental investigations32,37.
While different abundant zooplankton groups, including microzooplankton, can contribute to the recycling of
N and P along the WAP throughout the year50, key macrozooplankton grazers such as krill and salps can play
a major role in the resupply of N and P to phytoplankton36,37. The relation between planktonic grazers and the
dissolved nutrient pool in aquatic ecosystems is usually constrained by the stoichiometric demand of the con-
sumer species involved and their species-specific excretion ratios. Several studies from other aquatic systems
have pointed out the potentially severe effect of consumer driven changes in nutrient supply on food web dynam-
ics49,57–59, and more recent investigations of the WAP marine ecosystem have discussed similar effects37. Spatially
or temporally heterogeneous aggregations of mobile organisms have the potential to generate biogeochemical
hotspots that may modify patterns of nutrient remineralisation and ecosystem nutrient dynamics60,61. Thus, dense
aggregations of krill and salps may increase nutrient remineralization and therefore concentrations of dissolved N
and P on a defined spatial and temporal scale. In a first theoretical approach, Alcaraz et al.41 estimated the poten-
tial consequences of a krill to salp shift for the nutrient dynamics in the SO based on experimental data. They
reported higher average N:P excretion ratios in salps compared to adult krill and concluded that the average met-
abolic N:P ratio of the whole zooplankton community will increase by a factor of two in case of a persistent krill
to salp shift. In fact, the available data on krill and salp stoichiometry indicate lower N:P excretion ratios com-
pared to body elemental composition in both species34,45, indicating that N is retained preferentially in krill and
salps. On average, however, the N:P excretion ratio of salps can be higher compared to krill41. This may indicate
relatively higher P demand in salps due to higher growth rates and less N-rich structural compounds. Other stud-
ies on invasive species have shown that an increase in the population of organisms with specific stoichiometric
footprints that differ from the native community significantly altered the nutrient dynamics by changes in rem-
ineralization rates. A study from the Caspian Sea, for instance, demonstrated increased nitrogen concentrations
after the intrusion of the ctenophore Mnemiopsis leidyi62. This shows that changes in consumer composition can
significantly modify N and P dynamics in aquatic ecosystems with subsequent consequences for element fluxes
and biogeochemical cycles.
One might argue, that inorganic N and P are usually available in excess around the WAP and consequently
may not be the main limiting nutrients for primary production4. However, along the coast of the WAP, micro-
nutrient concentrations are often high enough to promote phytoplankton blooms that may completely utilize
the available macronutrients63–65, making phytoplankton communities more vulnerable to changes in recycled
dissolved N:P ratios. Even under nutrient replete conditions, changes in the optimal N:P ratio available for the
phytoplankton community can modify the composition and productivity of primary producers66. In addition to
that, Glibert et al.57 highlighted the importance of macronutrients such as N and P not only at levels of limitation
but also at excess concentrations relative to the cellular demand. Consequently, eleveated N:P ratios of the inor-
ganic nutrient pool due to altered zooplankton community excretion ratios can exert a strong feedback effect on
phytoplankton community structure, indicating that a shift from krill to salps as the dominant macrozooplank-
ton grazers may select for phytoplankton communities that exhibite higher N:P ratios. Studies on the relation
between POM stoichiometry and phytoplankton community structure in the SO reported lowest seston N:P
ratios in areas dominated by diatoms and, in contrast, relatively high N:P where flagellates or Phaeocystis dom-
inated67–69. Thus, potential modifications of the inorganic N:P pool are likely to further accelerate the reported
changes in phytoplankton community composition along the WAP10,11. In addition, nutrient dynamics in the SO
are often closely coupled to bloom variability and the nutrient drawdown by phytoplankton63,67,70. Consequently,
changes in inorganic N:P and subsequent shifts in phytoplankton community structure may substantially alter
the draw down and export ratios of N:P to deeper layers and further modify the biogeochemistry and food web
dynamics of the WAP67,70.
Differences in the species specific grazing efficiency of krill and salps represents another potential mechanism
that may explain changes in nutrient dynamics. It has been described that krill predominantly consumes diatoms
while salps, in turn, show a higher efficiency for smaller food particles such as flagellates39. Such differences in
prey-specific consumption of stoichiometrically different phytoplankton taxa may influence the nutrient draw
down by phytoplankton and subsequently change the stoichiometry of phytoplankton communities and dissolved
nutrients. Aside from nutrient changes induced by trophic interactions in the plankton community, physical
Scientific Reports | (2020) 10:5911 | https://doi.org/10.1038/s41598-020-62829-8 7www.nature.com/scientificreports/ www.nature.com/scientificreports
factors such as vertical mixing also play an important role for nutrient dynamics, especially on the slope and the
continental shelf of the WAP. Upwelling and mixing of the Circumpolar Deep Water (CDW) pumps nutrient rich
water onto the continental shelf, potentially reducing the relative importance of macrograzer recycling for the
long-term dynamics of dissolved nutrients5,64.
However, potential changes in the N:P supply may become more relevant in future scenarios for coastal areas
of the WAP, where shelf sediments and glacial run-offs may increase trace metal inputs, sufficient enough to
promote substantial phytoplankton growth71,72. In addition, upwelling and nutrient fluxes may be reduced with
increasing temperatures and a stabilizing thermocline, thereby potentially creating nutrient limitation and higher
vulnerability of phytoplankton to shifts in dissolved N:P ratios within the WAP marine ecosystem. Considering
continuously increasing salp densities along the WAP, the coastal ecosystem may display elevated dissolved
N:P ratios in the future with subsequent consequences for nutrient dynamics and phytoplankton community
composition.
Conclusion
Based on long-term observational data, our findings indicate for the first time that changes in dense populations
of major macrograzers such as Antarctic krill and salps can be related to patterns in N and P stoichiometry along
the western coast of the Antarctic Peninsula. Although resource availability at the WAP shows high temporal
and spatial variability that is predominantly driven by seasonality, geomorphology and the unique hydrographic
patterns, the outcome of our analysis provides first evidence from existing long-term observational data, that
changes in the relative abundance of krill and salps have the potential to alter the N:P dynamics along the coast
of the WAP. Thereby, our results support previous assumptions on the relation between predicted changes in krill
and salp densities and the biogeochemistry of the Southern Ocean.
However, at the current state, information on stoichiometric dynamics in planktonic systems of remote areas
like the WAP remain limited and therefore conclusions are still speculative. We therefore hope, that our study
provokes further discussion and investigations of the stoichiometric interactions in planktonic communities of
the SO. We further emphasize the importance of a comprehensive assessment of plankton community structure
and biogeochemistry in order to predict how future changes in the composition of key species might modify
stoichiometric dynamics in the planktonic food web of the Southern Ocean.
Data availability
The datasets analysed during the current study are available on the Palmer LTER webpage https://pal.lternet.edu/
data. The data and analysis generated during the current study are available from the corresponding author on
reasonable request.
Received: 13 June 2019; Accepted: 18 March 2020;
Published: xx xx xxxx
References
1. Smith, R. C., Martinson, D. G., Stammerjohn, S. E., Iannuzzi, R. A. & Ireson, K. Bellingshausen and western Antarctic Peninsula
region: Pigment biomass and sea-ice spatial/temporal distributions and interannual variabilty. Deep Sea Res. Part II Top. Stud.
Oceanogr. 55, 1949–1963 (2008).
2. Schofield, O. et al. Decadal variability in coastal phytoplankton community composition in a changing West Antarctic Peninsula.
Deep Sea Res. Part Oceanogr. Res. Pap. 124, 42–54 (2017).
3. Steinberg, D. K. et al. Long-term (1993–2013) changes in macrozooplankton off the Western Antarctic Peninsula. Deep Sea Res. Part
Oceanogr. Res. Pap. 101, 54–70 (2015).
4. Kim, H. et al. Climate forcing for dynamics of dissolved inorganic nutrients at Palmer Station, Antarctica: an interdecadal
(1993–2013) analysis. J. Geophys. Res. Biogeosciences 121, 2369–2389 (2016).
5. Martinson, D. G., Stammerjohn, S. E., Iannuzzi, R. A., Smith, R. C. & Vernet, M. Western Antarctic Peninsula physical oceanography
and spatio–temporal variability. Deep Sea Res. Part II Top. Stud. Oceanogr. 55, 1964–1987 (2008).
6. Schofield, O. et al. How do polar marine ecosystems respond to rapid climate change? Science 328, 1520–1523 (2010).
7. Stammerjohn, S., Massom, R., Rind, D. & Martinson, D. Regions of rapid sea ice change: An inter‐hemispheric seasonal comparison.
Geophys. Res. Lett. 39, (2012).
8. Ducklow, H. W. et al. West Antarctic Peninsula: an ice-dependent coastal marine ecosystem in transition. Oceanography 26, 190–203
(2013).
9. Kerr, R., Mata, M. M., Mendes, C. R. B. & Secchi, E. R. Northern Antarctic Peninsula: a marine climate hotspot of rapid changes on
ecosystems and ocean dynamics. (2018).
10. Montes-Hugo, M. et al. Recent changes in phytoplankton communities associated with rapid regional climate change along the
western Antarctic Peninsula. Science 323, 1470–1473 (2009).
11. Moline, M. A., Claustre, H., Frazer, T. K., Schofield, O. & Vernet, M. Alteration of the food web along the Antarctic Peninsula in
response to a regional warming trend. Glob. Change Biol. 10, 1973–1980 (2004).
12. Rogers, A. D. et al. Antarctic Futures: An Assessment of Climate-Driven Changes in Ecosystem Structure, Function, and Service
Provisioning in the Southern Ocean. Annu. Rev. Mar. Sci. 12, annurev-marine-010419–011028 (2020).
13. Pakhomov, E., Dubischar, C., Strass, V., Brichta, M. & Bathmann, U. The tunicate Salpa thompsoni ecology in the Southern Ocean.
I. Distribution, biomass, demography and feeding ecophysiology. Mar. Biol. 149, 609–623 (2006).
14. Loeb, V. et al. Effects of sea-ice extent and krill or salp dominance on the Antarctic food web. Nature 387, 897 (1997).
15. Flores, H. et al. Impact of climate change on Antarctic krill. Mar. Ecol. Prog. Ser. 458, 1–19 (2012).
16. Loeb, V. & Santora, J. Population dynamics of Salpa thompsoni near the Antarctic Peninsula: growth rates and interannual variations
in reproductive activity (1993–2009). Prog. Oceanogr. 96, 93–107 (2012).
17. Ono, A. & Moteki, M. Spatial distributions and population dynamics of two salp species, Ihlea racovitzai and Salpa thompsoni, in
the waters north of Lützow-Holm Bay (East Antarctica) during austral summers of 2005 and 2006. Polar Biol. 36, 807–817 (2013).
18. Atkinson, A., Siegel, V., Pakhomov, E. & Rothery, P. Long-term decline in krill stock and increase in salps within the Southern
Ocean. Nature 432, 100 (2004).
19. Smetacek, V. & Nicol, S. Polar ocean ecosystems in a changing world. Nature 437, 362 (2005).
Scientific Reports | (2020) 10:5911 | https://doi.org/10.1038/s41598-020-62829-8 8www.nature.com/scientificreports/ www.nature.com/scientificreports
20. Ross, R. M. et al. Palmer LTER: Patterns of distribution of five dominant zooplankton species in the epipelagic zone west of the
Antarctic Peninsula, 1993–2004. Deep Sea Res. Part II Top. Stud. Oceanogr. 55, 2086–2105 (2008).
21. Atkinson, A. et al. Krill (Euphausia superba) distribution contracts southward during rapid regional warming. Nat. Clim. Change 1
(2019).
22. Słomska, A. W. et al. Historical abundance and distributions of Salpa thompsoni hot spots in the Southern Ocean, with projections
for further ocean warming. bioRxiv 496257 https://doi.org/10.1101/496257 (2018).
23. Słomska, A. W., Panasiuk-Chodnicka, A. A., Żmijewska, M. I. & Mańko, M. K. Variability of Salpa thompsoni population structure
in the Drake Passage in summer season 2010. Pol. Polar Res. 36, (2015).
24. Gales, N. et al. No evidence for a decline in the density of Antarctic krill Euphausia superba Dana, 1850, in the Southwest Atlantic
sector between 1976 and 2016. J. Crustac. Biol. 38, 656–661 (2018).
25. Ross, R. M. et al. Trends, cycles, interannual variability for three pelagic species west of the Antarctic Peninsula 1993-2008. Mar.
Ecol. Prog. Ser. 515, 11–32 (2014).
26. Kawaguchi, S., Siegel, V., Litvinov, F., Loeb, V. & Watkins, J. Salp distribution and size composition in the Atlantic sector of the
Southern Ocean. CCAMLR 2000 Surv. Multinatl. Multi-Ship Biol. Oceanogr. Surv. Atl. Sect. South. Ocean 51, 1369–1381 (2004).
27. Atkinson, A., Ward, P., Hunt, B., Pakhomov, E. & Hosie, G. An overview of Southern Ocean zooplankton data: abundance, biomass,
feeding and functional relationships. Ccamlr Sci. 19, 171–218 (2012).
28. Atkinson, A. et al. Fitting Euphausia superba into Southern Ocean food-web models: a review of data sources and their limitations.
Ccamlr Sci. 19, 219–245 (2012).
29. Henschke, N., Everett, J. D., Richardson, A. J. & Suthers, I. M. Rethinking the role of salps in the ocean. Trends Ecol. Evol. 31,
720–733 (2016).
30. Perissinotto, R. & Pakhomov, E. A. The trophic role of the tunicate Salpa thompsoni in the Antarctic marine ecosystem. J. Mar. Syst.
17, 361–374 (1998).
31. Alcaraz, M. et al. Antarctic zooplankton metabolism: carbon requirements and ammonium excretion of salps and crustacean
zooplankton in the vicinity of the Bransfield Strait during January 1994. J. Mar. Syst. 17, 347–359 (1998).
32. Whitehouse, M. J., Atkinson, A. & Rees, A. P. Close coupling between ammonium uptake by phytoplankton and excretion by
Antarctic krill, Euphausia superba. Deep Sea Res. Part Oceanogr. Res. Pap. 58, 725–732 (2011).
33. Ratnarajah, L. & Bowie, A. R. Nutrient cycling: are antarctic krill a previously overlooked source in the marine iron cycle? Curr. Biol.
26, R884–R887 (2016).
34. Ikeda, T. & Mitchell, A. Oxygen uptake, ammonia excretion and phosphate excretion by krill and other Antarctic zooplankton in
relation to their body size and chemical composition. Mar. Biol. 71, 283–298 (1982).
35. Biggs, D. C. Zooplankton excretion and NH 4 + cycling in near-surface waters of the Southern Ocean. I. Ross sea, austral summer
1977?1978. Polar Biol. 1, 55–67 (1982).
36. Arístegui, J., Duarte, C. M., Reche, I. & Gómez-Pinchetti, J. L. Krill Excretion Boosts Microbial Activity in the Southern Ocean. PLoS
One 9, e89391 (2014).
37. Coello-Camba, A., Llabrés, M., Duarte, C. M. & Agustí, S. Zooplankton excretion metabolites stimulate Southern Ocean
phytoplankton growth. Polar Biol. 40, 2035–2045 (2017).
38. Anderson, V. Salp and pyrosomid blooms and their importance in biogeochemical cycles. Biol. Pelagic Tunicates 125–137 (1998).
39. Pakhomov, E. A., Froneman, P. W. & Perissinotto, R. Salp/krill interactions in the Southern Ocean: spatial segregation and
implications for the carbon flux. Deep Sea Res. Part II Top. Stud. Oceanogr. 49, 1881–1907 (2002).
40. Tovar-Sanchez, A., Duarte, C. M., Hernández-León, S. & Sañudo-Wilhelmy, S. A. Krill as a central node for iron cycling in the
Southern Ocean. Geophys. Res. Lett. 32, L11601 (2007).
41. Alcaraz, M. et al. Changes in the C, N, and P cycles by the predicted salps-krill shift in the southern ocean. Front. Mar. Sci. 1, 45
(2014).
42. Cavan, E. L. et al. The importance of Antarctic krill in biogeochemical cycles. Nat. Commun. 10, 4742 (2019).
43. Iversen, M. H. et al. Sinkers or floaters? Contribution from salp pellets to the export flux during a large bloom event in the Southern
Ocean. Deep Sea Res. Part II Top. Stud. Oceanogr. 138, 116–125 (2017).
44. Ikeda, T. & Bruce, B. Metabolic activity and elemental composition of krill and other zooplankton from Prydz Bay, Antarctica,
during early summer (November–December). Mar. Biol. 92, 545–555 (1986).
45. Iguchi, N. & Ikeda, T. Metabolism and elemental composition of aggregate and solitary forms of Salpa thompsoni (Tunicata:
Thaliacea) in waters off the Antarctic Peninsula during austral summer 1999. J. Plankton Res. 26, 1025–1037 (2004).
46. Schneider, G. A comparison of carbon based ammonia excretion rates between gelatinous and non-gelatinous zooplankton:
Implications and consequences. Mar. Biol. 106, 219–225 (1990).
47. Andersen, T. & Hessen, D. O. Carbon, nitrogen, and phosphorus-content of fresh-water zooplankton. Limnol. Oceanogr. 36,
807–814 (1991).
48. Sterner, R. W., Elser, J. J. & Hessen, D. O. Stoichiometric relationships among producers, consumers and nutrient cycling in pelagic
ecosystems. Biogeochemistry 17, 49–67 (1992).
49. Elser, J. J. & Urabe, J. The stoichiometry of consumer-driven nutrient recycling: theory, observations, and consequences. Ecology 80,
735–751 (1999).
50. Sailley, S. F. et al. Carbon fluxes and pelagic ecosystem dynamics near two western Antarctic Peninsula Adélie penguin colonies: an
inverse model approach. Mar. Ecol. Prog. Ser. 492, 253–272 (2013).
51. Steinberg, D. Zooplankton collected with a 2-m, 700-um net towed from surface to 120 m, aboard Palmer Station Antarctica LTER
annual cruises off the western antarctic peninsula, 2009–2016. https://doi.org/10.6073/pasta/d9c0c2e783c38533b6001833bb0a6275
(2017).
52. Steinberg, D., Ross, R. & Quetin, L. Zooplankton collected aboard Palmer Station LTER annual cruises off the western antarctic
peninsula, 1993–2007. https://doi.org/10.6073/pasta/a24438b1ca700f42bdebc60b79882c49 (2017).
53. Ducklow, H., Vernet, M. & Prezelin, B. Dissolved inorganic nutrients including 5 macro nutrients: silicate, phosphate, nitrate, nitrite,
and ammonium from water column bottle samples collected during annual cruise along western Antarctic Peninsula, 1991–2018.
https://doi.org/10.6073/pasta/29e7035681f2496a78f097fd2fcb6ce0 (2019).
54. Dubischar, C. D., Pakhomov, E. & Bathmann, U. The tunicate Salpa thompsoni ecology in the Southern Ocean. II. Proximate and
elemental composition. Mar. Biol. 149, 625–632 (2006).
55. Atkinson, A. et al. Oceanic circumpolar habitats of Antarctic krill. Mar. Ecol. Prog. Ser. 362, 1–23 (2008).
56. Bates, D., Mächler, M., Bolker, B. & Walker, S. Fitting Linear Mixed-Effects Models Using lme4. J. Stat. Softw. 67, (2015).
57. Glibert, P. M., Kana, T. M. & Brown, K. From limitation to excess: the consequences of substrate excess and stoichiometry for
phytoplankton physiology, trophodynamics and biogeochemistry, and the implications for modeling. Adv. Mar. Ecosyst. Model. Res.
III 125, 14–28 (2013).
58. Welti, N. et al. Bridging Food Webs, Ecosystem Metabolism, and Biogeochemistry Using Ecological Stoichiometry Theory. Front.
Microbiol. 8, 1298 (2017).
59. Atkinson, C. L., Capps, K. A., Rugenski, A. T. & Vanni, M. J. Consumer-driven nutrient dynamics in freshwater ecosystems: from
individuals to ecosystems: Consumer-driven nutrient dynamics in freshwater ecosystems. Biol. Rev. 92, 2003–2023 (2017).
60. McClain, M. E. et al. Biogeochemical Hot Spots and Hot Moments at the Interface of Terrestrial and Aquatic Ecosystems. Ecosystems
6, 301–312 (2003).
Scientific Reports | (2020) 10:5911 | https://doi.org/10.1038/s41598-020-62829-8 9www.nature.com/scientificreports/ www.nature.com/scientificreports
61. Capps, K. A. & Flecker, A. S. Invasive Fishes Generate Biogeochemical Hotspots in a Nutrient-Limited System. Plos One 8, e54093
(2013).
62. Nasrollahzadeh, H. S., Din, Z. B., Foong, S. Y. & Makhlough, A. Spatial and temporal distribution of macronutrients and
phytoplankton before and after the invasion of the ctenophore, Mnemiopsis leidyi, in the Southern Caspian Sea. Chem. Ecol. 24,
233–246 (2008).
63. Henley, S. F. et al. Macronutrient supply, uptake and recycling in the coastal ocean of the west Antarctic Peninsula. Adv. Underst.
Mar. Syst. West Antarct. Penins. 139, 58–76 (2017).
64. Ducklow, H. et al. The marine system of the Western Antarctic Peninsula. Antarct. Ecosyst. Extreme Environ. Chang. World 121–159
(2012).
65. Serebrennikova, Y. M. & Fanning, K. A. Nutrients in the Southern Ocean GLOBEC region: variations, water circulation, and cycling.
Deep Sea Res. Part II Top. Stud. Oceanogr. 51, 1981–2002 (2004).
66. Klausmeier, C. A., Litchman, E., Daufresne, T. & Levin, S. A. Optimal nitrogen-to-phosphorus stoichiometry of phytoplankton.
Nature 429, 171–174 (2004).
67. Arrigo, K. R., Dunbar, R. B., Lizotte, M. P. & Robinson, D. H. Taxon-specific differences in C/P and N/P drawdown for phytoplankton
in the Ross Sea, Antarctica: phytoplankton in the ross sea, antarctica. Geophys. Res. Lett. 29, 44-1–44–4 (2002).
68. Lasbleiz, M. et al. Pigments, elemental composition (C, N, P, and Si), and stoichiometry of particulate matter in the naturally iron
fertilized region of Kerguelen in the Southern Ocean. Biogeosciences 11, 5931–5955 (2014).
69. Rembauville, M., Blain, S., Caparros, J. & Salter, I. Particulate matter stoichiometry driven by microplankton community structure
in summer in the Indian sector of the Southern Ocean. Limnol. Oceanogr. 61, 1301–1321 (2016).
70. Weber, T. S. & Deutsch, C. Ocean nutrient ratios governed by plankton biogeography. Nature 467, 550 (2010).
71. Annett, A. L. et al. Comparative roles of upwelling and glacial iron sources in Ryder Bay, coastal western Antarctic Peninsula. Mar.
Chem. 176, 21–33 (2015).
72. Sherrell, R. M., Annett, A. L., Fitzsimmons, J. N., Roccanova, V. J. & Meredith, M. P. A ‘shallow bathtub ring’ of local sedimentary
iron input maintains the Palmer Deep biological hotspot on the West Antarctic Peninsula shelf. Philos. Trans. R. Soc. Math. Phys.
Eng. Sci. 376, 20170171 (2018).
Acknowledgements
This study was funded by the Lower Saxony ministry of science and culture (MWK). We thank all members and
contributers of the Palmer LTER database for their contribution to the dataset especially Deborah Steinberg
(Zooplankton data) and Douglas Martinson (Physical Oceanography). Data from the Palmer LTER data
repository were supported by Office of Polar Programs, NSF Grants OPP-9011927, OPP-9632763 and OPP-
0217282. We further thank Douglas Martinson for the permission to use the Palmer grid figure from the Palmer
LTER database. We additionally thank all reviewers for their helpful comments on an earlier version of the
manuscript.
Author contributions
C.P., H.H. and S.M. contributed to the main manuscript text. C.P. and H.H. prepared the statistic, figures and
tables. All authors reviewed the manuscript.
Competing interests
The authors declare no competing interests.
Additional information
Supplementary information is available for this paper at https://doi.org/10.1038/s41598-020-62829-8.
Correspondence and requests for materials should be addressed to C.P.
Reprints and permissions information is available at www.nature.com/reprints.
Publisher’s note Springer Nature remains neutral with regard to jurisdictional claims in published maps and
institutional affiliations.
Open Access This article is licensed under a Creative Commons Attribution 4.0 International
License, which permits use, sharing, adaptation, distribution and reproduction in any medium or
format, as long as you give appropriate credit to the original author(s) and the source, provide a link to the Cre-
ative Commons license, and indicate if changes were made. The images or other third party material in this
article are included in the article’s Creative Commons license, unless indicated otherwise in a credit line to the
material. If material is not included in the article’s Creative Commons license and your intended use is not per-
mitted by statutory regulation or exceeds the permitted use, you will need to obtain permission directly from the
copyright holder. To view a copy of this license, visit http://creativecommons.org/licenses/by/4.0/.
© The Author(s) 2020
Scientific Reports | (2020) 10:5911 | https://doi.org/10.1038/s41598-020-62829-8 10You can also read