Semantic Information Extraction from Multi-Corpora Using Deep Learning
←
→
Page content transcription
If your browser does not render page correctly, please read the page content below
Computers, Materials & Continua                                                              Tech Science Press
DOI:10.32604/cmc.2022.021149
Article

   Semantic Information Extraction from Multi-Corpora Using Deep Learning
         Sunil Kumar1 , Hanumat G. Sastry1 , Venkatadri Marriboyina2 , Hammam Alshazly3, *
                      Sahar Ahmed Idris4 , Madhushi Verma5 and Manjit Kaur5

         1
          School of Computer Science, University of Petroleum and Energy Studies, Dehradun, 248001, India
              2
                Amity School of Engineering and Technology, Amity University, Gwalior, 474003, India
                3
                  Faculty of Computers and Information, South Valley University, Qena, 83523, Egypt
                    4
                      College of Industrial Engineering, King Khalid University, Abha, Saudi Arabia
          5
            Department of Computer Science Engineering, Bennett University, Greater Noida, 201310, India
                 *
                   Corresponding Author: Hammam Alshazly. Email: hammam.alshazly@sci.svu.edu.eg
                                      Received: 25 June 2021; Accepted: 30 July 2021

                 Abstract: Information extraction plays a vital role in natural language pro-
                 cessing, to extract named entities and events from unstructured data. Due to
                 the exponential data growth in the agricultural sector, extracting significant
                 information has become a challenging task. Though existing deep learning-
                 based techniques have been applied in smart agriculture for crop cultivation,
                 crop disease detection, weed removal, and yield production, still it is difficult
                 to find the semantics between extracted information due to unswerving effects
                 of weather, soil, pest, and fertilizer data. This paper consists of two parts.
                 An initial phase, which proposes a data preprocessing technique for removal
                 of ambiguity in input corpora, and the second phase proposes a novel deep
                 learning-based long short-term memory with rectification in Adam optimizer
                 and multilayer perceptron to find agricultural-based named entity recognition,
                 events, and relations between them. The proposed algorithm has been trained
                 and tested on four input corpora i.e., agriculture, weather, soil, and pest & fer-
                 tilizers. The experimental results have been compared with existing techniques
                 and it was observed that the proposed algorithm outperforms Weighted-SOM,
                 LSTM+RAO, PLR-DBN, KNN, and Naïve Bayes on standard parameters
                 like accuracy, sensitivity, and specificity.

                 Keywords: Agriculture; deep learning; information extraction; weather; soil

1 Introduction
      The agricultural sector contributes a major share to the Indian economy and due to climatic
changes, it is highly sensitive. For instance, some important factors like small landholdings, exces-
sive dependence on fertilizers and monsoons, add more vulnerabilities in the Indian agricultural
sector [1–3]. A large amount of unstructured agricultural data is underutilized due to the lack of
data processing schemes. In developing countries like India, still, human experts, and government
policies are the primary factors for decision-making. Factual validation based on current data is
still mislaid from the perspective of policymaking [4].

                     This work is licensed under a Creative Commons Attribution 4.0 International License,
                     which permits unrestricted use, distribution, and reproduction in any medium, provided
                     the original work is properly cited.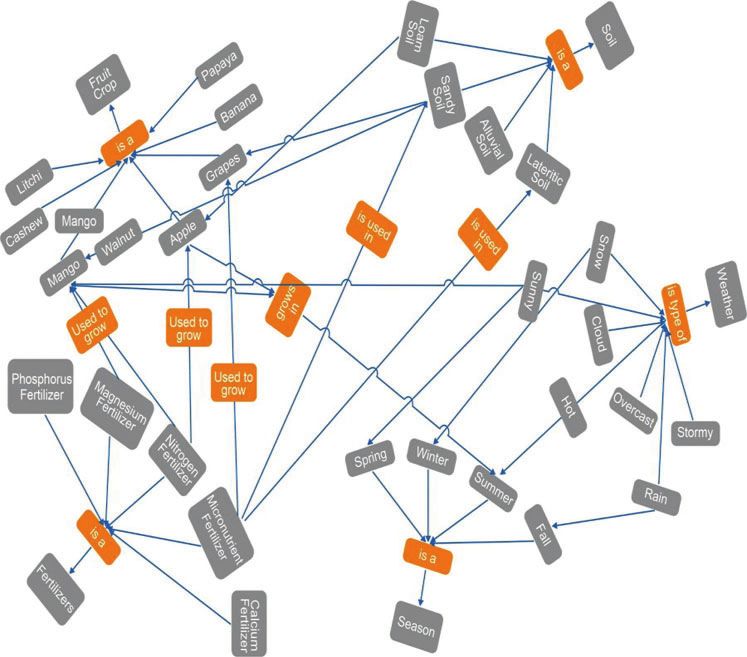
5022                                                                         CMC, 2022, vol.70, no.3

     In the last few decades, variability in climate has been affected in broad regions over
agricultural sectors like agricultural water resource, crop growth and development, and crop pro-
duction [5–8]. In the Indian subcontinent, the researchers study the climate-crop relationship based
on long-term fertility, regional statistics, and other predictable field experiments that shows the
yields of wheat and rice crop production model based on simulation methods [9]. The maximum
land in Uttarakhand state is fertile but due to land subdivision problems, the farmers consider the
agriculture sector as an infeasible source for gaining food security. The major crops of Uttarak-
hand are maize and rice known as Kharif/monsoon crops. The Kharif crop production is very less
in the Uttarakhand region when compared to other regions because of environmental conditions
like the constant threat of landslides, high rates of erosion, and landslides during rains. Crop
production is completely dependent on rain-based agricultural land. In the Uttarakhand state,
almost 80% of agricultural production is based on rain-fed-based agriculture [10]. The individual
growth in diverse agroecosystems with different hydro-geological regions and the diversity in
crops and cropping techniques define a high resilience system. The traditional crop rotations and
practices followed also help in maintaining the diversity which may vary with irrigation conditions,
altitude, soil type, moisture regime, local knowledge, and direction and degree of slope [11].
    For a suitable crop, the weather is not the only essential component, soil and fertilizers
are also equally contributing. However, the current machine learning methods such as Bayesian
networks, Gaussian kernel-based support vector machines (SVM), and artificial neural networks
(ANN) are unable to identify the suitable soil and pest and fertilizer for the selected soil [12,13].
Soil quality depends on Electrical Conductivity, pH level, macronutrients, and micronutrients of
the selected crop [14]. These soil quality indices help the farmers to select the appropriate pest
and fertilizer for the better yield of the selected crop.
     As per Fig. 1, inputs can be domain-dependent or independent unstructured/semi-structured
corpus (or corpora), domain-specific knowledge, and user-specified extraction patterns [15–17]. The
information extraction (IE) engine processes the input data to extract knowledge and save it into
a structured database (relational and graph databases). The researchers have proposed very limited
empirical and soft computing techniques for the prediction of rainfall for crop productivity along
with the appropriate land details of the Uttarakhand region. The proposed work bridges this gap
by extracting the semantics between extracted named entity recognition (NER) and events from
unstructured agricultural text with a focus on the Uttarakhand region [18].

                           Figure 1: Idea behind information extraction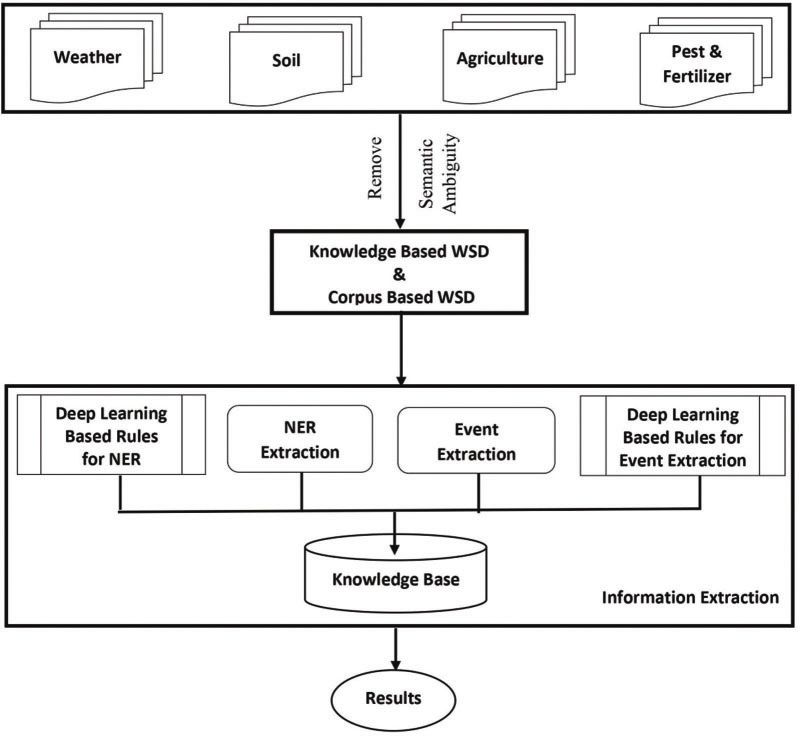
CMC, 2022, vol.70, no.3                                                                         5023

    The major contributions of the present research work are:
   (1) A novel deep learning technique for semantic information extraction using four input
       corpora (agriculture, weather, soil, and pest & fertilizer) was proposed. The proposed
       deep learning technique uses long short-term memory (LSTM) with two classifiers i.e.,
       rectification of Adam optimizer and multilayer perceptron (MLP).
   (2) To remove the noise from input corpora, a new word sense disambiguation (WSD)
       algorithm was introduced.
   (3) The proposed technique is able to predict the increase in crop intensity, crop yields, and
       the resulting increase in the employment of the Uttarakhand region.
    The remaining sections of current research work are as follows. Section 2 shows the survey
of recent technologies applied for IE to improve crop productivity. Section 3 depicts the proposed
methodology as well as the WSD algorithm.. The experimental results, discussion, and validation
of the proposed method are reported in Section 4. Section 5 concludes the paper and discusses
future work directions.

2 Literature Survey
     For the last two decades, machine and deep learning techniques have made a large contribu-
tion in handling the information extraction problem from various application areas including med-
ical image analysis and retrieval [19–23], biometrics recognition [24–26], disease diagnosis [27,28],
agriculture, etc. The following literature study shows the related work on the agricultural sector
using machine learning techniques.
     Nair et al. [29] have exhibited ANN in the Global Climate Model (GCM) in India. The goal
of the proposed method was to anticipate the Indian Summer Monsoon Rainfall esteems utilizing
precipitation yields from GCM. The ANN procedure was connected to different ensemble entities
from the GCMs individual to get month-wise scale expectations for India and its sub-divisional
region. In the present investigation, straight-forward randomization and double folded approval
method were used to minimize over-fitting problems while training the ANN method. The ANN
anticipated rainfall is executed from GCMs individuals and decided by examining the absolute
error, box plots, contrast, and percentile in linear error in probability sample space. Experimental
results proposed the critical changes after applying the ANN system of these GCMs individuals
in forecast expertise. The datasets depend on the past estimations of the primary variable however
not on logical factors which may influence the framework/variable.
     Satir et al. [30] proposed a Stepwise Linear Regression and vegetation indices method for
crop yield estimation. By applying object-based classification and multi-temporal land-sat data
set, mapping was formed on related crop patterns of an area. In this scenario, by applying real-
time measurement methods like Mean Percent Error (MPE) prediction was estimated. MPE was
estimated for cotton, corn & wheat and combined with soil salinity degrees. Based on weather
data forecasting was done and prediction of accuracy was reduced based on a single parameter.
     Das et al. [31] investigated the hybrid algorithms such as Least Absolute Shrinkage and Selec-
tion Operator (LASSO), ANN, penalized regression models consists of the elastic net (ENET),
Principal Components Analysis (PCA), and Stepwise Multiple-Linear Regression (SMLR) for
predicting the yield of rice with the help of long-term weather data. The experimental results
stated that LASSO-ENET provided good performance because these methods reduced the model
complexity and prevented overfitting by using magnitude coefficients. The pairwise multiple com-
parison test found that the hybrid models were utilized very well for the prediction of the crop on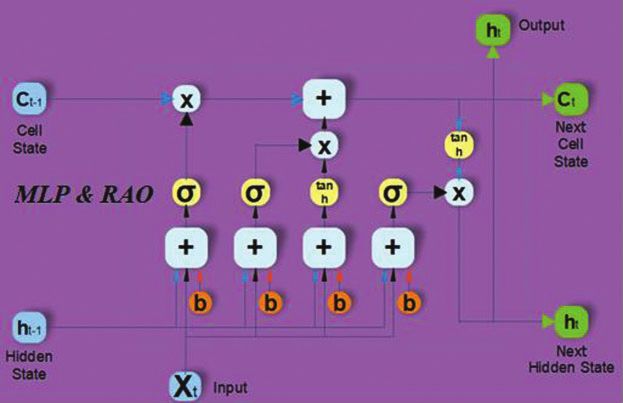
5024                                                                          CMC, 2022, vol.70, no.3

the west coast of India. But, the combination of feature selection methods and feature extraction
with neural network include PCA-SMLR provides poor performance because that PCA did not
include the dependent variable while alteration of input variables.
     He et al. [32] implemented a Hybrid Wavelet-based Neural Network (HWNN) which included
Particle Swarm Optimization (PSO), Mutual Information, and Multi-Resolution Analysis into
ANN for predicting rainfall from antecedent climate indices and monthly rainfall. The Maximal
Overlap Discrete Wavelet Transform decomposed the large-scale climate indices and standardized
monthly rainfall anomaly into subseries components with various time scales. The PSO algorithm
was applied to find the optimal neuron numbers in ANN’s layers (hidden) and the predictor
(selected) predicted anomaly sub-series for each rainfall. HWNN method was more efficient for
particular season rainfall prediction but took high prediction time in different season rainfall
prediction.
      Mohan et al. [33] implemented parallel layer regression with Deep Belief Network (PLR-
DBN) for the estimation of food crop productivity using factors such as season types, soil type,
risk factor, and water availability. The proposed PLR-DBN method targeted five crops in Kar-
nataka based on accuracy, sensitivity, and specificity. Talukder et al. [34] designed a prediction and
recommendation technique that determines food crop productivity based on temperature, rainfall,
and humidity parameters. K-nearest neighbor (KNN), random forest, SVM, logistic regression,
Naïve Bayes classifier were used for the prediction model. Collaborative and multi-condition
filtering techniques are used for the recommendation system.
     To improve the overall crop productivity, this paper developed a deep learning-based method
for the Uttarakhand data, weather data from Indian Metrological Department (IMD), Dehradun
whereas the soil, and pest and fertilizer corpora are open source databases.

3 Proposed Method
3.1 Study Area and Dataset Description
    Uttarakhand is a state in the northern part of India that spreads from 79◦ 15’ east longitude
to 30◦ 15’ north latitude with 53,483 square km geographical area. This state was taken as the
area of study for our research work. The Uttarakhand state i.e., the Garhwal region comprises
Chamoli, Dehradun, Pauri, Uttarkashi, Rudraprayag, Tehri, Haridwar, and the Kumaon region
with Almora, Bageshwar, Nainital, Pithoragarh, Champawat and Udham Singh Nagar districts.
For modeling rainfall-runoff events, the entire region has been considered for the study so that
almost the whole state area can be covered. Data from various data sources like IMD, soil, and
pest & fertilizer corpora were gathered from various research organizations such as District Soil
Testing Laboratory, Dehradun/Soil Testing Laboratories located at Nanda ki Chowki, Premises of
Directorate of Agriculture, Premnagar, Dehradun, and a database has been created.

3.2 Proposed Methodology
    The next five subsections include the proposed framework, min-max algorithm applied
for data preprocessing, corpora concatenation techniques, proposed WSD algorithm, and deep
learning-based IE algorithm.

3.2.1 Proposed Framework for Semantic IE
     The research framework presents a theoretical and practical approach for extracting semantic
information. Unlike few existing frameworks in literature, this approach attempts to give a struc-
ture that highlights the fundamental concepts and components of semantic IE. The methodology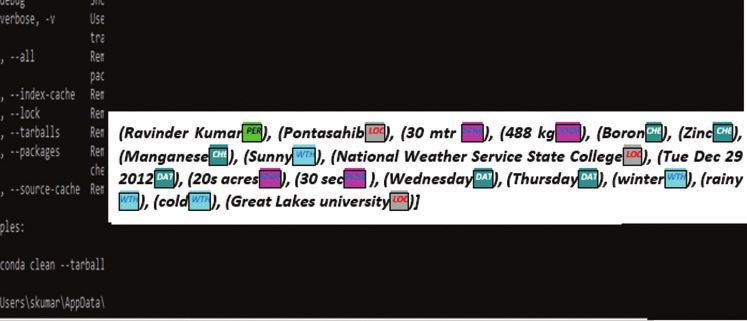
CMC, 2022, vol.70, no.3                                                                      5025

followed in this study is composed of a collection of articles in the selected areas, collection
of authenticating data in those relevant fields (mostly the benchmark datasets from repositories)
selection of appropriate data mining tools, data storage tools (Excel, Oracle), and editing tools.
    In this section, the operational framework is elaborated for presenting the complete flow of
the research components carried out for this study. This study mainly spins around information
gathering, data pre-processing, semantic extraction, and data post-processing. These four core
or concentrated parts are involved in the practical implementations of this framework. Fig. 2
shows the overall view of the present research, wherein the framework has been divided into
four different modules including corpus concatenation, deep network-based NER and EE, and
Semantic Extraction.

        Figure 2: Proposed framework for agricultural IE using deep learning technique

3.2.2 Min-Max Algorithm
     This subsection is used for preprocessing the input corpora i.e., removal of noises and iden-
tifying missing values. The input data are taken from the database and data consists of different
kinds of units like temperature in celsius, wind speed in miles per hour, etc. In deep learning
architecture, to avoid the scaling effects, normalized variables between intervals [0–1] has been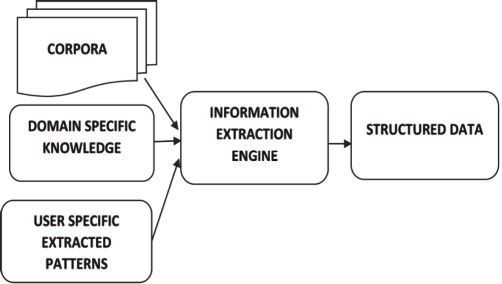
5026                                                                       CMC, 2022, vol.70, no.3

used in the proposed method. The normalization method applied to the dataset can be observed
in Eq. (1),
           (ai − minai )
Vali =                    (new_maxai − new_minai ) + new_minai                                 (1)
         (maxai − minai )

where ai denotes a normalized value for the ith variable, for this variable minai denotes the
minimum value registered in the training dataset and for the same variable, the maximum value
in the training dataset represented by maxai .

3.2.3 Corpora Concatenation
     The previous subsection used a min-max algorithm to minimize the noises from input cor-
pora and these unstructured input corpora are converted into a single unified corpus. As the
nature of these corpora is different, merging the corpora required maximum human intervention.
Knowledge-based WSD (KB-WSD) and corpus-based WSD (CB-WSD) are two basic methods
used for combining two or more corpora into a single entity. The main purpose behind the inte-
gration of these two popular algorithms was to remove semantic ambiguity and merge different
natured corpora into a single entity i.e., called Agri_Corpus. The integration of CB-WSD into
a KB-WSD successfully has shown a low improvement rate in many cases. So, for the current
research work, the integration of KB-WSD into a CB-WSD has been used in the proposed model
and the same will be discussed in the next section.
    The agricultural data has been collected from Krishi Vigyan Kendra, Dhakrani, District
Dehradun, Uttarakhand. (http://agricoop.nic.in/sites/default/files/UKD7-Dehradun-10.07.14.pdf ).
Tab. 1 shows the sample data for rainfall prediction to improve the crop productivity of the
Uttarakhand region.

              Table 1: Sample data for major crop productivity for Uttarakhand region
Season                             Major crops         Area (in ‘000 ha)     Productivity (kg/ha)
Rain (June–December)               Rice                11.4                  19689.9
Winter (January–March)             Barley              0.7                   19.57
Summer (April–May)                 Potato              0.668                 22140

     Tab. 1 describes the sample data collected for major crop productivity of Uttarakhand like
rice, barley, and potato. The rice crop gives more productivity like 19689.9 kg per hectares (ha)
during rainfall season, whereas barley gives nearly 20 kg per ha for the winter season. Rice has
been considered the most important crop for Uttarakhand because of its productivity. Potato
can be cultivated during the summer season, which has productivity of 22140 kg per ha. In the
Uttarakhand region, the crops like rice, barley, and potatoes are majorly sown at low, medium,
and high rainfall respectively. Tab. 2 shows the sample data for monthly average rainfall data of
one year.
CMC, 2022, vol.70, no.3 5027
Table 2: Sample rainfall data of Uttarakhand region related to rice and barley crops
Samples Cloud Min. Avrg. Max. Vapor Rainfall Actual Predicted Crop_- Crop_-
data cover temp. temp. temp. pressure value values Expert Pre-
dicted
0 10.063 16.626 21.756 26.898 18.923 0 0 0 Rice Rice
1 14.538 19.608 24.733 29.874 21.37 0 0 0 Rice Rice
2 16.185 17.775 22.939 28.104 19.629 0.1 0 0 Rice Rice
3 16.632 17.444 22.773 28.164 19.583 0.2 0 0 Rice Rice
4 18.407 17.461 22.59 27.732 18.534 0 0 0 Rice Rice
5 11.62 17.208 22.283 27.385 19.127 1.5 0 0 Rice Rice
6 23.886 19.117 24.102 29.134 20.185 9.1 0 0 Rice Rice
7 24.425 19.289 24.419 29.56 20.185 0.6 0 0 Rice Rice
8 16.652 19.89 25.028 30.17 21.19 0.5 0 0 Rice Rice
9 19.057 18.712 23.502 28.309 19.952 16 0 1 Rice Barley
10 18.166 19.034 24.135 29.26 20.628 1.6 0 0 Rice Rice
11 17.932 18.951 24.073 29.214 20.185 0.1 0 0 Rice Rice
12 17.932 19.644 24.781 29.921 21.312 5.7 0 0 Rice Rice
The data collected for nearly 20 years are taken from the region, the rainfall values can be
calculated by using the predicted values from the sample table. The values 0 in the predicted
column indicate low rainfall, whereas 1 indicates medium rainfall, and 2 represents high rainfall.
3.2.4 Proposed Disambiguation Algorithm
Before applying the natural language processing technique, input data should be processed
using a disambiguation algorithm. Few existing methods can be used to extract the sense of
ambiguous words from an unstructured text [35]. The proposed algorithm was used to extract the
sense of ambiguous words present in the corpus collected for current research. Cosine similarity
has been used to measure the similarity between two words and cosine distance to find the
similarity distance between two words [36].
n
i=1 Wi .Si
Sim(Wi , Si ) = (2)
n 2∗ n 2
i=1 W i S
i=1 i
D_amb(Wi , Si ) = 1 − Cosine(Wi , Si ) (3)
Eqs. (2) and (3) represent the cosine similarity and cosine distance between two words (Wi
and Si ) and have been defined as Sim(Wi , Si ) and D_amb (Wi , Si ) respectively. The range of
cosine distance is between 0 to 1, where 1 represents Wi and Si are different in nature and 0 (≈0)
represents that Wi is associated with Si [37].5028 CMC, 2022, vol.70, no.3
Algorithm 1: Extract senses from ambiguous word
1. ∀ word Wj ∃ a sense Si
a. do: n
W .S
b. Calculate Sim(Wi , Si ) = n i=1 i i n
i=1 Wi ∗
2 2
i=1 Si
c. Calculate D_amb (Wi , Si ) = 1 − Cosine(Wi , Si )
d. If D_amb ≈0 then assign similarity S to W
e. End
2. Sense: = Sen1
3. ∀ ambiguous word calculate sense
a. do:
b. If D_amb(Wj , Si ) > D_amb (Wj , Sen1)
c. Assign Sense = Si
d. End
4. Assign calculate sense Si to ambiguous word Wj.
3.2.5 Proposed Algorithm for Semantic IE Using LSTM-RAO and MLP
The following algorithm uses the min-max algorithm for data normalization, which has the
advantages of the LSTM techniques. For each iteration of backpropagation, an RAO and MLP
are applied to modify the weights in a deep network. This optimizer has inherited the properties
of RMSProp and AdaGard optimizer.
Algorithm 2: LSTM based Algorithm with rectification in Adam optimizer and MLP
1. Class LSTM-RAO [_Agri_Corpus, _weights, _biases]
2. Summarize the input corpus state-wise and pick Uttarakhand state data
3. Agriculture data processed by state and season name
4. DB = {ai, Yn |i ∈ I and n ∈ N} //Database with N features and I instances
(a −minai )
5. ai = (maxi a −min ai )
(new_maxai − new_minai ) + new_minai
i
//data preprocessing technique for obtaining range of [−1 to 1]/[0 to 1]
6. Atrain, Atest , Btrain, Btest ← training_testing_split(Agri_Corpus_data_processed, test_size = 0.3)
// dividing input corpus into training and testing data for the proposed model
7. def model:
while ωT = converged do
8. M0 , V0 ← 0,0 //initialization of first and second moment
9. ρ∞ ← (1−∝) 2
−1
10. while T = 1,. . .,t do
a. Gt ← ∇ω fT (ωT−1 )
b. VT = ε2 VT−1 + (1 − ε2 )GT2 //Update exponential moving 2nd moment
c. MT = ε1 MT−1 + (1 − ε1 )GT //Update exponential moving 1st moment
d. M̂ ← MT T //Compute bias-corrected moving average
1− ∝1
∝T
e. ρT ← ρ∞ − 2T 2
//Compute the length of the approximated SMA
(1−∝T2)
(Continued)CMC, 2022, vol.70, no.3 5029
f. if the variance
is tractable, i.e., ρt > 4 then
VT
i. V̂ ← //Compute bias-corrected moving 2nd moment
(1− VT )
2
((ρ(T−4) )(ρ(T−2) )(ρ∞ ))
ii. RT ← ((ρ )(ρ )(ρ ))
(∞−4) (∞−2) T
iii. ωT ← ωT−1 − ∝T RT M̂
VT
T
//Update parameters with adaptive momentum
g. else
h. ωT ← ωT−1 − ∝T M̂T
End while
Return; Resulting parameter ωT
3.2.6 LSTM with RAO and MLP
This section represents the algorithm of the proposed deep learning technique comprising of
the following architecture (i.e., an LSTM), which has been used as a feature selection method
and responsible for treatment in time series. Whereas, MLP network and rectified Adam optimizer
(RAO) have been used for classification as well as prediction tasks. Fig. 3 represents the LSTM
with RAO and MLP based deep learning network [38].
Figure 3: Deep learning-based architecture of the proposed model
The proposed model can be divided into two parts namely feature selection and classification.
In this network, hyperbolic tangent transfer (tansig) activation function has been used in the deep
hidden layers and sigmoid (sig) activation function has been used to increase the correlation within
the target data. The following activation functions are used in the hidden layers and have been
stated in Eq. (4).
Tansig(n) = (2/(1 + e−2n )) − 1 (4)
As per Eq. (5), each number in the cell state Ct-1 , the f t = [0–1]
f gt = σ (Wfg [hT−1 , XT ]) + bfg (5)5030 CMC, 2022, vol.70, no.3
In the forget gate, Wfg and bfg represent the weight, and bias of the forget gate. From input
Xt , the sigmoid layer and tanh layer have been used to store, update, and decide the cell state.
In Eq. (6), the updated information should either ignore or get updated based on the value
of the sigmoid function (0,1) and (−1 to 1) of tanh function decides the importance level in
Eq. (7). Multiplication of NT and iT has been performed to update the new cell state in the LSTM
network. This new memory cell value is then added to the last memory value i.e., CT−1 to find
an updated CT as shown in Eq. (8)
iT = σ (Wig [hT−1 , XT ]) + big (6)
NT = tanh(Wn [hT−1 , XT ]) + bn (7)
CT = [CT−1 fT ] + NT iT (8)
In the next step, the output value (hT ) is derived from the output (OT ) of the cell state. In
Eq. (9) sigmoid function picks that cell state which takes part in the output, then the sigmoid
gate output (OT ) is multiplied by the new cell state (CT ) values and hT is used for tanh layer [−1
to 1] in Eq. (10).
OT = σ (Wog [hT−1 , XT ]) + bT (9)
hT = OT tanh( CT ) (10)
Like RMSprop and Adadelta, Adam optimizer can be used to save an exponentially decaying
average of the last gradient MT and squared gradient (VT ) in Eqs. (11)–(13). At time T, the
stochastic object for finding gradients (GT ) is:
Gt ← ∇ω fT (ωT−1 ) (11)
MT = ε1 MT−1 + (1 − ε1 )GT (12)
VT = ε2 VT−1 + (1 − ε2 )GT2 (13)
Here MT and VT represent the 1st and 2nd gradient moment that is the mean and uncentered
variance. The biasing ≈ zero have been noticed especially during the initial time T and ε1 & ε2
(small delay) ≈ 1. Eqs. (14) and (15) are used to calculate the biases offset which are defined by
evaluating the bias-corrected first and second-moment estimates.
MT
MTnew = (14)
1 − ε1T
VT
VTnew = (15)
1 − ε2TCMC, 2022, vol.70, no.3 5031
The updated parameters in Adam with the combination of Adadelta and RMSprop optimizer
have been shown in Eq. (16)
ϕ
ωT+1 = ωT − √ MTnew (16)
V new +
4 Performance Evaluation
For the scenario experimental simulation, Python Jupyter notebook was installed in the
computer system with a 3.2 GHz Core i5 processor. The proposed WSD algorithm has been
applied to the following small paragraph (next complete paragraph). For a single word, there are
various meanings (sense). To demonstrate the proposed algorithm, the following paragraph was
used as input
“Ginger is a medicinal plant. There is not a particular period to sow this plant but the pre-monsoon
shower session is considered a better period. It is considered a Kharif crop. One month of dry
weather before harvesting ginger gives better results”.
Tab. 3 represented the output in a tabular form. The term “session” is related to the period
of activity, a serious meeting, and a weather session. By applying the disambiguation algorithm,
the word ‘session’ was related to a weather session only. The output of the proposed algorithm
has been presented in tabular form.
Table 3: Output of the proposed disambiguation algorithm
S. No Ambiguous word Existed senses Extracted sense
1 Plant Factory Tree
Tree
2 Sow Female pig Seed
Seed
3 Crop Grain Grain
No. of people
4 Dry Boing Rain
Not sweet
Rain
5 Session Period of activity Weather
Weather
A series of meeting
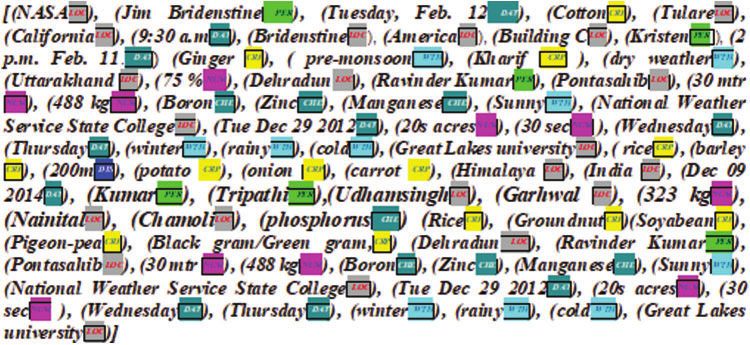
Figs. 4 and 5 depict the output of the proposed deep learning algorithm for NER. Each
extracted named entity has a specific tag attached to it. These tags have helped us to extract the
events that are related to these named entities.5032 CMC, 2022, vol.70, no.3
Figure 4: Output-1 of agricultural-based named entity extraction
Figure 5: Output-2 of agricultural-based named entity extraction
Fig. 6 shows the other output of the proposed deep learning-based agricultural-based event
extraction. In the next phase, the proposed deep learning method has been applied on the
unstructured unified corpus to extract agricultural-based NER, events, and relationship that can
be used to predict the major crop productivity in the Uttarakhand region. For finding better crop
production, the main factors like soil, season, water, input support facilities, and risk were used.
Some other observations include Mean Squared Error was 0.065, Root Mean Squared Error was
0.25, Mean Absolute Error was 0.065, and Nash-Sutcliffe efficiency coefficient was 0.99.
4.1 Parameter Metrics
In this study, the performance of the proposed method was assessed using standard sta-
tistical performance evaluation criteria which included the accuracy, sensitivity, specificity, and
F-Measures. The following Tab. 4 provides the value for accuracy, F-measure, sensitivity, specificity
for major crops of the Uttarakhand Region.CMC, 2022, vol.70, no.3 5033
Figure 6: Output of the proposed deep learning-based agricultural-based event extraction
Table 4: Performance evaluation of the proposed method
Crops Accuracy (%) F-score (%) Specificity (%) Sensitivity (%)
Rice 95.55 93.37 96.65 94.25
Barley 92.45 93.35 97.12 94.54
Potato 76.30 79.29 65.37 72.15
4.2 Comparative Analysis
This section provides a detailed description of the performance of the proposed method. The
comparison of the proposed method has been presented with the cross-validation of 80% training
and 20% testing data. The cross-validation of the proposed method was also analyzed for 70–30%
and 60–40% training-testing data. Fig. 7 shows the accuracy of the proposed method with respect
to ANN, recurrent neural network (RNN), LSTM with Adam optimizer, and LSTM with rectified
Adam optimizer.
Similarly, Fig. 8 shows the comparison of the proposed method with respect to ANN, RNN,
LSTM with Adam optimizer, and LSTM with rectified Adam optimizer in terms of precision,
recall, and F-score parameters.5034 CMC, 2022, vol.70, no.3
Accuracy
90 88.1
84.93 86.56
85 82.23
80
74.35
75
70
65
ANN RNN LSTM+Adam LSTM+RAO Proposed
Figure 7: Accuracy of the proposed method
Precision, Recall and F-score
100
85.61 83.67 87.21 86.98
90 82.37 81.72 71.69 82.78
80 74.82 88.67
82.81 69.76
70 84.52
76.91
60 70.18
50
40
30
20
10
0
ANN RNN LSTM+RNN LSTM+RAO Proposed Method
Precision Recall F-Score
Figure 8: Comparative analysis of proposed method with ANN, RNN, LSTM +Adam, and
LSTM +RAO
Fig. 9 shows the performance of the proposed method for the crop yield in terms of accuracy,
F-measure, specificity, and sensitivity.
Performance Metrics
120
93.35 96.65 97.12
95.55 92.45 93.37 94.25 94.54
100
76.3 79.29
80 72.15
65.37
60
40
20
0
Accuracy F-Measure Specificity Sensitivity
Rice Barley Potato
Figure 9: Performance of the proposed method in crop yield prediction
As mentioned in Tab. 5, the proposed method with existing techniques such as deep learning-
based weighted self-organizing map (DL-SOM) [39], LSTM+RAO [40], PLR-DBN, KNN, and
Naïve Bayes techniques were evaluated in the combinations of testing and training percentages
like 80% training and 20% testing dataset for rice, barley, and potato.CMC, 2022, vol.70, no.3 5035
Table 5: Comparison of existing methods with the proposed method
Methodology Accuracy Sensitivity Specificity
Weighted SOM 78.98 83.05 81.45
LSTM+RAO 86.56 83.67 84.1
PLR-DBN 87.78 86.19 80.43
KNN 64.00 60.00 61.00
Naïve Bayes 72.00 60.00 58.00
Proposed Method 88.10 86.98 86.38
5 Conclusion and Future Directions
The proposed methods have presented a statistical investigation of the rainfall, soil, agri-
culture, and pest and fertilizer dataset for the Uttarakhand region. The scope of the proposed
experiment was to extract the agricultural-based NER, events, and the relationship between them.
The stated method can be used to enhance the productivity of the major crops like rice, barley,
and potato in high rainfall areas of Uttarakhand state by investigating the accurate rainfall
required for a good quantity of crop prediction with better soil quality. In this context, a deep
learning method was implemented to predict the suitable major crop for the season in Uttarak-
hand Region, India. The output thus generated using the introduced method shows a better
performance than existing methods. An accuracy of 88.10% was achieved by properly utilizing
the LSTM with RAO and MLP optimizers. The experimental results were compared with the
DL-SOM, LSTM+RAO, PLR-DBN, KNN & Naïve Bayes and it was observed that the proposed
algorithm outperforms the existing ones with 1.09%, 1.32%, 1.0%, 1.37% and 1.22 in terms of
accuracy, 1.09%, 1.01%, 1.0%, 1.44% and 1.44% on sensitivity, and 1.11%, 1.0%, 1.07, 1.41 &
1.49% on specificity as compared to DL-SOM, LSTM+RAO, PLR-DBN, KNN and Naïve Bayes
respectively. The value of the Nash-Sutcliffe efficiency coefficient was 0.99. The advanced scheme
delivered an effective performance in the form of improved sensitivity, accuracy, specificity, and
F-score than the previous methods related to the other approaches available for crop prediction.
To improve agriculture productivity plant deceases dataset can take into consideration for future
work. The experimental results show that there is a huge scope for researchers to focus on potato
crops productivity in hilly areas.
Acknowledgement: The authors extend their appreciation to the Deanship of Scientific Research
at King Khalid University for funding this work. The first and second authors are thankful to
the University of Petroleum and Energy Studies, Dehradun, India for sharing a platform to work
with international collaborations.
Funding Statement: This work was supported by the Deanship of Scientific Research at King
Khalid University through a General Research Project under Grant Number GRP/41/42.
Conflicts of Interest: The authors declare that they have no conflicts of interest to report regarding
the present study.5036 CMC, 2022, vol.70, no.3
References
[1] R. K. Mall, R. Singh, A. Gupta, G. Srinivasan and L. S. Rathore, “Impact of climate change on
Indian agriculture: A review,” Climatic Change, vol. 78, no. 2, pp. 445–478, 2006.
[2] S. A. Khan, S. Kumar, M. Z. Hussain and N. Kalra, “Climate change, climate variability
and Indian agriculture: Impacts vulnerability and adaptation strategies,” in Climate Change and
Crops, Environmental Science and Engineering, Berlin, Heidelberg: Springer, pp. 19–38, 2009.
https://doi.org/10.1007/978-3-540-88246-6_2.
[3] A. Tuli, N. Hasteer, M. Sharma and A. Bansal, “Framework to leverage cloud for the modernization
of the Indian agriculture system,” in Proc. ICEIT, Milwaukee, WI, USA, pp. 109–115, 2014.
[4] V. Gouri and M. Uddin, “An empirical study of big data analytics in rural arena,” International Journal
of Social Sciences & Educational Studies, vol. 5, no. 3, pp. 192–206, 2019.
[5] D. B. Lobell and G. P. Asner, “Climate and management contributions to recent trends in U. S.
agricultural yields,” Science, vol. 299, no. 5609, pp. 1032–1032, 2003.
[6] S. Peng, J. Huang, J. E. Sheehy, R. C. Laza, R. M. Visperas et al., “Rice yields decline with higher
night temperature from global warming,” in Proceedings of the National Academy of Sciences, vol. 101,
no. 27, pp. 9971–9975, 2004.
[7] F. Tao, M. Yokozawa, J. Liu and Z. Zhang, “Climate–crop yield relationships at provincial scales in
China and the impacts of recent climate trends,” Climate Research, vol. 38, no. 1, pp. 83–94, 2008.
[8] F. Tao, M. Yokozawa, Y. Xu, Y. Hayashi and Z. Zhang, “Climate changes and trends in phenology
and yields of field crops in China, 1981–2000,” Agricultural and Forest Meteorology, vol. 138, no. 1–4,
pp. 82–92, 2006.
[9] S. Piao, P. Ciais, Y. Huang, Z. Shen, S. Peng et al., “The impacts of climate change on water resources
and agriculture in China,” Nature, vol. 467, no. 7311, pp. 43–51, 2010.
[10] N. B. Mishra and G. Chaudhuri, “Spatio-temporal analysis of trends in seasonal vegetation pro-
ductivity across Uttarakhand, Indian Himalayas, 2000–2014,” Applied Geography, vol. 56, pp. 29–41,
2015.
[11] M. Chauhan, “A perspective on watershed development in the central himalayan state of Uttarakhand,
India,” International Journal of Ecology and Environmental Sciences, vol. 36, no. 4, pp. 253–269, 2010.
[12] S. S. Keerthi and C.-J. Lin, “Asymptotic behaviors of support vector machines with Gaussian kernel,”
Neural Computation, vol. 15, no. 7, pp. 1667–1689, 2003.
[13] C. Notarnicola, M. Angiulli and F. Posa, “Soil moisture retrieval from remotely sensed data: Neural
network approach versus Bayesian method,” IEEE Transactions on Geoscience and Remote Sensing,
vol. 46, no. 2, pp. 547–557, 2008.
[14] L. Dongming, L. Yan, Y. Chao, L. Chaoran, L. Huan et al., “The application of decision tree C4. 5
algorithm to soil quality grade forecasting model,” in Proc. of ICCCI, Wuhan, China, pp. 552—555,
2016.
[15] D. E. Johnson and T. Hampp-Bahnmueller, “Architecture of a framework for information extraction
from natural language documents,” U.S. Patent 6,553,385, pp. 22 April 2003.
[16] M. Kaur and D. Singh, “Multi-modality medical image fusion technique using multi-objective differ-
ential evolution based deep neural networks,” Journal of Ambient Intelligence and Humanized Computing,
vol. 12, no. 2, pp. 2483–2493, 2021.
[17] H. S. Pannu, D. Singh and A. K. Malhi, “Improved particle swarm optimization based adaptive neuro-
fuzzy inference system for benzene detection,” CLEAN–Soil, Air,” Water, vol. 46, no. 5, pp. 1700162,
2018.
[18] T. R. Gruber, “Toward principles for the design of ontologies used for knowledge sharing?,” Interna-
tional Journal of Human-Computer Studies, vol. 43, no. 5–6, pp. 907–928, 1995.
[19] A. H. Khan, M. Hussain and M. K. Malik, “Cardiac disorder classification by electrocardiogram
sensing using deep neural network,” Complexity, 2021. https://doi.org/10.1155/2021/5512243.CMC, 2022, vol.70, no.3 5037
[20] H. Alshazly, C. Linse, M. Abdalla, E. Barth and T. Martinetz, “COVID-Nets: Deep CNN architectures
for detecting COVID-19 using chest CT scans,” PeerJ Computer Science, vol. 7, pp. e655, 2021.
https://doi.org/10.7717/peerj-cs.655.
[21] A. H. Khan, M. Hussain and M. K. Malik, “Arrhythmia classification techniques using deep neural
network,” Complexity, 2021. https://doi.org/10.1155/2021/9919588.
[22] H. Alshazly, C. Linse, E. Barth and T. Martinetz, “Explainable covid-19 detection using chest ct scans
and deep learning,” Sensors, vol. 21, no. 2, pp. 455, 2021.
[23] Ş. Öztürk, “Stacked auto-encoder based tagging with deep features for content-based medical image
retrieval,” Expert Systems with Applications, vol. 161, pp. 113693, 2020.
[24] H. Alshazly, C. Linse, E. Barth and T. Martinetz, “Handcrafted versus CNN features for Ear
recognition,” Symmetry, vol. 11, no. 12, pp. 1493, 2019.
[25] H. Alshazly, C. Linse, E. Barth and T. Martinetz, “Deep convolutional neural networks for uncon-
strained ear recognition,” IEEE Access, vol. 8, pp. 170295–170310, 2020.
[26] H. Alshazly, C. Linse, E. Barth and T. Martinetz, “Ensembles of deep learning models and transfer
learning for ear recognition,” Sensors, vol. 19, no. 19, pp. 4139, 2019.
[27] Ş. Öztürk and U. Özkaya, “Residual LSTM layered CNN for classification of gastrointestinal tract
diseases,” Journal of Biomedical Informatics, vol. 113, pp. 103638, 2021.
[28] Ş. Öztürk and U. Özkaya, “Gastrointestinal tract classification using improved LSTM based CNN,”
Multimedia Tools and Applications, vol. 79, no. 39, pp. 28825–28840, 2020.
[29] A. Nair, G. Singh and U. C. Mohanty, “Prediction of monthly summer monsoon rainfall using global
climate models through artificial neural network technique,” Pure and Applied Geophysics, vol. 175,
no. 1, pp. 403–419, 2018.
[30] O. Satir and S. Berberoglu, “Crop yield prediction under soil salinity using satellite-derived vegetation
indices,” Field Crops Research, vol. 192, pp. 134–143, 2016.
[31] B. Das, B. Nair, V. K. Reddy and P. Venkatesh, “Evaluation of multiple linear, neural network and
penalised regression models for prediction of rice yield based on weather parameters for west coast of
India,” International Journal of Biometeorology, vol. 62, no. 10, pp. 1809–1822, 2018.
[32] X. He, H. Guan and J. Qin, “A hybrid wavelet neural network model with mutual information and
particle swarm optimization for forecasting monthly rainfall,” Journal of Hydrology, vol. 527, pp. 88–
100, 2015.
[33] P. Mohan and K. K. Patil, “Crop production rate estimation using parallel layer regression with deep
belief network,” in Proc. of ICEECCOT, Mysuru, India, 2017.
[34] S. Talukder, H. Jannat, K. Sengupta, S. Saha and M. I. Hossain, “Enhancing crops production based
on environmental status using machine learning techniques,” in Proc. of ICOSICA, Bogor, Indonesia,
2020.
[35] I. Ghanimi, E. Benlahmar, A. Tragha and F. Ghanimi, “A word embedding based approach for word
sense disambiguation,” International Journal of Advanced Science and Technology, vol. 28, no. 16, pp.
144–153, 2019.
[36] L. Muflikhah and B. Baharudin, “Document clustering using concept space and cosine similarity
measurement,” in Proc. of the Int. Conference on Computer Technology and Development, Kota Kinabalu,
Malaysia, pp. 58—62, 2009.
[37] P. Xia, L. Zhang and F. Li, “Learning similarity with cosine similarity ensemble,” Information Sciences,
vol. 307, pp. 39–52, 2015.
[38] K. K. Chandriah and R. V. Naraganahalli, “RNN/LSTM with modified adam optimizer in deep
learning approach for automobile spare parts demand forecasting, “ Multimedia Tools and Applications,
vol. 80, pp. 26145–26159, 2021.5038 CMC, 2022, vol.70, no.3
[39] P. Mohan and K. K. Patil, “Deep learning based weighted SOM to forecast weather and crop pre-
diction for agriculture application,” International Journal of Intelligent Engineering and Systems, vol. 11,
no. 4, pp. 167–176, 2018.
[40] S. Kumar, H. Sastry G, V. Marriboyina, D. Goyal and M. Verma, “A novel deep learning approach
for semantic information extraction from medicinal crops,” European Journal of Molecular & Clinical
Medicine, vol. 7, no. 8, pp. 1363–1378, 2020.You can also read