Fire & Emergency Services - 2021-2024 Business Plan & 2021 Budget - City of Mississauga
←
→
Page content transcription
If your browser does not render page correctly, please read the page content below
Fire & Emergency
Services

2021–2024 Business Plan
& 2021 Budget
Foreword

        Our Vision for the Future
        Mississauga will inspire the world as a dynamic and beautiful global city for creativity and
        innovation, with vibrant, safe and connected communities; where we celebrate the rich
        diversity of our cultures, historic villages, Lake Ontario and the Credit River Valley. A place
        where people choose to be.

Mississauga City Council approved Our Future Mississauga; a Strategic Plan to achieve this vision over a 40-year timeframe. The City
engaged over 100,000 people to develop this Vision Statement. To achieve this vision the City has identified five Strategic Pillars for
Change: move, belong, connect, prosper, and green. Each year the City proposes various initiatives that are aligned with the Strategic
Pillars and are intended to bring us closer to fulfilling our vision for the future. The City delivers over 300 services which are consolidated
into 16 Service Areas (including the Stormwater Program) that are outlined in this Plan. The 2021-2024 Business Plan and 2021 Budget
document details how and where the City plans to allocate resources to deliver programs and services.

The City is committed to providing programs and services cost effectively. In this Plan we have outlined measures that will help assess the
quality, efficiency and customer satisfaction that our services achieve. The results help inform decisions on resource allocations and direct
program offerings, and improve service delivery to ensure our vision is efficiently realized.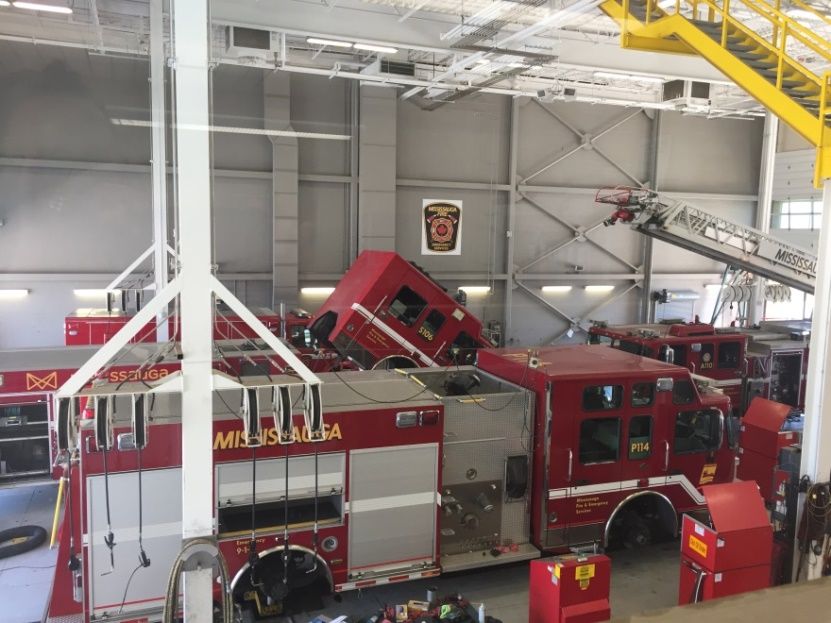
Table of Contents
Executive Summary of Fire & Emergency Services .................................................................................................................................... 3
Core Services .................................................................................................................................................................................................. 4
   Vision, Mission, Goals of Service and Service Delivery Model ..................................................................................................................... 4
   Response to COVID-19 ................................................................................................................................................................................ 5
   Service Levels and Trends ............................................................................................................................................................................ 6
   Performance Measures and Results ........................................................................................................................................................... 11
   Balanced Scorecard .................................................................................................................................................................................... 13
The 2021-2024 Business Plan Outlook ....................................................................................................................................................... 14
   Planning for the Future ................................................................................................................................................................................ 14
   Finding Efficiencies ..................................................................................................................................................................................... 17
   Advancing the City’s Strategic Plan ............................................................................................................................................................ 19
   Transforming our Business with Technology .............................................................................................................................................. 20
   Maintaining our Infrastructure ..................................................................................................................................................................... 21
   Managing our Human Resources ............................................................................................................................................................... 23
Proposed Operating Budget ........................................................................................................................................................................ 26
   Operating Budget Details ............................................................................................................................................................................ 27
      Proposed Budget by Program ................................................................................................................................................................. 27
      Summary of Proposed Budget ................................................................................................................................................................. 28
      Proposed Cost Increase Required to Maintain Current Service Levels .................................................................................................. 29
      Proposed New Initiatives and New Revenues ......................................................................................................................................... 30
Proposed Capital Budget ............................................................................................................................................................................. 43
   Proposed 2021-2030 Capital Budget by Program ...................................................................................................................................... 43
   Proposed 2021-2030 Capital Budget by Funding Source .......................................................................................................................... 44
   Proposed 2021 Capital Budget Detail ......................................................................................................................................................... 45
   Proposed 2021-2030 Capital Budget by Sub-Program............................................................................................................................... 46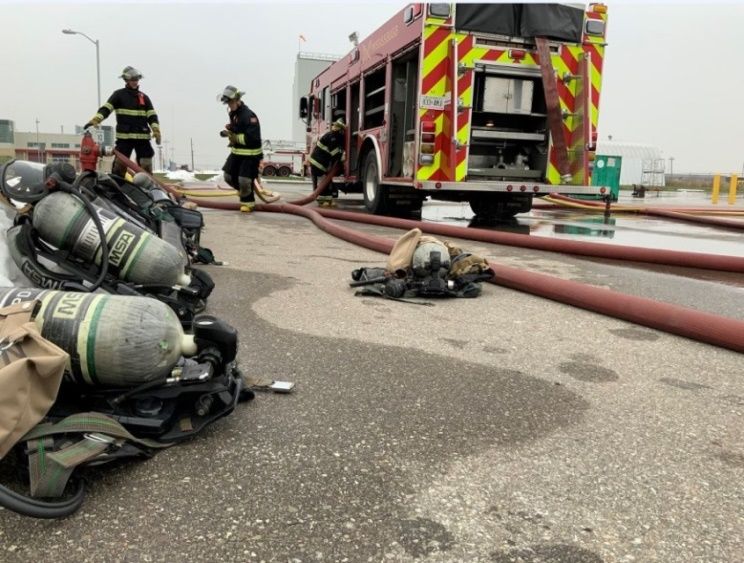
Executive Summary of Fire & Emergency Services
                                        Mission: To protect life, property, and the environment in Mississauga from all risks through
                                        education, enforcement, engineering, emergency response and economic incentive.

Services we provide:                                                       Highlights of the Business Plan include:
•   Public Education                                                       Execution of the Fire Master Plan that comprises the following:
•   Code Enforcement
                                                                          •       Risk-based targeted public education programs
•   Fire Plans Examination
                                                                          •       Risk-based proactive fire and life safety inspection
•   Emergency Dispatch                                                            programs
•   Emergency Response                                                    •       Construction of new fire stations to mitigate eroding
•   Fire Cause Determination                                                      response times
                                                                           •      Continuation of the Infrastructure Renewal Strategy
Interesting facts about this service:
                                                                           •      Development and delivery of staff certification based on
•   Responded to 384 fires in 2019                                                National Fire Protection Association (NFPA) standards
•   52 per cent (or 198) of fire responses met the industry
    response time target
•   Commenced 138 proactive high-rise and mid-rise fire safety                 Net Investment ($000s)    2021      2022      2023        2024
    inspections                                                                Operating                121,979   131,764   140,910      146,874
•   Opened first new fire station in 15 years (Fire Station 120)               Capital                   11,509    15,664    20,691       15,509
    at Hurontario & Eglinton
                                                                               Full Time Equivalents      768.0     782.0     828.0        828.0
•   Public Education team is actively creating fire safety
    programing and messaging that can be delivered virtually

2021-2024 Business Plan & 2021 Budget                                                                                                           C-3
Core Services
Vision, Mission, Goals of Service and                                Service Delivery Model

Service Delivery Model
The service delivery model is built to support the programming              Fire & Emergency
                                                                                 Services
and deployment of resources required to reduce, mitigate or
eliminate community risk as it relates to fire and emergency
services.
                                                                                Fire Prevention
Vision                                                                           & Life Safety
To be a global leader in Fire Service and Life Safety excellence.

Mission
                                                                                Professional
To protect life, property and the environment in the City of                   Development &
Mississauga from all risks, through education, enforcement,                     Accreditaion
engineering, emergency response and economic incentive.

Goals of Service
•     Reduce community risk                                                     Capital Assets
•     Increase and improve fire and life safety public education
      programming
•     Prioritize proactive fire safety inspections based on risk
•     Establish a robust long-term infrastructure renewal strategy              Operations &
                                                                               Communications
•     Align all staff development programs with recognized
      industry professional standards

                                                                                Administration

C-4                                                                    2021-2024 Business Plan & 2021 Budget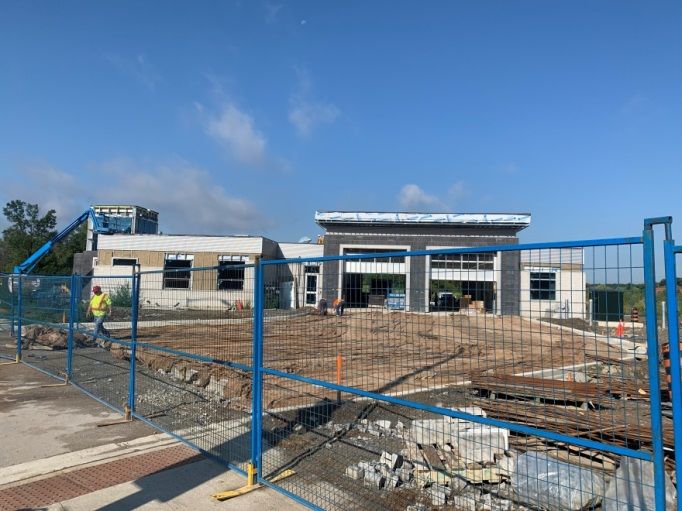
Response to COVID-19
    Fire & Emergency Services is an essential service and has               Challenges:
    continued to provide full services throughout the course of the         •   PPE was difficult to procure
    pandemic.
                                                                            •   Firefighters had to switch to wearing Self Contained
    Where possible, staff are working from home: however, much of               Breathing Apparatus (SCBA) for medical calls in place of
    the service Mississauga Fire & Emergency Services (MFES)                    N95 masks to protect both themselves and the public
    provides is based on emergency response and requires                    •   The number of medical calls increased, making the
    personnel to be available at all times. The way front-line staff            possibility of exposure higher for front-line staff
    work has changed, but the 670+ front-line firefighters and
                                                                            •   Some planned programming such as proactive inspections
    communications (dispatch) staff remain committed to providing
                                                                                and public education had to be delayed to support budget
    uninterrupted service.
                                                                                constraints
    The spring recruit class, which is typically delivered in-person
    with several hands-on components, was modified and adapted
    for online delivery.
    Fire safety inspectors continued to meet mandatory Ontario
    Building Code inspections and legislated building permit review
    timelines.
    Many safety protocols had to be updated to reflect changes to
    emergency response.

    Changes to Protocols:
    •   Updated Standard Operating Procedures related to personal
        protective equipment (PPE) requirements
    •   Modified deployment model for certain types of calls to
        minimize exposure where possible                                          Showing appreciation for front-line hospital workers
    •   Initiated sign-in and sign-out protocols at every fire station to
        support contact tracing in the event of an infection
    •   Required masks to be worn in the fire truck on the way to a
        call as physical distancing is not possible
•   Conducted deep cleaning in stations where infections were
    suspected

    2021-2024 Business Plan & 2021 Budget                                                                                                  C-5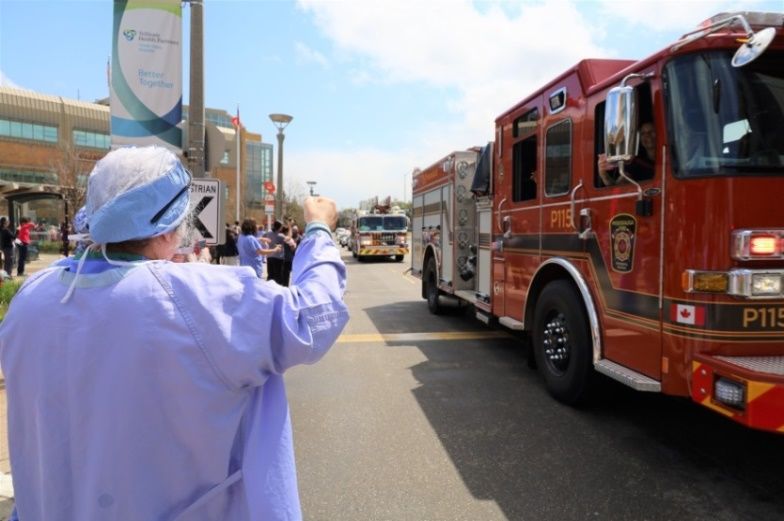
Service Levels and Trends
Age Risk                                                              Building Stock

Seniors (age 65 and over) statistically represent one of the          Residential
highest fire risks. They account for a much higher percentage of      In order to assess the fire loss by occupancy classification, data
fire fatalities in residential occupancies than their age group       from the Ontario Office of the Fire Marshal and Emergency
accounts for in the population (see table below).                     Management (OFMEM) Standard Incident Reporting was
                                                                      analyzed from 2015 to 2019. Based on this analysis, the chart
People aged 50-64 represent a future risk. The 55+ age group
                                                                      below illustrates that over the five-year period, residential
currently accounts for 27 per cent of the City’s population.
                                                                      structure fires represented more than half of the overall structure
Growth projections show this age group increasing to 45 per cent
                                                                      fires every year except 2019 and an average of 65 per cent of
by 2031.
                                                                      the fire loss.
Residential Fire Fatalities, Seniors Age 65+
                                                                      Mississauga Residential Structure Fires
                                               % of Residential
      Location           % of Population
                                               Fires Fatalities

Ontario                                   17                     39

Mississauga                               14                    56*
Data based on 2016 Census and actual call data
*Data based on a five-year average (2015-2019)

Fire Loss
Analysis of historical fire loss and fire call data provides valuable
insight into understanding the specific trends within a community.
Assessing the key factors of life safety risk and fire risk provides
a foundation for evaluating where specific programs or services
may be necessary.
                                                                      There are over 340 buildings in Mississauga with a height in
                                                                      excess of 18 metres. These are defined as high-rise buildings
                                                                      and are classified as high risk. They are high risk because
                                                                      response time can be longer and they require more resources to
                                                                      account for vertical response.

C-6                                                                                           2021-2024 Business Plan & 2021 Budget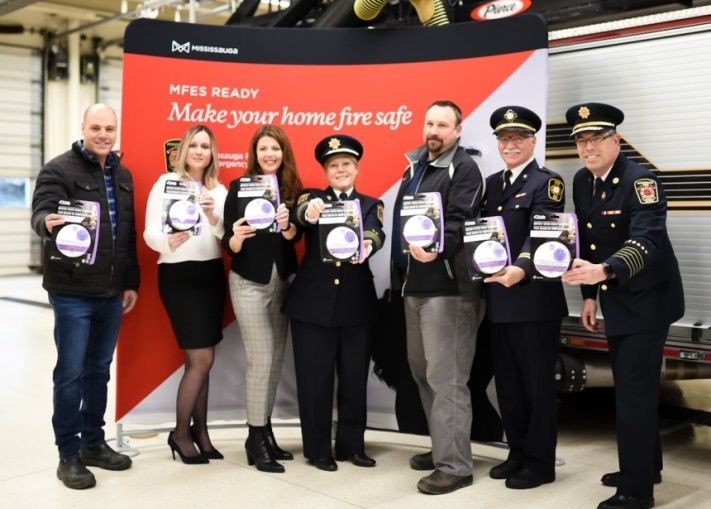
Industrial                                                                 2019 Unintentional Fire Causes
The comprehensive risk assessment conducted by MFES
                                                                                                                                                   # of             % of
identified industrial occupancy fires as a key risk. They represent                      Unintentional Causes
                                                                                                                                                   Fires            Fires
1.9 per cent of the city’s property stock and almost 12 per cent of
the city’s fire loss. This is significantly higher than the provincial     Design/Construction/Installation Deficiency                                       5           1%
average and higher than expected given the actual number of                Used or Placed too Close to Combustables                                          9           2%
industrial occupancies.                                                    Routine Maintenance Deficiency (e.g., lint,
                                                                                                                                                            15           4%
                                                                           grease build-up)
Civilian Fire Injuries and Fatalities                                      Improperly Discarded Smoking/Other Materials                                     27           7%
                                                                           Other                                                                            37          10%
Between 2015 and 2019 there were 100 civilian injuries and nine
                                                                           Unattended Cooking/Candles                                                       48          13%
civilian fatalities due to fire in Mississauga. The majority were in
                                                                           Mechanical/Electrical Failure                                                    129         34%
residential occupancies.
                                                                           Total                                                                            270
Residential Civilian Fire Injuries and Fatalities, 2015-2019
                                                                           Smoke Alarms
                    2015       2016       2017       2018       2019       Data over the past four years indicates that 62 per cent of fire
                                                                           calls analyzed do not have a working smoke alarm on the fire
Fatalities                 0          2          2          4          1   floor or the presence is undetermined. The law says that all
Injuries                 24           2          4      27         43      residential occupancies must have a working smoke alarm on
                                                                           every floor.
Fire Cause                                                                 The following table illustrates the number of times a smoke alarm
Many fatal fires are unintentional and can be prevented. A                 was present and operating on the floor or in the suite of fire
comparison of data from 2018 and 2019 illustrates a significant            origin over the past five years.
increase (19 per cent) in unintentional fires related to
mechanical/electrical failures (see following table). This can be          Smoke Alarm Operation, 2015-2019
wiring, electrical distribution systems, and lighting equipment. It                                                                                                    % of
                                                                                                                                                            Total
often involves damaged wiring, frayed appliance cords or loose             Smoke Alarm Operation     2015       2016       2017       2018       2019                  Total
                                                                                                                                                            Fires
                                                                                                                                                                       Fires
connections.                                                               No smoke alarm
                                                                                                        99         96         88        102        104         489       33%
                                                                           Smoke alarm present and
                                                                                                        92        128         74        120        119         533       36%
                                                                           operated
                                                                           Smoke alarm present and
                                                                                                        40         31         35         22         35         163       11%
                                                                           did not operate
                                                                           Smoke alarm present and
                                                                                                            9          8          6          8          5         36      2%
                                                                           operation undetermined
                                                                           Smoke alarm presence
                                                                                                        55         40         46         54         57         260       18%
                                                                           undetermined
                                                                           Total                       295        303        249        306        320       1,481

2021-2024 Business Plan & 2021 Budget                                                                                                                                    C-7
Fire Response                                                       2019 Call Volume by Major Call Type
Call Volume
A summary of the total number of calls within the city from 2015-
2019 indicates a steady increase in the number of incidents until
2019. The number of overall incidents decreased in 2019 as a
result of a decrease in the number of medical calls.

Call Volume by Year, 2015-2019

                                                                    Medical calls are 47 per cent of Fire & Emergency Services call
                                                                    volume.
                                                                    Calls to 9-1-1 are evaluated by dispatchers and, if warranted,
Response Type                                                       Fire & Emergency Services responds in support of Peel Regional
                                                                    Paramedic Service (PRPS). The decision as to whether Fire
The average annual call volume by response type is illustrated in
                                                                    responds or not is based on a tiered response agreement
the following chart.
                                                                    between Fire & Emergency Services and PRPS. This agreement
                                                                    is reviewed annually between the parties and guided by our base
                                                                    hospital medical director.
                                                                    The number of structure fires increased in 2019. From 2015-
                                                                    2018 the average number of structure fires was 222 annually. In
                                                                    2019 there were 384.

C-8                                                                                        2021-2024 Business Plan & 2021 Budget
Number of Structure Fires, 2015-2019                                  Response Time
                                                                      Total response time considers three factors:
                                                                      Call processing time – The interval between the time the call is
                                                                      acknowledged at the communications centre and the time
                                                                      response information begins to be transmitted to the emergency
                                                                      response units.
                                                                      Turnout time – The interval between the time the transmission
                                                                      from the call centre begins and the time the truck leaves the
                                                                      station.
                                                                      Travel time – The interval between the time the truck leaves the
                                                                      station and the time it arrives on scene.
                                                                      This captures the time interval from the receipt of the emergency
                                                                      call to when the first emergency response unit arrives on scene.
                                                                      The National Fire Protection Association (NFPA) total response
                                                                      time target is 384 seconds 90 per cent of the time for the first
Time of Day                                                           arriving vehicle on scene. The chart that follows illustrates Fire &
Emergency call volume increases above the daily average of            Emergency Services’ actual city-wide travel time and total
                                                                                               th
1,258 between the hours of 8 a.m. and 10 p.m. The combination         response time at the 90 percentile.
of higher-than-average call volume and peak road traffic cycles
                                                                                                               th
has a negative impact on response time. Of greatest concern is        City Wide Response Time at the 90 Percentile, 2015-2019
the 4 p.m. to 7 p.m. window, as the combination of high call                          Travel Time (seconds)
volume and high traffic levels increases the risk during that time.                   Total Response Time (seconds)

Average Call Volume by time of day, 2015-2019                                  471         466         469         473         470
                                                                         376         369         372         381         378               384

                                                                                                                                     240

                                                                           2015       2016        2017        2018        2019       Target

2021-2024 Business Plan & 2021 Budget                                                                                                        C-9
In the 2019 Fire Master Plan, it was recommended that MFES
build seven fire stations over 12 years with a goal to meet a
travel time target of four minutes (240 seconds) 75 per cent of
the time. The plan is to use a targeted approach to public
education and enforcement to augment emergency response in
order to accept the risk differential between 75 per cent and the
NFPA target of 90 per cent.
The following illustrates MFES city-wide response time at the
th
75 percentile.
th
City-wide Response Time at the 75 Percentile, 2015-2019
Training at the Garry W. Morden Centre
C-10 2021-2024 Business Plan & 2021 BudgetPerformance Measures and Results
The City of Mississauga is committed to delivering services data collected over the past five years, 62 per cent of fire calls do
economically and efficiently. The City’s performance measures not have a working smoke alarm on the fire floor or the presence
are used to help assess how well we are doing at achieving our could not be determined. The goal is to improve public fire safety
goals and where we need to improve operations. The results education and decrease this measure to zero.
also inform decision-making and strengthen accountability.
Number of Residents Receiving Fire Safety Public Education is a
measure that captures the number of residents the Public
Balanced Scorecard
Education Unit is reaching with public education programming.
A Balanced Scorecard groups measures in four key areas of an The goal is to increase this number each year.
organization’s performance: Financial, Customer, Employee, and
Business Process. By paying attention to all four areas, an Number of Fire Safety Inspections Completed is a measure that
organization can retain balance in its performance and ensure captures the number of times Fire Prevention Inspectors conduct
that it is moving toward the attainment of its goals. inspections on properties in Mississauga. In 2019, 8,713
inspections were completed. The goal is to prioritize based on
Below are descriptions of the measures tracked in this Service risk and increase this number each year.
Area’s Balanced Scorecard. The Balanced Scorecard table that
follows shows trends since 2017 and expected outcomes up to Employee Measures
2024.
% of Fire Staff Lean White Belt Trained measures the
percentage of the total number of fire staff trained to complete
Financial Measures
and submit small Lean process improvements. The goal is to
Cost Per Capita for Emergency Services is a measure that have all staff trained.
indicates how efficiently we are using our resources and is a
particularly useful measure when comparing with other similar Total number of Staff Trained as Fire & Life Safety Educators (to
municipalities to gauge effectiveness. The goal is to balance NFPA 1035) measures the number of fire staff trained to this
operational effectiveness, community safety and fiscal industry standard. The goal is to train both public educators and
responsibility. front-line firefighters to provide public education sessions. The
plan is to increase the total number of firefighters trained
Dollar Loss Related to Fires is a measure that indicates the annually.
estimated dollar loss related to fire damage. The goal is to
decrease the dollar loss annually. Total number of Fire Suppression Staff Trained in Fire Safety
Inspections (to NFPA 1031 – Level 1 Standards) measures the
Customer Measures number of fire staff trained to this industry standard. The goal is
to increase the number of staff trained by training firefighters to
% of Fires Where There Was No Working Smoke Alarm on Fire
assist with preliminary inspections.
Floor (or presence could not be determined) – This measure
helps illustrate how effective Fire & Emergency Services’ public
education programming is with respect to fire safety. Based on
2021-2024 Business Plan & 2021 Budget C-11Business Process Measures
th
First Unit Travel Time (all calls at the 75 Percentile) (target 240
seconds) captures the first arriving unit’s travel time to arrive on
scene at an emergency call. The goal is to meet or exceed the
target 75 per cent of the time city wide.
th
First Unit Travel Time (all calls at the 90 Percentile) (target 240
seconds) captures the first arriving unit’s travel time to arrive on
scene at an emergency call. The goal is to decrease the travel
time.
Number of Fire Safety Inspection Orders Issued – this measure
is a way of determining how effective the fire safety inspection
program is and how well Fire Code compliance issues are
understood and addressed. The goal is to educate the public on
the importance of compliance and reduce the number of
inspection orders issued annually.
Number of Fire Code Decisions Resulting in Prosecutions – Fire
& Emergency Services will prosecute for non-compliance with
the Ontario Fire Code. These are instances where an inspection
order was issued for non-compliance and no action was initiated
to rectify the infraction or there was a blatant disregard of the
Fire Code. The goal is to ensure business/building owners
understand their responsibilities and obligations under the
Ontario Fire Code and reduce the number of prosecutions
annually.
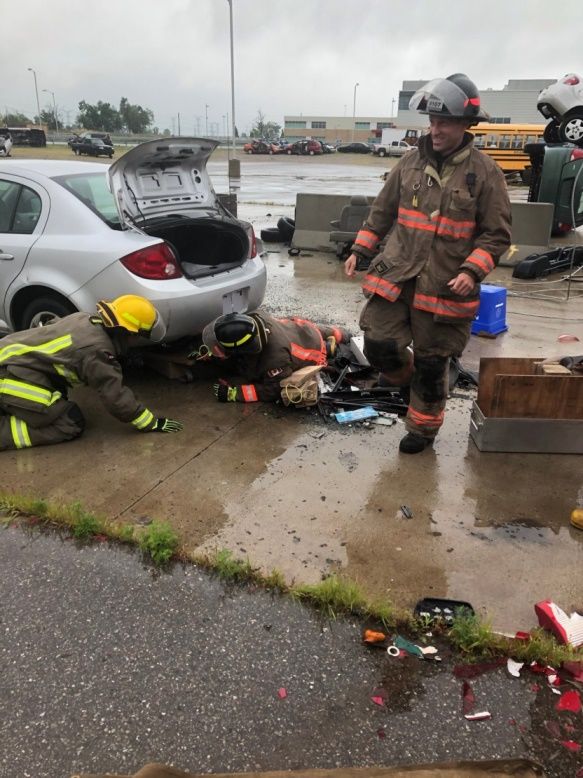
Auto extrication training at the Garry W. Morden Centre
C-12 2021-2024 Business Plan & 2021 BudgetBalanced Scorecard
Measures for Fire & 2017 2018 2019 2020 2021 2022 2023 2024
Emergency Services (Actual) (Actual) (Actual) (Plan) (Plan) (Plan) (Plan) (Plan)
Financial:
Cost per Capita for Emergency
137.17 137.42 146.73 148.55 166.20 170.66 180.76 187.06
Services ($)
Dollar Loss Related to Fires
101.3 61.0 30.3 10.0 10.0 10.0 5.0 5.0
($millions)
Customer:
% of Fires Where There Was No
Working Smoke Alarm on Fire
68% 58% 62% 55% 30% 25% 20% 15%
Floor (or presence could not be
determined)
Number of Residents Receiving
13,800 16,140 13,000 18,000 23,000 28,000 33,000 38,000
Fire Safety Public Education
Number of Fire Safety
8,212 9,256 8,713 9,584 10,543 11,597 12,757 14,032
Inspections Completed
Employee:
% of Fire Staff Lean White Belt
4% 30% 41% 45% 90% 98% 98% 98%
Trained
Total # of Staff Trained as Fire &
Life Safety Educators (to NFPA 9 50 102 124 154 184 214 244
1035)
Total # of Fire Suppression Staff
Trained in Fire Safety
0 35 82 101 121 141 161 181
Inspections (to NFPA 1031-
Level 1 Standards)
Business Process:
First Unit Travel Time (all calls
at the 75th Percentile) (target 288 296 292 288 288 290 284 278
240 seconds)
First Unit Travel Time (all calls
at the 90th Percentile) (target 372 381 378 372 372 374 368 362
240 seconds)
Number of Fire Safety
283 219 295 305 315 325 335 345
Inspection Orders Issued
Number of Fire Code Decisions
33 40 49 55 60 65 70 75
resulting in Prosecutions
2021-2024 Business Plan & 2021 Budget C-13The 2021-2024 Business Plan Outlook
smoke alarm programs and compliance are key components of
Planning for the Future public education and fire prevention activities provided by
municipal fire departments across the province.
Education
Data over the past five years indicates that 44 per cent of fire
Public fire safety education is a critical component to fire calls in Mississauga do not have a working smoke alarm on the
prevention. MFES is working towards prioritizing and fire floor and 62 per cent have no working smoke alarm or the
implementing all public fire safety programming based on risk. presence of one could not be determined.
Teaching people to be the stewards of their own fire safety has
proven to have a positive impact on the number and severity of Percentage of Fire Calls With No Working Smoke
fire-related injuries and deaths. Alarm/Presence Undetermined
80%
70% 68%
66%
62%
56% 58%
60%
50%
40%
30%
20%
10%
0%
2015 2016 2017 2018 2019
To meet the requirements of the Fire Protection and Prevention
Act as well as community needs, two additional public education
officers will be required in 2022 to work proactively with the fire
safety inspectors and front-line fire crews to develop educational
Fire Station Visit programming directed at high-hazard industrial occupancies.
This initiative will be funded through the Public Safety Fire
By law, smoke alarms are required on every storey of a dwelling Program Reserve Fund.
in the province of Ontario. Smoke alarm programs are also one
of the required services to be provided by a fire department as
per the Fire Protection and Prevention Act, 1997. As a result,
C-14 2021-2024 Business Plan & 2021 BudgetEngineering
The construction of a building can have a significant impact on
occupant safety. Before a permit is issued, fire plans examiners
are required to ensure that all fire and life safety requirements of
the Ontario Building Code and the Ontario Fire Code are
addressed. A fire safety engineer is being requested in 2022 to
address an increase in building permits. This will improve the
turnaround time for permit applications that are complex and
may require alternative solutions to those prescribed in the
Ontario Fire Code.
New technology can be extremely effective in improving service.
MFES is currently updating the Computer Aided Dispatch (CAD)
system which will enhance the routing of trucks to emergency
calls. The upgrade will also provide better statistical reporting
capabilities.
Public Education in a school
Enforcement
It is the responsibility of property owners/building managers to
ensure they comply with all applicable regulations and statutes.
Fire & Emergency Services has developed an inspection
program that has established appropriate inspection cycles for all
occupancy types based on risk. This program includes front-line
firefighters to assist with the delivery of inspections.
A total of 23 additional Fire Safety Inspectors will be required
over the next five years to complete the proactive fire safety
inspection program. In response to budget constraints due to
COVID-19, hiring for the 10 positions funded in the 2020
Business Plan & Budget has been deferred to 2021. These
inspectors will help to complete mid-rise occupancies and Fire Inspections
continue annual inspections. There will be 13 positions
requested over the next five years to address high-hazard
industrial and medium-hazard factory industrial, assembly and
business occupancies.
2021-2024 Business Plan & 2021 Budget C-15Emergency Response Impact on Travel Time with Addition of Fire Station 120
The NFPA’s travel time target is 240 seconds (four minutes) or Impact On Travel Time with Addition of Fire Station 120
less travel time for an initial arriving team of four firefighters 90 450
per cent of the time. MFES meets that target 52 per cent of the 400 383
372
time (as of December 2019). 350
299 288
300
250
200 City Wide Travel Time at
90th percentile
150
(seconds)
100
City Wide Travel Time at
50 75th percentile
(seconds)
0
Jan-Mar 2019 Jan-Mar 2020
(Before Station 120) (After Station 120)
The following areas were identified in the Fire & Emergency
Services Master Plan as priorities for new fire stations. Priority
order is based on risk.
• Dundas & Cawthra
• Collegeway & Winston Churchill
• Tenth Line & Aquitaine
Station 120 Construction
• Southdown & Truscott (Lorne Park)
New Stations • Mavis & Dundas
As part of the 2019 Fire Master Plan, Council approved a travel
Existing Stations
time target for the first arriving vehicle of 240 seconds (four
minutes) or less 75 per cent of the time. Fire & Emergency Services provides response to many different
types of incidents. Locating firefighters with the required
To reduce response time, the addition of seven fire stations was specialized disciplines and equipment in the right place is critical
recommended with the first of those being put into service in to positive outcomes. Location and deployment of those
November 2019. The following chart demonstrates the overall resources depends on community risk.
improvement of travel time city-wide with the introduction of Fire
Station 120 (Hurontario & Eglinton) to the deployment model. An Infrastructure Renewal Strategy completed in 2019 will assist
in ensuring the optimal location of stations and resources. This
includes the design of facilities, types of vehicles and associated
equipment required to address the risk of the community.
C-16 2021-2024 Business Plan & 2021 BudgetPart of Infrastructure Renewal Strategy looks at the rehabilitation
and/or relocation of existing fire stations. The 10-year capital
budget includes funding requests for the rehabilitation of three
fire stations beginning in 2022.
Fire Station 107
Fire Station 101
2021-2024 Business Plan & 2021 Budget C-17Finding Efficiencies
Highlights of the many projects and improvements completed
Lean Program
include:
The City’s Lean Program focuses on strengthening the
organization’s culture of continuous improvement and instills • Fire Plans Examination Review – increased the number of
Lean concepts and principles as a way of work in every Service complete submissions that met legislated deadlines by 23
Area. The program focuses on maximizing customer value and per cent and improved overall customer experience
minimizing waste along with empowering staff at all levels to • Station Supply and Inventory Review – increased staff
problem-solve on a daily basis. Since becoming permanent in capacity by reducing the time it takes to deliver station
2016, the Lean program has produced such enhancements as equipment and supplies to 20 stations across the City by 50
improved customer experience, faster processing times, higher per cent and order processing by 40 per cent
quality and lower costs. • Ministry of Transportation (MTO) Certification Process
Review – Mandatory front-line vehicle repair turnaround time
was reduced by up to 80 per cent for pumpers and squad
vehicles and 90 per cent for aerial apparatus
Completed Initiatives Total Benefits
Up to
2014 -
Improvement Type 2019 Sep Total Type Total
2018
2020
Small Improvements 34 41 10 85 Cost Savings and Avoidance $729,563
Rapid Improvements 2 0 1 3 Customer Service Improvements 57
Projects 4 0 0 4 Safety Improvements 32
Total 40 41 11 92 Environmental Improvements 35
In-progress Initiative Goals of the Initiative
Review Plan for Work Improve the process of relocation and workplace modifications in the event of a large scale disaster or
Area Resilience epidemic.
Process
C-18 2021-2024 Business Plan & 2021 BudgetAdvancing the City’s Strategic Plan
The City’s Vision and Strategic Plan are the starting points for connect – completing our neighbourhoods
our annual business planning and budgeting cycle. The 40-year
• Expanding the Proactive Fire Safety Inspection Program
Strategic Plan, Our Future Mississauga, is built on five pillars -–
and identifying appropriate inspection cycles to ensure
move, belong, connect, prosper, and green. Business Plans
compliance with the Ontario Fire Code
are designed to strengthen aspects of these pillars to support the
attainment of Mississauga’s Vision. • Expanding public education programming to target higher-
risk demographics based on results of the CRA
Below are examples of how the initiatives of Fire & Emergency
Services relate to the Strategic Plan pillars.
prosper – cultivating creative and innovative
belong – ensuring youth, older adults and new businesses
immigrants thrive • Combining both operations and fire prevention staff to
conduct fire safety inspections on all mercantile, commercial
• Developing targeted fire safety education programming
and industrial occupancies
based on risk
• Enhancing the smoke alarm program green – living green
• Engaging in community outreach
• Considering Leadership in Energy and Environmental
Design (LEED) principles when building new and retrofitting
existing buildings
Project Zero – Partnership with Enbridge Gas
2021-2024 Business Plan & 2021 Budget C-19Transforming our Business with Technology
Response time – An upgrade to the existing CAD and record
management system will help to reduce overall response time by
improving call handling and dispatching. It will provide intelligent
mapping, field communications, data reporting and analysis. This
project is funded and is currently underway. Cost of this project
is shared with Brampton and Caledon Fire & Emergency
services.
Fire Safety Inspections/Code Compliance – The introduction
of mobile field technology has improved the data capture and
processing time of fire safety inspections. Fire inspection staff
have been provided with mobile technology that allows them to
access and update files, maps and building data remotely. This
project is funded; inspections staff are now using this technology
in the field.
Virtual Learning – Training for Fire & Emergency Services staff
is traditionally in-person and hands-on, like the work itself. The
COVID-19 pandemic has challenged staff to come up with new
ways to deliver training. For example, the MFES fire recruit class
has been modified and adapted for online delivery where
possible. Going forward, many of these lessons can and will be
applied to other areas where virtual learning can benefit the
organization.
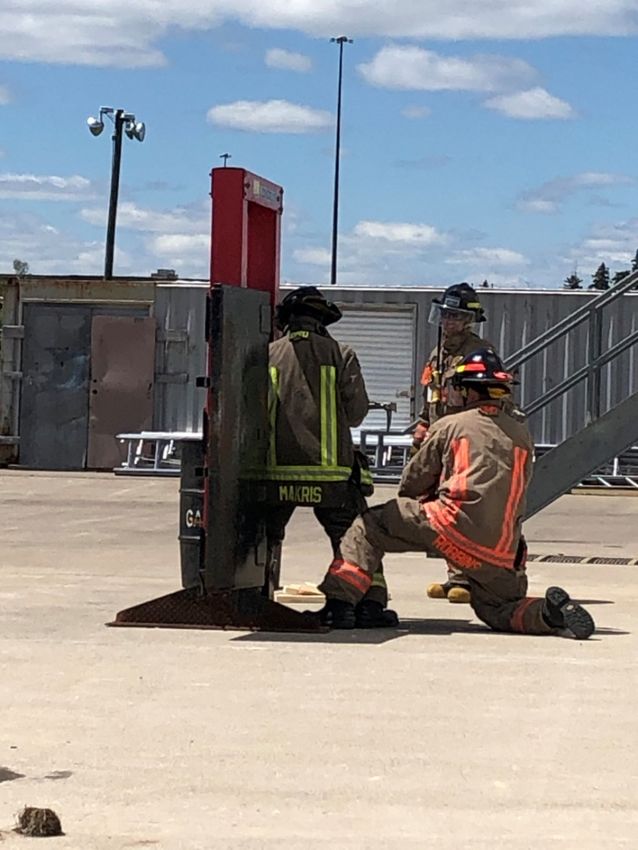
Forcible Entry Training
C-20 2021-2024 Business Plan & 2021 BudgetMaintaining our Infrastructure
2. Accessibility – The City of Mississauga 2015 Facility
Facilities
Accessibility Design Standards define the specifications for
In November 2019 the City of Mississauga opened its first new accessible/barrier-free design for municipal Fire Stations
fire station since 2002 – Station 120 at Hurontario & Eglinton.
3. Gender Neutral Washrooms – Many older stations do not
have female washroom facilities. The station audit includes
recommendations for gender neutral washroom/changeroom
facilities
The final report includes recommendations for each station. The
scope varies for each station depending on its assessment
against specific design principles. The audit used City of
Mississauga Accessibility Standards, NFPA facility standards as
well as operational requirements to determine building condition.
This study and a deployment model review have resulted in a
long-term infrastructure plan. This plan includes the
rehabilitation/renovation of three existing fire stations in the 10-
Fire Station 120 year capital plan.
Fourteen of the 21 stations were built more than 20 years ago.
To address major rehabilitation/renovation concerns, a Building
Condition Audit was conducted to assess the condition of those
14 fire stations. The primary goals of this study were to:
• Determine the current condition of each station
• Recommend a scope of work required for each station to
meet health and safety standards, comply with building and
fire code standards, meet accessibility requirements and
consider operational requirements
The study identified three high priority areas to be included in
rehabilitation/renovation plans, which are:
1. Health and Safety – NFPA standards make reference to the
need to prevent exposure from exhaust contaminants within
the dormitory and living areas as well as the appropriate
Training at the Garry W. Morden Centre
storage and separation of contaminated personal protective
equipment
2021-2024 Business Plan & 2021 Budget C-21Equipment The 10-year capital budget has funding for the replacement and
Within the 10-year capital budget there is funding for the refurbishment of all fire vehicles in order to maintain the reliability
purchase of new and replacement equipment to support front- of the fleet.
line operations.
Fire & Emergency Services has an inventory of equipment
valued at more than $10 million including:
• Personal protective equipment (bunker gear, SCBA,
helmets, gloves and all gear required for front-line
operations)
• Technical rescue equipment (auto extrication, high angle, ice
and water, trench and confined space rescue)
• Other front-line equipment such as hose, nozzles and other
equipment used for emergency response
All equipment must be tested and evaluated regularly to ensure
reliability, and confirm compliance with legislative requirements
and manufacturer recommendations.
Vehicles
Trucks in for service
Mississauga Fire & Emergency Services mechanical staff
provides fleet services to 47 front-line fire trucks (front-line and
reserve) as well as small and speciality vehicles. Fire trucks
provide front-line service for 12 years, and for an additional three
years they serve as reserve vehicles. About 80 per cent of the
repairs and services are performed in house at the Garry W.
Morden Centre.
C-22 2021-2024 Business Plan & 2021 BudgetManaging our Human Resources
Workforce Analytics administration staff. Eighty-seven per cent of the labour is related
to front-line firefighting operations. Suppression staff are hired for
Of the total staff complement in Fire & Emergency Services,
spring or fall recruit classes each year to fill vacancies resulting
98 per cent are unionized. This includes all front-line operations
from retirements. Succession planning will be critical as nearly
staff, Fire and Life Safety inspectors, public educators and plans
20 per cent of staff are eligible for retirement in the next four
examiners, training, mechanical and the majority of the
years.
Our Structure
Reduce Community Risk Infrastructure Renewal
Fire Prevention & Operations & Capital Assets
Life Safety Communications
Crew Fire Emergency Facility Fleet Repair &
Public Fire Safety New Fire Stations
Safety Response Renovations Maintenance
Education Inspections
Assessment
Financial/Business
Alignment of Training Programs
Sustainability
Professional
Operations & Administration
Development &
Communications
Accreditation
Review &
Align with Meet Application of Data Update
Deliver On-Shift Update
Industry Operational Corporate Lean and
Training Strategic
Standards Requirements Program Maintenance
Initiatives
2021-2024 Business Plan & 2021 Budget C-23Our Talent Fleet mechanics for front-line emergency vehicles require
Fire Prevention and Life Safety staff consists of public educators, ongoing training to ensure they maintain their existing skills and
plans examiners and fire safety inspectors. Specialty training to upgrade to adapt to emerging technologies. Fire fleet mechanics
NFPA standards consists of: have Emergency Vehicle Technician (EVT) training and specialty
manufacturer training.
• Fire Inspector (levels 1-3)
• Public Educator (levels 1 and 2) Critical Roles/Functions to Achieve Business Goals
• Building Code and Fire Protection Risk reduction is the primary goal of Fire & Emergency Services.
• Fire Investigator Functions including public education and enforcement are key to
mitigating community risk.
Fire & Emergency Services uses the Ontario Fire Administration
Inc. (OFAI) Candidate Testing Services to test potential recruits. Education – A robust, targeted public education program is
Through the OFAI, potential candidates complete a three-stage proven effective in the prevention of fires by providing people
testing program that includes written testing, psychological with the tools to help prevent fires as well as the knowledge of
profiling, medical and physical testing, and a skills evaluation. what to do in the event that a fire occurs.
The skills evaluation tests candidates to ensure they have the Enforcement – Proactive fire inspections and code enforcement
basic skills. are critical functions for risk reduction. Existing buildings must be
In operations there are over 650 staff at various levels that inspected at a frequency that corresponds with the risk (i.e.,
require ongoing skills development and upgrading. Staff in the higher risk, higher frequency).
Professional Development and Accreditation section, in Engineering – Fire plans examination functions ensure new
conjunction with on-shift training instructors, develop and deliver structures are built in compliance with Ontario Building Code and
training programs that ensure the development of new skills the Ontario Fire Code.
along with the maintenance of existing skills. These include such
programs as: Emergency Response – Front-line emergency response includes
responding to many types of emergencies. This includes fire
• Fire Ground Operations suppression, medical, hazardous materials and specialty rescue
• Medical incidents (auto extrication, water, ice and high angle).
• Auto Extrication
• Specialty Rescue (Confined Space/Trench/Hazmat)
• Apparatus Operation
• IT and Communications
Staff are encouraged to apply for other related courses to
improve their skills in each area as well as to upgrade in
response to changing codes, building stock and new
technologies.
C-24 2021-2024 Business Plan & 2021 BudgetTalent Needs As a result of COVID-19, all positions originally planned to be
Emergency Operations staff are hired through a recruiting requested for 2021 have been deferred to 2022 and staff that
process once or twice a year depending on the number of were funded in the 2020 budget will be hired in 2021.
existing vacancies.
There is high demand for these jobs, so there is no difficulty
attracting qualified candidates. Firefighters and Captains are
promoted based on an internal competitive examination process.
Over the next four years requests for staffing will be related to
critical, risk reduction programming detailed in the Fire &
Emergency Services Master Plan. They include public education,
fire safety inspections, training officers and new suppression
staff to support two new fire stations.
Proposed Full Time Equivalent Staffing Distribution by Program
Program 2020 2021 2022 2023 2024
Fire Building Maintenance 3.0 3.0 3.0 3.0 3.0
Fire Support Services 51.0 52.0 55.0 55.0 55.0
Fire Vehicle Maintenance 13.0 13.0 14.0 14.0 14.0
Prevention 67.0 66.0 76.0 82.0 82.0
Suppression 634.0 634.0 634.0 674.0 674.0
Total Service Distribution 768.0 768.0 782.0 828.0 828.0
2021-2024 Business Plan & 2021 Budget C-25Proposed Operating Budget
This part of the Business Plan sets out the financial resources Proposed Changes for 2021 Net Operating Budget by
required to deliver the proposed 2021-2024 Business Plan. Category
Information is provided by major expenditure and revenue
category as well as by program. The costs to maintain existing
service levels and operationalize prior decisions are identified
separately from proposed changes. The budget for 2020 was
$119 million and the proposed budget for 2021 is $122 million.
Total Changes to Maintain Current Service Levels
In 2021, the impact of maintaining current service levels for Fire
& Emergency Services is an increase of $2.65 million. Highlights
of the proposed budget changes include:
• $2.6 million in labour adjustments including annualization of
prior year Budget Requests
• $52,000 maintenance cost for new Business Continuity
Management solution
Efficiencies and Cost Savings
Cost savings of $40,000 include:
• $30,000 in staff development savings
• $10,000 in office supplies budget reduction
New Initiatives
New initiatives originally planned for 2021 have been deferred to
2022 or 2023 due to COVID-19-related budget constraints. As a
result there are no new initiatives proposed for 2021.
C-26 2021-2024 Business Plan & 2021 BudgetOperating Budget Details
The following table identifies the budgeted and forecasted operating expenditures and revenues for 2021-2024, as well as the 2020
Budget and the 2019 Actuals by major program within the Service Area.
Proposed Budget by Program
2021
2019 2020 2022 2023 2024
Proposed
Description Actuals Budget Forecast Forecast Forecast
Budget
($000s) ($000s) ($000s) ($000s) ($000s)
($000s)
Expenditures to Deliver Current Services
Fire Building Maintenance 1,238 1,329 1,482 1,498 1,522 1,530
Fire Support Services 9,198 8,987 9,002 9,219 9,419 9,595
Fire Vehicle Maintenance 3,977 4,322 4,539 4,617 4,662 4,711
Prevention 6,554 8,453 9,184 9,742 10,192 10,613
Suppression 93,645 102,314 104,545 113,641 122,345 127,911
Total Expenditures 114,611 125,404 128,751 138,718 148,140 154,361
Revenues (2,555) (2,206) (2,306) (2,306) (2,306) (2,306)
Transfers From Reserves and Reserve Funds 0 (3,826) (4,467) (4,837) (5,184) (5,446)
New Initiatives and New Revenues 0 189 260 266
Proposed Net Budget Including New 112,056 119,372 121,979 131,764 140,910 146,874
Initiatives & New Revenues
Expenditures Budget - Changes by Year 3% 8% 7% 4%
Proposed Net Budget - Changes by Year 2% 8% 7% 4%
Note: Numbers may not balance due to rounding.
2021-2024 Business Plan & 2021 Budget C-27Summary of Proposed Budget
The following table shows the proposed budget changes by description and category. Costs (labour; operational costs; and facility, IT and
support costs) and revenues are shown by category with the approved 2020 budget for comparison. The three columns to the far right of
the table show the totals proposed for 2021 and their dollar and percentage changes over 2020. The second table summarizes the
proposed 2021 budget and 2022-2024 forecasts.
Summary of Proposed 2021 Budget ($000s)
Operating Proposed
Maintain Annualized
2020 Impact of New Special Proposed
Current Efficiencies Prior Year's $ Change % Change
Description Approved New Initiatives Purpose 2021
Service and Cost Budget Over 2020 Over 2020
Budget Capital and New Levies Budget
Levels Savings Decisions
Projects Revenues
Labour and Benefits 110,477 2,659 0 410 0 0 0 113,546 3,069 3%
Operational Costs 5,173 309 (40) 0 42 0 0 5,484 311 6%
Facility, IT and Support Costs 1,020 (32) 0 0 0 0 0 988 (32) -3%
Transfer To Reserves & Reserve Funds 8,734 0 0 0 0 0 0 8,734 0 0%
Total Gross Expenditures 125,404 2,936 (40) 410 42 0 0 128,751 3,348 3%
Total Revenues (2,206) (100) 0 0 0 0 0 (2,306) (100) 5%
Transfer From Reserves & Reserve Funds (3,826) (260) 0 (380) 0 0 0 (4,467) (641) 17%
Total Net Expenditures 119,372 2,575 (40) 30 42 0 0 121,979 2,607 2%
Summary of Proposed 2021 Budget and 2022-2024 Forecasts ($000s)
2020 2021
2019 2022 2023 2024
Description Approved Proposed
Actuals Forecast Forecast Forecast
Budget Budget
Labour & Benefits 103,820 110,477 113,546 119,172 125,450 131,483
Operational Costs 4,981 5,173 5,484 5,565 5,625 5,626
Facility, IT and Support Costs 908 1,020 988 941 950 959
Transfer To Reserves & Reserve Funds 4,902 8,734 8,734 14,298 20,346 23,524
Total Gross Expenditures 114,611 125,404 128,751 139,977 152,372 161,592
Total Revenues (2,555) (2,206) (2,306) (2,306) (2,306) (2,306)
Transfer From Reserves & Reserve Funds 0 (3,826) (4,467) (5,907) (9,156) (12,412)
Total Net Expenditures 112,056 119,372 121,979 131,764 140,910 146,874
Note: Numbers may not balance due to rounding.
C-28 2021-2024 Business Plan & 2021 BudgetProposed Cost Increase Required to Maintain Current Service Levels
The following table provides detailed highlights of budget changes by major cost and revenue category. It identifies the net changes to
maintain existing current service levels, taking into account efficiencies, cost savings, and cost increases arising from prior year decisions.
2021
2020
Proposed Change Details
Category Budget
Budget ($000s) (all values in thousands)
($000s)
($000s)
Labour and Benefits 110,477 113,546 3,069 Increase reflects labour adjustments and other fringe benefit changes
Administration and Support Costs 1,020 988 (32) ($82) Garry W. Morden Centre allocation offset in Recreation
$49 IT Allocation
Advertising & Promotion 79 79 0
Communication Costs 455 455 0
Contractor & Professional Services 105 105 0
Equipment Costs & Maintenance 485 539 54 $52 Business Continuity Management System operating impact
Agreements $12 Diesel fluid
Finance Other 5 5 0
Materials, Supplies & Other 1,091 1,218 127 ($10) Office supplies reduction
Services $120 Bunker gear cleaning
$30 Bunker gear rental
$29 EpiPens and station inventory
$8 DisasterLAN annual maintenance increase
($50) Station 120 equipment budget reduction offset by reserve fund transfer
Occupancy & City Costs 959 1,104 145 $80 Generator maintenance
$40 Fire station facility maintenance
$25 Utilities and stormwater increases
Staff Development 449 434 (15) ($30) Staff development budget reduction based on trend
$15 Recruit class training material
Transfers To Reserves and Reserve 8,734 8,734 0
Transportation Costs 1,544 1,544 0
Subtotal - Other Operating Costs 14,927 15,205 279
Total Revenues (2,206) (2,306) (100) ($35) Fees & charges increase
($65) Revenue adjustment based on trend (elevator calls, false alarms, motor
vehicle accidents)
Transfers From Reserves and (3,826) (4,467) (641) ($641) Annualization of prior year budget requests funded by the Public Safety
Reserve Funds Fire Reserve Fund
Subtotal - Revenues (6,032) (6,773) (741)
Total 119,372 121,979 2,607
Note: Numbers may not balance due to rounding.
2021-2024 Business Plan & 2021 Budget C-29Proposed New Initiatives and New Revenues
This table presents the costs by Budget Request (BR) for proposed new initiatives. Each BR is numbered. Detailed descriptions of any
year one and year two BRs can be found in the pages following the table.
2021
2021 2021 to
2021 2022 2023 2024 to
Proposed 2024
Description BR # FTE Forecast Forecast Forecast 2024
Budget Capital
Impact ($000s) ($000s) ($000s) FTE
($000s) ($000s)
Impact
New Initiative
Fire Public Education Programming 5370 0.0 0 0 0 0 2.0 8
Proactive Fire Inspection Program 5371 0.0 0 0 0 0 13.0 28
Fire Professional Standards and Evaluation 5454 0.0 0 0 0 0 2.0 8
New Fire Station 123 5508 0.0 0 0 0 0 20.0 10,137
Fire Safety Engineer 5519 0.0 0 0 0 0 1.0 0
Fire Small Fleet Mechanic 5527 0.0 0 84 125 129 1.0 0
Fire Emergency Management Specialist 5554 0.0 0 105 135 137 1.0 0
New Fire Station 124 5556 0.0 0 0 0 0 20.0 17,137
Total New Initiatives 0.0 0 188,908 259,670 265,788 60.0 27,318
Total 0.0 0 188,908 259,670 265,788 60.0 27,318
Note: Numbers may not balance due to rounding.
C-30 2021-2024 Business Plan & 2021 BudgetBudget Request #: 5370 Proposed Initiative Department Service Area Fire Public Education Programming Community Services Department Fire & Emergency Services Description of Budget Request The establishment and staffing of a dedicated fire and life safety education section within Fire Prevention and Life Safety with a mandate to develop, implement and measure fire and life safety education programming based on identified key risks outlined in the CRA. Required Annual Operating Investment Impacts ($000s) 2021 2022 2023 2024 Gross Expenditures 0.0 203.7 304.2 313.8 Reserves & Reserve Funds 0.0 203.7 304.2 313.8 User Fees & Other Revenues 0.0 0.0 0.0 0.0 Tax Levy Requirements 0.0 0.0 0.0 0.0 * Net Change in $ 0.0 0.0 0.0 FTEs 0.0 2.0 2.0 2.0 *In each year, all values are cumulative, not incremental. Required Capital Investment Total Capital ($000s) 2020 & Prior 2021 2022 2023 2024 & Beyond Expenditures 50.0 0.0 8.0 0.0 0.0 Why Staff Recommend this Initiative Data over the past eight years indicates that 44 per cent of fire calls in the City of Mississauga do not have a working smoke alarm on the fire floor. By law, smoke alarms are required on every storey of a dwelling in the province of Ontario. Smoke alarm programs are also one of the required services to be provided by a fire department as per the Fire Protection and Prevention Act (FPPA), 1997. 2021-2024 Business Plan & 2021 Budget C-31
Budget Request #: 5370

Details of Service Change

Based on programming required to meet both the requirements of the FPPA as well as the needs and circumstances of a large, growing
city, eight public education officers will be required over a three-year period. Four were approved in 2019 to assess and develop
additional educational programming geared to high- and mid-rise occupancies. Two were approved in 2020 to work proactively with the
fire safety inspectors and front-line fire crews on mid-rise fire safety. Two are proposed in 2022 to develop educational programming
directed at high-hazard industrial occupancies. In order to maintain a balance between public safety and fiscal responsibility, this
initiative will be funded through the Public Safety Fire Program Reserve Fund.

Service Impact

A comprehensive smoke alarm program will reach a substantial number of residents and result in a higher rate of voluntary compliance
and subsequently improved fire safety, and will reduce the fire risk in residential occupancies. Teaching people to be the stewards of
their own fire safety has proven to have a positive impact on the number and severity of fire-related injuries and deaths. It is critical that
homeowners understand the law requires that all residential occupancies must have a working smoke alarm on every floor and that
there are consequences for non-compliance.

C-32                                                                                                 2021-2024 Business Plan & 2021 Budget
Budget Request #: 5371

Proposed Initiative                                             Department                               Service Area
Proactive Fire Inspection                                       Community Services Department            Fire & Emergency Services
Program

Description of Budget Request

Develop, staff, implement and measure a proactive fire and life safety inspection program that establishes appropriate inspection
cycles for all occupancy types based on key risks identified in the CRA.

Required Annual Operating Investment
Impacts ($000s)                                                                    2021          2022                2023              2024
Gross Expenditures                                                                   0.0        570.7             1,358.5            1,741.9
Reserves & Reserve Funds                                                             0.0        570.7             1,358.5            1,741.9
User Fees & Other Revenues                                                           0.0           0.0                 0.0               0.0
Tax Levy Requirements                                                                0.0           0.0                 0.0               0.0
* Net Change in $                                                                                  0.0                 0.0               0.0
FTEs                                                                                 0.0           7.0               13.0               13.0

*In each year, all values are cumulative, not incremental.

Required Capital Investment
Total Capital ($000s)                                        2020 & Prior           2021         2022                2023    2024 & Beyond
Expenditures                                                         70.0            0.0          28.0                 0.0                0.0

Why Staff Recommend this Initiative

The minimum inspection frequency for high-risk occupancies is annual. Currently the City of Mississauga has over 1,200 occupancies
that are classified as high-risk including vulnerable occupancies (nursing and long-term care facilities), high-hazard industrial properties
and high-rise buildings. Future growth plans consider additional high-rise occupancies.

2021-2024 Business Plan & 2021 Budget                                                                                                    C-33
You can also read