Fire & Emergency Services - 2018-2021 Business Plan & 2018 Budget
←
→
Page content transcription
If your browser does not render page correctly, please read the page content below
C
                          Fire & Emergency Services
Fire & Emergency
Services

2018–2021 Business Plan
& 2018 Budget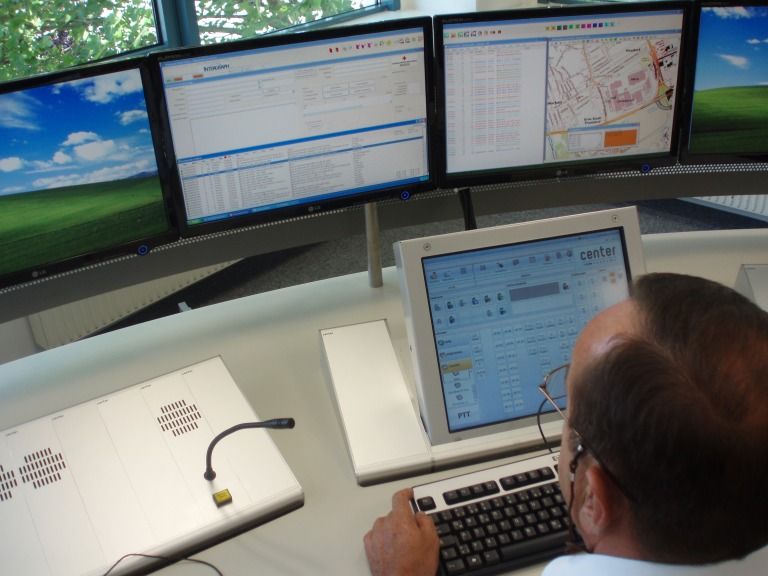
Foreword

Our Vision for the Future
Mississauga will inspire the world as a dynamic and beautiful global city for creativity and innovation, with vibrant, safe and connected
communities; where we celebrate the rich diversity of our cultures, historic villages, Lake Ontario and the Credit River Valley. A place
where people choose to be.
Mississauga City Council approved Our Future Mississauga; a Strategic Plan to achieve this vision over a 40 year timeframe. The City
engaged over 100,000 people to develop this Vision Statement. To achieve this vision the City has identified five Strategic Pillars for
Change: move, belong, connect, prosper and green. Each year the City proposes various initiatives that are aligned with the Strategic
Pillars and are intended to bring us closer to fulfilling our vision for the future. The City has over 300 lines of business which are
consolidated into 16 Services Areas that are outlined in this Plan. The 2018-2021 Business Plan and 2018 Budget detail how and where
the City plans to allocate resources to deliver programs and services.
The City is committed to providing programs and services cost effectively. In this Plan we have outlined measures that will help us assess
the quality, efficiency and customer satisfaction that our services achieve. The results help inform decisions on resource allocation, direct
program offerings and improve service delivery to ensure our vision is efficiently realized.
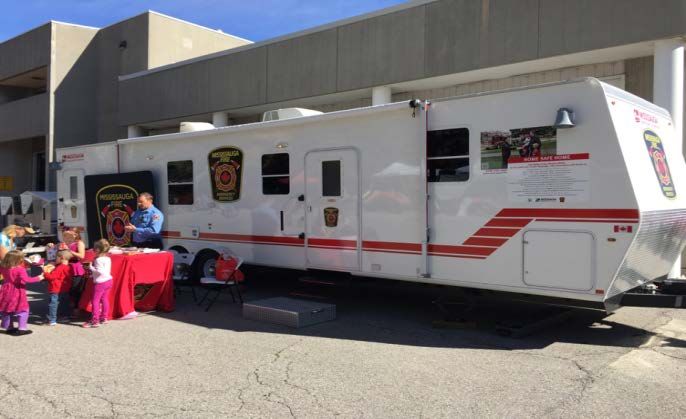
Table of Contents
Executive Summary of Fire & Emergency Services .................................................................................................................................... 3
Core Services .................................................................................................................................................................................................. 4
   Vision, Mission, Goals of Service and Service Delivery Model ..................................................................................................................... 4
   Current Service Levels and Trends............................................................................................................................................................... 5
   Balanced Scorecard .................................................................................................................................................................................... 11
   Awards and Achievements .......................................................................................................................................................................... 13
The 2018-2021 Business Plan Outlook ....................................................................................................................................................... 14
   Planning for the Future ................................................................................................................................................................................ 14
   Finding Efficiencies ..................................................................................................................................................................................... 16
   Advancing the City’s Strategic Plan ............................................................................................................................................................ 17
   Transforming our Business with Technology .............................................................................................................................................. 18
   Maintaining Our Infrastructure..................................................................................................................................................................... 19
   Managing Our Human Resources............................................................................................................................................................... 21
Proposed Operating Budget ........................................................................................................................................................................ 25
   Operating Budget Details ............................................................................................................................................................................ 26
       Proposed Budget by Program ................................................................................................................................................................. 26
       Summary of Proposed Budget ................................................................................................................................................................ 27
       Proposed Cost Increase Required to Maintain Current Service Levels.................................................................................................. 28
Proposed Capital Budget ............................................................................................................................................................................. 38
       Proposed 2018-2027 Capital Budget by Program .................................................................................................................................. 38
       Proposed 2018-2027 Capital Budget by Funding Source ...................................................................................................................... 39
       Proposed 2018 Capital Budget Detail ..................................................................................................................................................... 40
       Proposed 2019-2021 Capital Budget by Sub-Program .......................................................................................................................... 42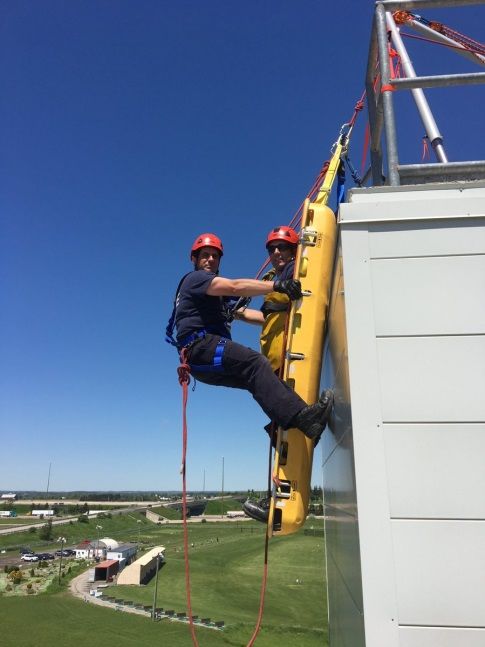
Executive Summary of Fire & Emergency Services
                                          Mission: To protect life, property and the environment in Mississauga from all perils guided by the
                                          three lines of defense: public education, prevention and emergency response.

Services we provide:                                                       Highlights of the Business Plan include:
•   Public Education                                                       •     Ongoing operations
•   Code Enforcement                                                       •     Fleet replacement and maintenance
•   Fire Plans Examination                                                 •     Maintenance, testing and evaluation of equipment
•   Emergency Dispatch                                                     •     Investment in technology for field operations
•   Emergency Response                                                     •     Station renovations
•   Fire Cause Determination                                               •     Lifecycle replacement of front line equipment
                                                                           •     Land acquisition for future station locations
Interesting facts about this service:                                      •     Staff training, certification and development
•   65.9 per cent of structure fires occur in residential
    occupancies
                                                                               Net Investment (000's)    2018       2019         2020     2021
•   100 per cent of all fire related fatalities occur in residential
                                                                               Operating                106,290    110,500   113,259     115,366
    occupancies
                                                                               Capital                   11,559      9,522       6,897     3,058
•   83 per cent of all fire related injuries occur in residential
    occupancies                                                                Full Time Equivalents       718.5     744.5       744.5     744.5

•   33 per cent of fires are caused by careless smoking,
    candles and other misuse of ignition sources
•   61 per cent of reported fires are unintentional
•   14 per cent of all fires are caused by mechanical or
    electrical failure

2018-2021 Business Plan & 2018 Budget                                                                                                         C-3
Core Services
                                                                     Service Delivery Model
Vision, Mission, Goals of Service and
Service Delivery Model
                                                                                      Fire and Emergency
                                                                                            Services
Vision
To be a Global Leader in Fire Service & Life Safety Excellence.
                                                                                              Fire Prevention
                                                                                              and Life Safety
Mission
To protect life, property and the environment in Mississauga from
all perils guided by the three lines of defense: public education,
prevention and emergency response.
                                                                                              Administration

Goals of Service
•     Achieve community safety guided by the three lines of
      defense: public fire safety education, fire safety standards
                                                                                              Operations and
      and enforcement, and emergency response                                                 Communication
•     Balance resources to identified risk through effective risk
      based planning
•     Continue to use and develop practices that provide financial
                                                                                               Professional
      and business sustainability                                                             Development &
                                                                                               Accreditation
•     Foster a healthy, safe, inclusive and respectful culture
•     Build leadership capability and create opportunity

                                                                                               Capital Assets

C-4                                                                                      2018-2021 Business Plan & 2018 Budget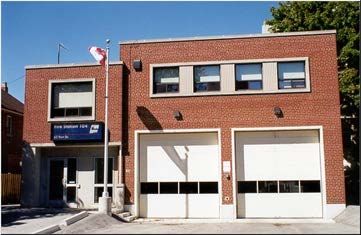
Current Service Levels and Trends
The Fire Prevention and Life Safety Section provides Public
                                                                            % Working Smoke Alarms on Fire Floor
Education, Code Enforcement, Fire Plans Examination and Fire        40%
Cause Determination services.                                                                                               34%
                                                                    35%                                     32%
                                                                            32%                                                             31%
                                                                                          30%
Public education is a legislative requirement under the Fire        30%

Protection and Prevention Act. Residents are encouraged to take     25%

responsibility for their own fire safety and take the necessary     20%
                                                                                                                    16%
                                                                                  15%
steps to prevent fires. In 2016 Mississauga Fire & Emergency        15%                            13%                            14%
                                                                                                                                                   10%
Services (MFES) was able to reach 27,826 residents.                 10%

                                                                     5%

                                                                     0%
                                                                              2012           2013              2014            2015             2016
                 Number of Public Education Sessions
                                                                                  No smoke alarm         Smoke alarm present, did not operate
      30000

      25000
                                                                    Fire Plans Examiners review all building permit applications to
      20000
                                                                    ensure that the fire and life safety requirements are in
      15000                                                         compliance with the Ontario Building Code and Ontario Fire
                                                       27826

      10000                       19466
                                                                    Code. These requirements include smoke and fire alarm
                 16603
                                                                    systems, automatic fire sprinkler systems, emergency power
       5000
                                                                    systems, emergency lighting systems, hose and standpipe
          0                                                         systems, hazardous processes/operations and protection, smoke
                  2014             2015                2016
                                                                    control systems and high-rise safety measures.
                                                                    Completed Applications by Fire Plans Examiners
By law, smoke alarms are required on every storey of a dwelling
in the Province of Ontario. As a result, smoke alarm programs
                                                                     Year         # of Complete          # of Completed        % of time legislated
and compliance are a key component of public education and                        Applications           within deadline       deadline met
fire prevention activities provided by municipal fire departments                 submitted

across the province.
                                                                     2014               1,285                     972                    75.6
Data for the City of Mississauga over the past five years
                                                                     2015
indicates that 40 per cent of fire calls do not have a working                          1,269                     1,145                  90.2
smoke alarm on the fire floor.                                       2016
                                                                                        1,245                     1,226                  98.5

2018-2021 Business Plan & 2018 Budget                                                                                                                  C-5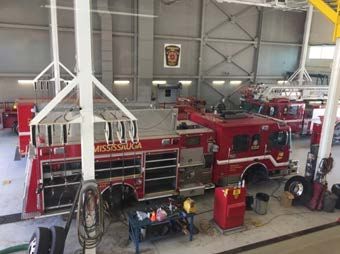
Fire Inspectors conduct fire safety inspections to ensure             The National Fire Protection Association (NFPA) identifies a
buildings are safe and comply with Ontario Fire Code. MFES is         travel time target of four minutes (240 seconds) 90 per cent of
legislatively responsible for conducting fire safety inspections to   the time. Travel time is defined as the time it takes from when
ensure public safety. The frequency of inspections directly           the truck leaves the station to the time it arrives on scene. In
impacts the level of fire safety and code compliance of               2016 MFES actual travel time was four minutes (240 seconds)
properties. Of particular concern are vulnerable occupancies          60 per cent of the time. The actual 90th percentile travel time was
(retirement homes and care and treatment facilities). In 2016 all     348 seconds. With the opening of Station 120 in 2019 and other
vulnerable occupancies within Mississauga were fully inspected        additional infrastructure in future years, travel times are expected
and mock fire drills were conducted to ensure compliance. A           to decrease.
total of 9,757 fire safety inspections were completed in 2016.        911 Communications Operators and call takers answer
Fire Inspectors are also responsible for fire investigations.         emergency calls and dispatch fire emergency vehicles 24 hours
Investigations are conducted to determine the area of origin and      per day 365 days per year. Communications staff provide radio
cause. This information is used to determine trends and assists       support to crews throughout the course of an incident and are
MFES in the prevention of similar incidents as well as in             responsible for the timely dispatch of additional vehicles or
developing fire safety education programming. In 2016 Fire            resources as required.
Prevention and Life Safety Section conducted 168 major fire           The staff that provide resources and support to the front line
investigations, four of which resulted in prosecutions.               service are critical to the delivery of excellent customer service.
Emergency Operations Personnel respond to emergency and
non-emergency calls. These include medical emergencies,
motor vehicles accidents, public hazard situations, elevator                                                           Call Volume by Year
rescues and water rescues. Both call volume and response time                            31,000
                                                                                                                                                                  30,106
continue to rise as the population density increases.                                    30,000
                                                                                                                                                         28,949
                                                                                         29,000                                                 28,655

                                                                       Number of Calls
                                                                                         28,000
                                                                                                  26,970
                                                                                         27,000
                                                                                                                                       26,372
                                                                                         26,000                      25,738
                                                                                                           25,368             25,495
                                                                                         25,000

                                                                                         24,000

                                                                                         23,000

                                                                                         22,000
                                                                                                  2009     2010      2011     2012     2013     2014     2015     2016

                                                                                                                              Year

                      Motor Vehicle Rescue

C-6                                                                                                                 2018-2021 Business Plan & 2018 Budget
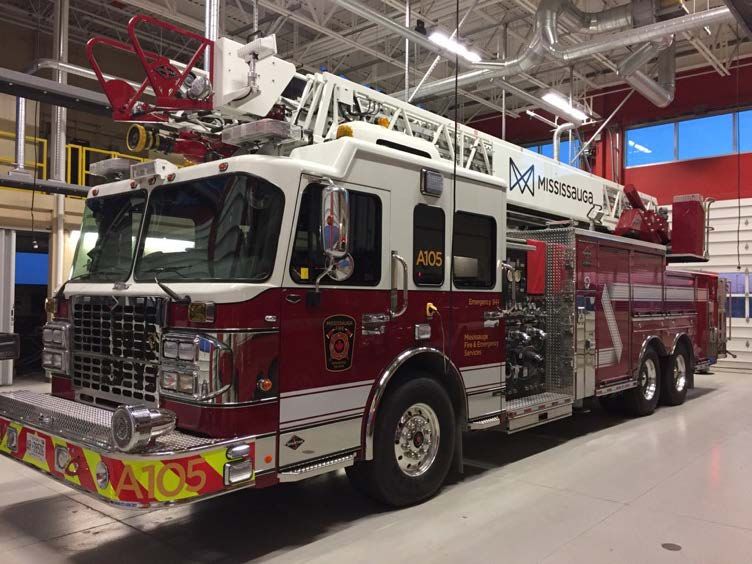
Fleet and building mechanics are responsible for the repair         Training officers provide operational training to front line staff to
and maintenance of front line fire apparatus and fire stations      ensure staff are properly trained in all disciplines. This includes
across the city. The MFES fleet consists of 80 vehicles, 30 front   emergency response, inspection and code enforcement, and
line emergency response apparatus, nine reserve apparatus and       public education. The requirement is to meet Ministry of Labour
seven unstaffed emergency specialty vehicles equipped for           guidelines and ensure the service meets Council expectations.
specialty rescue operations. MFES has 20 fire stations located
across the City to provide service to the community. Front line
equipment for 700 personnel (such as personal protective gear,
Self-Contained Breathing Apparatus (SCBA) as well as hose and
other tools required for emergency operations) is the
responsibility of an equipment officer.

                                                                             High Angle Training at Garry W. Morden Centre

                        New Aerial 105

2018-2021 Business Plan & 2018 Budget                                                                                               C-7
Performance Measures and Results
The City of Mississauga is committed to delivering services
economically and efficiently. The City’s Performance Measures
are used to help assess how well we are doing at achieving our
goals and where we need to improve operations. The results
also inform decision making and strengthen accountability. The
following section describes the measures that we use and
provides context for results. The Balanced Scorecard shows
trends since 2014 and expected outcomes up to 2021.

What we are measuring
Total Operating Cost Per Capita Municipality Comparison is
                                                                       Public Education Trailer
a measure that calculates the total operating cost for all fire
services divided by the population to provide the estimated cost
per capita.

Why this measure is important
This measure illustrates the cost to the taxpayer for fire and
emergency services in comparison to other fire services in
municipalities that provide similar programs and services.

How we are improving results
As the cost of providing effective service increases, staff are
always looking for ways to improve customer service. MFES has
completed two Lean projects and is in the process of completing
a third (see details under Finding Efficiencies). These projects
have improved customer service and identified service
improvements in the Plans Examination and equipment inventory
                                                                   Source: 2016 Calgary Fire Survey
areas. A comprehensive community risk assessment is
underway that will provide recommendations for improvement.

C-8                                                                       2018-2021 Business Plan & 2018 Budget
What we are measuring
We measure the number of Fire Safety Inspections completed
each year to ensure compliance with the Ontario Fire Code.
Inspection orders are issued for non-compliance with the Fire
Code.
Number of Fire Safety Inspections Completed
Why this measure is important
The number and frequency of inspections is an important issue
as it directly impacts the level of fire safety and code compliance
of properties across the City. Regular mandatory inspections are
the most effective way of ensuring that properties achieve an
effective level of safety. The mandatory inspection process will
ensure properties are inspected on a regular basis related to the
level of risk they present to occupants and the community.
How we are improving results
MFES is in the process of conducting a Comprehensive
Community Risk Assessment. As part of this study a building
stock profile has been compiled that identifies the type, size and
age of all of the buildings in the City of Mississauga. This will
assist MFES to further assess the inspection requirements
based on the level of risk associated with each property. The risk
assessment is expected to be completed by the end of 2017.
City Centre Skyline
2018-2021 Business Plan & 2018 Budget C-9What we are measuring
First Unit Travel Time Performance captures how long it takes Travel Time Performance
from the time the truck leaves the station until it arrives on the 400
scene. National Fire Protection Association identifies a target of 346 348 350 352 350 350 346
345 342
350 338
240 seconds 90 per cent of the time.
300
Why this measure is important 250
Travel time is the largest component of total response and is the 200
most difficult to control in a growing municipality with significant
150
urban intensification. An increase in travel time may have a
negative impact on outcomes in an emergency situation such as 100
2014 2015 2016 2017 2018 2019 2020 2021 2022 2023
medical, fire and rescue incidents. The chart on the right Travel Time Performance (seconds) [Target 240 seconds]
illustrates actual and projected city wide travel time. The
introduction of a new fire station or additional resourcing has a Station 120 becomes operational
much greater impact in the immediate response area than it
does when it is aggregated at a city wide level.
Target Actual
How we are improving results
Population growth, density and other risk based factors are being
assessed. MFES is currently working on an infrastructure
renewal strategy that will consider deployment, resourcing and
infrastructure options to best mitigate increasing travel times.
Where significant changes in response and deployment are not
warranted, additional mitigation factors such as public fire safety
education and fire safety inspections will be considered.
C-10 2018-2021 Business Plan & 2018 BudgetBalanced Scorecard
A Balanced Scorecard identifies and measures four key areas of Employee Measures
an organization’s performance: Financial, Customer, Employee, Strategic Leadership – Based on the 2015 Employee
and Business Process. By paying attention to all four areas, an Engagement Survey this measurement identifies how MFES
organization can retain balance in its performance and ensure employees rate and/or are satisfied with the strategic leadership
that it is moving towards the attainment of its goals. of the department. The goal is to increase the percentage over
Financial Measures time through employee engagement.
Total Operating Cost Per Capita is a measure that indicates how Innovation – This measurement identifies how employees feel
efficiently we are using our resources and is a particularly useful about being empowered to try new business processes and their
measure when comparing with other similar municipalities to perception of management’s acceptance of change. The goal is
gauge effectiveness. to increase the percentage satisfaction over time through
employee engagement.
Dollar Loss related to Structure Fires is a measure that indicates
the estimated dollar loss related to fire damage. The goal is to Business Process Measures
th
decrease the average fire loss annually. First Unit Travel Time (90 Percentile) captures how long it takes
Customer Measures from the time the truck leaves the station until it arrives on the
scene. Travel time is the largest component of total response
Incidents where No Working Smoke Alarm on Fire Floor – This and is the most difficult to control in a growing municipality with
measure helps illustrate how effective MFES public education significant urban intensification. The travel time target is four
programming is with respect to fire safety. Based on data minutes 90 per cent of the time for first the arriving vehicle on
collected over the past five years, 40 per cent of fire calls do not scene.
have a working smoke alarm on the fire floor. The goal is
improve public fire safety education and decrease this measure Number of Inspection Orders Issued – this measure is a way of
to zero. determining how effective the fire safety inspection program is as
well as how well Fire Code compliance issues are understood
Number of People Attending Public Fire Safety Education and addressed. In 2014 MFES changed the process used to
Programs – This measure captures the number of people that track and record this information.
have attended a public fire safety education event or have had a
visit from MFES staff delivering a program or message. The goal
is to increase the number of people reached annually through
targeted public fire safety education.
2018-2021 Business Plan & 2018 Budget C-11Balanced Scorecard (Cont’d)
Measures for Fire & 2014 2015 2016 2017 2018 2019 2020 2021
Emergency Services (Actual) (Actual) (Actual) (Planned) (Planned) (Planned) (Planned) (Planned)
Financial:
Cost per Capita for 123.69 127.15 132.87 137.23 140.15 146.16 148.96 151.45
Emergency Services ($)
Dollar Loss Related to 14.3 19.8 101.3 20.0 15.0 10.0 5.0 5.0
Structure Fires ($ Millions)
Customer:
Number of people attending
16,203 19,466 27,876 32,880 37,880 42,880 47,880 52,880
Public Education Sessions
Number of Fire Safety
10,102 10,713 9,757 11,708 14,050 15,455 17,000 18,700
Inspections
Number of incidents – no
working smoke alarm on fire 135 139 127 121 115 110 105 100
floor
Employee:
Employee Engagement
Scores: Strategic Leadership N/A 59.3 N/A N/A 74.6 N/A N/A 80.0
(%)
Employee Engagement
N/A 62.3 N/A N/A 70.6 N/A N/A 75.0
Scores: Innovation (%)
Internal Business Process:
First Unit Travel Time (sec at
345 346 348 350 352 350 350 346
the 90th percentile)
Number of Fire Safety
30 182 218 283 311 327 311 296
Inspection Orders Issued
C-12 2018-2021 Business Plan & 2018 BudgetAwards and Achievements
C Shift Crews received the Firefighter of the Year award from the
Fire Station 119 received Leadership in Energy and
Mississauga Real Estate Board and the Mississauga News.
Environmental Design (LEED) Gold Certification.
They rescued four people from a house fire in March of 2016
It is the first building in the City of Mississauga to receive this
distinction
Camp Ignite Week for teenage girls aged 15-19 to experience
MFES auto extrication team were 1st overall at the 2016 North firefighting and future career opportunities
American Vehicle Rescue Challenge
2018-2021 Business Plan & 2018 Budget C-13The 2018-2021 Business Plan Outlook
Planning for the Future
Priorities for 2018-2021 2) Phase Two – Develop risk reduction strategies to address all
of the community risks identified in Phase One
• Implement Risk Reduction Plans as identified through the
Comprehensive Risk Assessment (2018-2019) The study will consider demographics, geography of the city,
types of occupancies, current and historical emergency data,
• Infrastructure Renewal Strategy (2018-2021)
and economic/financial impacts.
• Implement new technology initiatives – Records
Phase One is complete. Based on preliminary findings from
Management and Field Automation & Automated Staffing
Phase One, three programs have been identified as critical to
Solution (2018-2020)
future service delivery:
• Fleet Management – Purchase of new vehicles and
• A risk based comprehensive fire station location/
maintenance of existing (2018-2021)
infrastructure program
• Equipment Management – Development, implementation • A detailed proactive fire safety inspection program
and maintenance of equipment lifecycle plan (2018-2021) • Targeted fire safety education programs
• Grow community outreach (2018-2021) To address these preliminary findings and meet the needs of the
• Continue to leverage business efficiencies through Lean, community, MFES will undertake a number of key initiatives.
technology improvements and workforce strategic planning.
(2018-2021)
Infrastructure Renewal Strategy
This project will provide the framework for infrastructure planning
Comprehensive Risk Assessment (CRA) for MFES over the next 30 years. The strategy will consider both
MFES has embarked on a risk assessment designed to gather the results of the CRA and existing facility condition reporting to
and assess data relevant to the delivery of fire and emergency determine a long term infrastructure plan. Fire station locations
services within the community. This data will be used to for both new and existing stations as well as optimizing
determine current and potential future risk and associated deployment models to best mitigate potential risk will be
mitigation strategies. explored. This plan will inform the 10 year capital budget
process.
The two primary objectives of this project are:
1) Phase One – Identify and assess the risks that currently
exist within the community as well as how they impact future
service delivery
C-14 2018-2021 Business Plan & 2018 BudgetProactive Fire Safety Inspection Program
Based on the number of high risk and high value occupancies
identified across the city a proactive fire safety inspection
program will be an important mitigation strategy. This would
identify appropriate inspection cycles for each property type
based on its risk. The higher the risk, the more often it should be
inspected to ensure compliance with the Ontario Fire Code. The
existing annual inspection program includes vulnerable
occupancies and hotels/motels.
Targeted Fire Safety Education Programs
An analysis of the demographic make-up of the City combined
with historical emergency data clearly illustrates the need for
targeted fire safety education programs. These programs will be Fire Station 104
aimed at the most vulnerable residents as well as those in high
risk and high volume areas.
Total Wellness Strategy
One of the main focuses of this strategy will be Post Traumatic
Fire Station Facility Audit
Stress Disorder (PTSD) along with other mental health
Of the 20 existing fire stations, eight are scheduled for challenges that impact first responders at a higher rate than
renovation over the next 10 years. To be able to accurately many other professions. MFES has a Peer Support Team that is
gauge each station’s condition and rehabilitation requirements, made up of front line firefighters that are trained to provide
an assessment of each station must be conducted. This counselling and support to their colleagues, either in the wake of
assessment will inform the infrastructure renewal strategy and a traumatic incident or as needed. This team requires annual
consequently the 10 year capital budget. training and recertification to ensure ongoing support for front
line staff and meet the requirements of the mandatory Provincial
Government PTSD plan.
2018-2021 Business Plan & 2018 Budget C-15Finding Efficiencies
Initiative Results/Expected Results
Continued success from the Lean Fire Plans • 98.5% of all complete submissions meet legislated deadlines –
Examination (Lean Project) increase of 23% from 2014.
Implementation of Stores inventory Lean Review • Station supply delivery time reduced by 50%
recommendations • 40% reduction in station supply processing time
(Lean Project) • 89% reduction in processing of personal protective equipment
replacement/delivery
Mobile Self-contained breathing air (SCBA) repairs • Productivity increase of approximately 40% due to decreased travel
(Small Improvement) time
• Reduction in the time an SCBA is out of service for repair
Initiation of Mechanical Ministry of Transportation • Decrease turnaround time for legislated MTO repairs
(MTO) Lean Review (Lean Project) • Turnaround time reduction of up to 80% for Pumpers/Squads and
90% for aerial apparatus
• Balance the workflow to improve productivity
• Productivity increase ≥10% related to shop floor/tool layout
improvements
• Reduce the amount of time front line apparatus are out of service
• 10% overall reduction in apparatus taken out of service
C-16 2018-2021 Business Plan & 2018 BudgetAdvancing the City’s Strategic Plan
move - developing a transit oriented city
• Infrastructure Renewal Plan will consider station locations that reduce travel time and consequently the amount of time vehicles are
on the road
• Introduce training programs to address changes to service delivery resulting from the implementation of the LRT and pedestrian
friendly design
belong - ensuring youth, older adults and new immigrants thrive
• Offer fire safety pamphlets and other information in multiple languages
• Target fire safety education programs to meet the needs of a diverse community
connect - completing our neighbourhoods
• Expand the Proactive Fire Safety Inspection Program to ensure compliance with the Ontario Fire Code
• Expand public education programming to target higher risk demographics based on results of the Comprehensive Risk Assessment
prosper - cultivating creative and innovative businesses
• On duty suppression crews conduct fire safety inspections of mercantile, commercial and industrial occupancies to ensure safety
systems are in place and operate as intended
green - living green
• Consideration given to LEED when retrofitting existing buildings at the time of the renovation
2018-2021 Business Plan & 2018 Budget C-17Transforming our Business with Technology
Mobile Field Technology
The goal of this initiative is to implement field automation
technology for fire inspection staff to improve the delivery of
inspection and enforcement services. Inspection staff will be
provided with mobile technology that will allow them to access
and update files, maps and building data remotely. It is expected
to reduce the amount of office space required by this section by
41 per cent as the inspectors will be mobile and community
based. It will also allow each inspector to process more
inspections annually.
Automated Staffing and Records Management
The goal of this initiative is to more effectively manage staffing
across 23 facilities including 20 fire stations and four shifts. This
technology will be dependent on changes to the dispatching
technology.
Computer Aided Dispatch (CAD) Replacement
CAD is an incident management software system which includes Computer Aided Dispatch
call handling and dispatching, intelligent mapping, field
communications, data reporting and analysis and application
Remote Training and Information Displays
integration. The current system is dated and an upgrade of the
system will be completed to ensure continued reliability of Information displays centrally located within the fire stations will
routing, dispatching and data information capture. facilitate information dissemination across 23 fire facilities. This
will include online training modules and public education
information. This initiative will reduce travel time associated with
training and allow crews to complete the training modules as a
team in their own station.
C-18 2018-2021 Business Plan & 2018 BudgetMaintaining Our Infrastructure Equipment Lifecycle Fire Stations As part of an overall review of the Capital Assets Section, MFES MFES has eight fire stations that require rehabilitation. The will undertake a full lifecycle review of all major equipment. This amount and type of alterations varies from station to station. will assist in the development of a more rigorous lifecycle They include but are not limited to barrier free washroom replacement plan that will inform the 10 year capital budget facilities, female washroom and change room facilities, structural process. repairs, upgrades to meet the accessibility guidelines, and Major Equipment Testing, Evaluation and Replacement upgrades to meet health and safety and code requirements. Annual testing and evaluation is to be completed on all front line This project will be dependent on the completion of the apparatus and equipment. It is critical for the safety of staff as Infrastructure Renewal Strategy and Fire Station Facility Audit. well as to ensure operational reliability that legislative These two projects will provide direction as to the scope of the requirements and manufacturer recommendations are met. This renovations required. includes the testing of such things as ground and aerial ladders, pumps, generators, hose and other equipment used for auto extrication and other rescues. A robust lifecycle replacement model will be development for all major equipment that will allow MFES to create a baseline standard for equipment replacement. This plan will inform the 10 year capital budget process. Front Line Vehicles After a thorough review of appropriate lifecycle replacement models for front line fire apparatus, MFES has implemented a lifecycle model that is 12 years front line and three years in reserve for a total lifecycle replacement of 15 years. MFES Capital Assets section is in the process of replacing the fleet based on the new lifecycle program. A fleet preventative maintenance program has been executed which will include scheduled maintenance for all front line vehicles. This is expected to reduce the time a vehicle is out of service for demand maintenance. MFES Fleet Maintenance 2018-2021 Business Plan & 2018 Budget C-19
The table below provides the implementation strategy for the maintenance of MFES infrastructure over the next four years.

   Initiative                            Description                                                                        Year

   Equipment Lifecycle                       •    Complete assessment which will identify the optimal time to replace       2018-2019
   Replacement Strategy                           equipment and associated capital costs (2018)
                                             •    Prioritize equipment replacement (2018)

   Fire Station Facility Audit               •    Complete station audit for all 20 stations (2018)                         2018-2021
                                             •    Prioritize rehab projects based on Infrastructure Renewal Strategy and
                                                  audit recommendations (2018)
                                             •    Begin rehab projects (2018-2021)

   Fleet Lifecycle Replacement               •    Continue to replace existing vehicles based on lifecycle schedule         2018-2021
   Strategy                                       (2018-2021)

   Major Equipment Testing,                  •    Ground and Ladder Aerial Testing                                          Annually
   Evaluation and Replacement                •    Pump Testing
                                             •    Nozzle maintenance and Hose Testing
                                             •    Extrication equipment
                                             •    Small engine testing and maintenance
                                             •    SCBA Filling Station Maintenance

C-20                                                                                             2018-2021 Business Plan & 2018 Budget
Managing Our Human Resources
Of the total staff complement in MFES, 97 per cent are unionized. This includes all of the front line operations, Fire and Life Safety
inspectors, public educators and plans examiners, training, mechanical and the majority of the administration staff. Of the 718 staff there
are 614 suppression (front line firefighting) staff. Suppression staff are hired in spring or fall recruit classes each year to replace vacancies
as a result of retirement.
Succession planning will be critical as nearly 20 per cent of staff are eligible for retirement in the next four years. MFES is working closely
with the City’s Human Resources talent management section to complete a workforce planning initiative.
Our Structure
ACHIEVE COMMUNITY SAFETY THROUGH
EDUCATION, ENFORCEMENT AND EMERGENCY BALANCE RESOURCES TO RISK THROUGH RISK
RESPONSE BASED PLANNING
Who: Public Educators, Fire Implement
Targeted public
Inspectors, Plans Examiners, recommendations
education Who: Senior Administration
Mechanics Dispatchers and from Comrehensive
programs Risk Assessment
Firefighters
Proactive fire safety Maintenance and Implement
Emergency Ensure front line
inspections and repair of front line React to changing recommendations
dispatch and apparatus and
plans examination apparatus and demographics and from the
response equipment are
for compliance equipment population growth Infrastructure
maintained
Renewal Strategy
PROMOTE FINANCIAL AND BUSINESS FOSTER A HEALTHY, SAFE , INCLUSIVE AND
SUSTAINABILITY RESPECTFUL WORKPLACE
Become a CFAI* Improve Community
Who: Senior Administration Accredited Fire Who: All Outreach
Service Programming
Our Develop
Talent and Implement internal
Identify Lean Improve attraction Support a respectful
monitor meaningful and external Develop a total
Critical Roles/Functions
Key Perfomance toand
projects Achieve
small Business Goals
communications wellness strategy
and recruitment and positive
improvements programs workplace
Indicators plans
2018-2021 Business Plan & 2018 Budget C-21*Commission on Fire Accreditation International
Critical Function Requirements of Function
Business Analytics Development, implementation and maintenance of key
performance indicators (KPIs) and other sectional data
Data Management & Reporting Maintenance and quarterly/annual reporting of data against
risk assessment recommendations and KPIs
Curriculum Development Officer development, succession planning
Inventory Management and Fleet and equipment purchasing, inventory and lifecycle
Logistics replacement
Fire Inspections and Public Proactive Fire Safety Inspections, targeted public education
Education programming based on recommendations from risk
assessment
Our Talent
Training is a critical component of MFES service delivery. MFES is committed to delivering services that educate the public, ensure code
compliance and respond to emergencies when required. In order to do all of those things safely and effectively, appropriate training is
essential.
In Emergency Operations, there are 614 staff at various levels that require ongoing skills development and upgrade. The Professional
Development and Accreditation section, in conjunction with ‘on shift’ training instructors, develop and deliver training programs that ensure
both the development of new skills along with the maintenance of existing skills.
These include such programs as:
• Fire Ground Operations
• Medical
• Auto Extrication
• Specialty Rescue (Confined Space/Trench/Hazmat)
• Apparatus Operation
• IT and Communications
C-22 2018-2021 Business Plan & 2018 BudgetMFES uses the Ontario Fire Administration Inc. (OFAI) Engagement Survey that MFES is working to improve is
Candidate Testing Services to test potential recruits. Through the ensuring leadership opportunities. Front line supervisors have
OFAI, potential candidates complete a three stage testing been provided the opportunity to participate in a Team
program that includes written testing, psychological profiling, Leadership course to provide them foundations of leadership and
medical and physical testing, and a skills evaluation. The skills coaching.
evaluation tests candidates to ensure they have a basic skillset
required to be a fire fighter.
MFES was the first career fire department in Ontario to offer the
Road to Mental Readiness (R2MR) program to its supervising
Fire Prevention and Life Safety staff consists of public officers through the Ontario Association of Fire Chiefs. This
educators, plans examiners and fire safety inspectors. Specialty program deals with the stigma that often surrounds mental
training consists of: illness and increases resiliency. MFES is using the National
Standard for Psychological Health and Safety to shape our
• Fire Inspector (levels 1-3)
mental health strategy and programs like the Road to Mental
• Public Educator (levels 1 and 2) Readiness will enable us to meet our legislated requirements
• Building Code and Fire Protection under Bill 163.
• Fire Investigator
Talent Needs
Staff are encouraged to apply for other related courses to Emergency Operations staff are hired through a recruiting
improve their skills in each area as well as upgrade to react to process once or twice a year depending on the number of
changing codes, building stock and new technologies. existing vacancies. These new recruits are to fill existing
vacancies as a result of retirements and/or long term absences.
Fleet mechanics for emergency vehicles require ongoing
There is a high demand for these jobs: therefore, there is no
training to ensure they maintain their existing skills and upgrade
difficulty attracting qualified candidates. Firefighters and
to adapt to emerging technologies. All mechanics are required to
Captains are promoted based on an internal competitive
have their heavy vehicle mechanic license, lift truck and sky jack
examination process.
training. Within this business cycle, MFES fire fleet mechanics
will be focussing on completing specialty Emergency Vehicle In 2019 MFES is requesting 20 new firefighters to staff new fire
Technician (EVT) training and specialty manufacturer training. station 120 currently under construction at Hurontario and
Eglinton.
Leadership
Capital Assets is in the process of completing an internal review
As the industry, technology and legislation change, MFES
and will be evaluating operating requirements and procedural
continues to evolve and look at future opportunities to build
changes throughout this business planning cycle.
leadership capability and create opportunities for all levels of
staff across the division. One of the areas within the Employee
2018-2021 Business Plan & 2018 Budget C-23Professional Development and Accreditation will play a key Proposed Full Time Equivalent Staffing
role in fulfilling the commitment to building leadership capacity Staffing change in 2018 includes the transfer of one staff from
and providing learning opportunities for staff. As mentioned the fire vehicle maintenance section to fire support services. In
above, this will include the development of a formal Officer 2019 there is a request to add 20 new firefighters in suppression
Development Program. A priority will be placed on officer for the operation of new fire station 120 at Hurontario and
training, accreditation and mental health and wellness. Eglinton which is currently under construction (BR# 2883) and
Continuing to develop officer training programs, wellness expected to be operational in fall 2019.
programs and identify new opportunities for service excellence is
critical to the future success of MFES.
Proposed Full Time Equivalent Staffing Distribution by Program
Program 2017 2018 2019 2020 2021
Fire Building Maintenance 3.0 3.0 3.0 3.0 3.0
Fire Support Services 43.5 44.5 48.5 48.5 48.5
Fire Vehicle Maintenance 11.0 10.0 12.0 12.0 12.0
Prevention 47.0 47.0 47.0 47.0 47.0
Suppression 614.0 614.0 634.0 634.0 634.0
Total Service Distribution 718.5 718.5 744.5 744.5 744.5
Note: Numbers may not balance due to rounding.
C-24 2018-2021 Business Plan & 2018 BudgetProposed Operating Budget
Office of Emergency Management and Fire and Efficiencies and Cost Savings
Emergency Services MFES expects a reduction in the cost of maintenance and parts
This part of the Business Plan sets out the financial resources of front line apparatus which is a result of the implementation of
required to deliver the proposed 2018-2021 Business Plan. a fleet lifecycle replacement program. The savings is estimated
Information is provided by major expenditure and revenue to be $100,000.
category as well as by program. The costs to maintain existing
service levels and operationalize prior decisions are identified
New Initiatives
separately from proposed changes. The budget for 2017 was
$105.2 million and the proposed budget for 2018 is $106.3 It is anticipated that MFES will be opening a new Fire Station at
million. Included in this amount is $621,000 related to the Hurontario and Eglinton in fall 2019. The staffing for this station
operation of the Office of Emergency Management (OEM). will be $1.4 million in 2019 then annualized in the following year.
Total Changes to Maintain Current Service Levels Proposed Changes to 2018 Net Operating Budget by
Category (000’s)
The impact of maintaining current service levels for Fire &
Emergency Services reflects an increase of $1.1 million for 2018. 1,400.0
Thousands
1,228.1
Highlights of the proposed budget changes are: 1,200.0
• Labour Costs are projected to increase by $868,172
1,000.0
• Annual testing and evaluation of equipment $160,600
800.0
• Radio Base Station Maintenance for the VCOM system and
portable radio technology change $130,000 600.0
• Recertification of Peer Support staff $13,280 400.0
• Technology improvements including mobile field technology, 200.0
automated staff and records management $105,000 0.0 0.0
0.0
(100.0)
(200.0)
Maintain Current Efficiencies and Cost New Initiatives New Revenues
Service Levels Savings
2018-2021 Business Plan & 2018 Budget C-25Operating Budget Details
The following table identifies the budgeted and forecasted operating expenditures and revenues for 2018-2021, as well as the 2017
Budget and 2016 Actuals by major program within the Service Area.
Proposed Budget by Program
2018
2016 2017 2019 2020 2021
Proposed
Description Actuals Budget Forecast Forecast Forecast
Budget
($000's) ($000's) ($000's) ($000's) ($000's)
($000's)
Expenditures to Deliver Current Services
Fire Building Maintenance 983 1,271 1,271 1,309 1,331 1,351
Fire Support Services 7,218 7,881 8,252 8,425 8,543 8,656
Fire Vehicle Maintenance 3,186 3,416 3,464 3,485 3,506 3,527
Prevention 5,443 6,700 6,740 6,913 7,042 7,144
Suppression 86,479 87,693 88,515 90,345 91,867 93,189
Total Expenditures 103,309 106,961 108,243 110,478 112,290 113,868
Revenues (1,531) (1,799) (1,952) (1,952) (1,952) (1,952)
Transfers From Reserves and Reserve Funds 0 0 0 0 0 0
New Initiatives and New Revenues 0 1,974 2,921 3,449
Proposed Net Budget Including New Initiatives & 101,778 105,162 106,290 110,500 113,259 115,366
New Revenues
Expenditures Budget - Changes by Year 1% 2% 2% 1%
Proposed Net Budget - Changes by Year 1% 4% 2% 2%
Note: Numbers may not balance due to rounding.
C-26 2018-2021 Business Plan & 2018 BudgetSummary of Proposed Budget
The following table shows the proposed budget changes by description and category. Costs (labour, operational costs, facility, IT and
support) and revenues are shown by category with the approved 2017 budget for comparison. The three columns to the far right of the
table show the totals proposed for 2018 and their dollar and percentage changes over 2017.
Summary of Proposed 2018 Budget
Operating Proposed
2017 Maintain Annualized 2018 %
Efficiencies Impact of New Special $ Change
Approved Current Prior Years Proposed Change
Description and Cost New Initiatives Purpose Over
Budget Service Budget Budget Over
Savings Capital And Levies 2017
($000's) Levels Decisions ($000's) 2017
Projects Revenues
Labour and Benefits 102,009 868 0 0 0 0 0 102,877 868 1%
Operational Costs 3,966 379 (100) 0 105 0 0 4,351 384 10%
Facility, IT and Support 985 29 0 0 0 0 0 1,015 29 3%
Total Gross 106,961 1,277 (100) 0 105 0 0 108,243 1,282 1%
Total Revenues (1,799) (154) 0 0 0 0 0 (1,952) (154) 9%
Total Net 105,162 1,123 (100) 0 105 0 0 106,290 1,128 1%
Summary of Proposed 2018 Budget and 2019-2021
2018
2016 2017 2019 2020 2021
Proposed
Description Actuals Budget Forecast Forecast Forecast
Budget
($000's) ($000's) ($000's) ($000's) ($000's)
($000's)
Labour and Benefits 98,432 102,009 102,877 106,979 109,699 111,771
Operational Costs 4,162 3,966 4,351 4,416 4,432 4,447
Facility, IT and Support 715 985 1,015 1,057 1,080 1,100
Total Gross 103,309 106,961 108,243 112,452 115,211 117,318
Total Revenues (1,531) (1,799) (1,952) (1,952) (1,952) (1,952)
Total Net 101,778 105,162 106,290 110,500 113,259 115,366
Note: Numbers may not balance due to rounding.
2018-2021 Business Plan & 2018 Budget C-27Proposed Cost Increase Required to Maintain Current Service Levels
The following table provides detailed highlights of budget changes by major cost and revenue category. It identifies the net changes to
maintain existing service levels, taking into account efficiencies, cost savings, and cost increases arising from prior year decisions.
2018
2017
Proposed
Category Budget Change Details
Budget
($000's) ($000's) ($000's)
($000's)
Labour and Benefits 102,009 102,877 868 Increase reflects labour adjustments & fringe benefits
Administration and Support Costs 985 1,015 29 Increased departmental administration cost allocation
Advertising & Promotions 45 45 0
Communication Costs 313 443 130 $115 cost increase for VCOM and JFCC Maintenance
$15 cell phone/mobile devices
Contractor & Professional Services 35 35 0
Equipment Costs & Maintenance 341 446 105 Operating impact of prior budget request for equipment rental & lease
Agreements
Finance Other (37) 0 37 Utility recovery from shared facility with Region of Peel
Materials, Supplies & Other Services 842 862 20 Station wear for new staffing at station 120
Occupancy & City Costs 869 857 (12) Utility budget reduction mainly for Hydro cost
Staff Development 268 292 24 Increase budget for staff training need
Transfers To Reserves and Reserve Funds 30 50 20 Increase annual transfer to reserve to fund the one time study
Transportation Costs 1,260 1,320 61 $160 budget increase for testing and evaluation of front line
apparatus and equipment, offset by $100 reduction in truck supplies
budget.
Subtotal - Other Operating 4,952 5,365 413
Total Revenues (1,799) (1,952) (154) ($84) Lease revenue from Peel Paramedics joined use of facility
($37) Utility recovery from shared facilities
($33) Increased revenue from MTO rate increase
Subtotal - Revenues (1,799) (1,952) (154)
Total 105,162 106,290 1,128
Note: Numbers may not balance due to rounding.
C-28 2018-2021 Business Plan & 2018 BudgetProposed New Initiatives and New Revenues
This table presents the costs by Budget Request (BR#) for proposed new initiatives. Detailed descriptions of each Request can be
found on the pages following the table. Over the course of the next four years, MFES is requesting funding for firefighters to staff new
fire station 120 which is scheduled for completion in 2019. This station is being built in the Hurontario and Eglinton area to support
growth and mitigate inadequate response times. Population growth is the driver behind the majority of the funding requests over the
next four years. Consideration will be also given to the units within MFES that support the front line operations such as mechanical,
equipment and training.
Proposed New Initiatives and New Revenues
2018
2018 2018 to
2018 2019 2020 2021 to
Proposed 2021
Description BR # FTE Forecast Forecast Forecast 2021
Budget Capital
Impact ($000's) ($000's) ($000's) FTE
($000's) ($000's)
Impact
New Initiatives
Fire Station 120- Hurontario and Eglinton Area 2883 0.0 0 1,394 2,088 2,552 20.0 0
Stores Clerk 2891 0.0 0 68 103 126 1.0 0
Fleet Mechanic 2892 0.0 0 97 148 159 1.0 0
Training and Development Staffing 2893 0.0 0 414 583 613 4.0 0
Total New Initiatives 0.0 0 1,974 2,921 3,449 26.0 0
Total New Initiatives and New Revenues 0.0 0 1,974 2,921 3,449 26.0 0
2018-2021 Business Plan & 2018 Budget C-29Budget Request #: 2883 Proposed Initiative Department Service Area Fire Station 120 – Hurontario and Community Services Department Fire & Emergency Services Eglinton Area Required Annual Operating Investment Impacts ($000s) 2018 2019 2020 2021 Gross Expenditures 0.0 1,394.3 2,087.5 2,551.6 Reserves & Reserve Funds 0.0 0.0 0.0 0.0 User Fees & Other Revenues 0.0 0.0 0.0 0.0 Tax Levy Requirements 0.0 1,394.3 2,087.5 2,551.6 * Net Change in $ 1,394.3 693.2 464.1 FTEs 0.0 20.0 20.0 20.0 *In each year, all values are cumulative, not incremental. Required Capital Investment Total Capital ($000s) 2017 & Prior 2018 2019 2020 2021 & Beyond Expenditures 995.0 0.0 0.0 0.0 0.0 Why Staff Recommend this Initiative This area is primarily residential where life risk is higher. This station will allow MFES to meet response time targets in this response area and assist meeting targets in surrounding areas. It will also position MFES to be able to appropriately service this area now and also considers the impact of future growth. C-30 2018-2021 Business Plan & 2018 Budget
Budget Request #: 2883

Details of Service Change

This station was identified in the 2010 Fire Master Plan as the number one priority and based on 2012 updated response data this station
remains the first priority. In 2012 there were 1,048 emergency incidents in this response area with 518 or 49 per cent being deficient.
Almost 50 per cent of those deficient calls are over the total response time target by more than 40 seconds. One of the most significant
concerns for emergency response is the impending growth in this area. High density construction is estimated to increase by more than
2,700 new apartment units and 650 row housing units in this area alone. With close to 50 per cent of the calls currently not meeting any
recognized standard, the growth will increase the number of deficient calls by approximately 30 per cent in 10 years.

Service Impact

This station will allow MFES to have a better distribution of its resources in this highly populated residential area and address existing
service deficiencies as well as addressing future growth. It will allow MFES to meet appropriate response time targets in this response
area now and in the future. The addition of new staffing and station locations will allow MFES to continually improve on our in-company
inspection program, tactical survey program and home safe home program and will improve our mandated public education programs.

2018-2021 Business Plan & 2018 Budget                                                                                                  C-31
Budget Request #: 2891

Proposed Initiative                                            Department                                Service Area

Stores Clerk                                                   Community Services Department             Fire & Emergency Services

Required Annual Operating Investment

Impacts ($000s)                                                                     2018         2019                2020                 2021

Gross Expenditures                                                                   0.0          68.1              102.7              125.8

Reserves & Reserve Funds                                                             0.0           0.0                   0.0               0.0

User Fees & Other Revenues                                                           0.0           0.0                   0.0               0.0

Tax Levy Requirements                                                                0.0          68.1              102.7              125.8

* Net Change in $                                                                                 68.1                  34.6              23.2

FTEs                                                                                 0.0           1.0                   1.0               1.0

*In each year, all values are cumulative, not incremental.

Required Capital Investment

Total Capital ($000s)                                        2017 & Prior          2018         2019               2020        2021 & Beyond

Expenditures                                                          0.0            0.0          0.0                0.0                   0.0

Why Staff Recommend this Initiative

Since the current position was created in 1999, staff complement has increased over 30 per cent, five front line vehicles have been
added, four new stations opened and a third district was created. As part of Future Directions Master plan the potential for additional
stations and associated apparatus and equipment have been identified which will significantly impact this unit.

C-32                                                                                              2018-2021 Business Plan & 2018 Budget
Budget Request #: 2891

Details of Service Change

MFES stores section is currently staffed by one (1) FTE who is responsible for approximately $8.5 million dollars of equipment. This
includes personal protective equipment, (bunker gear, SCBA, helmets, face pieces etc.) technical rescue equipment, hoses, nozzles and
many other items which are critical to fire operations. Corporate purchasing changes have downloaded acquisition responsibilities to this
section. Stores section provides critical support for maintaining daily operations across 20 remote stations from building supplies to
personal protective equipment.

Service Impact

Staff are completely dependent of the stores section to provide well maintained equipment and clothing to do their jobs effectively and to
ensure their safety at emergency scenes. This section currently has no redundancy so that in the event of absences there is little to no
coverage. As this position will be a junior position to the equip office it will allow for a better distribution of work and allow the equipment
officer to spend time on critical tasks such as purchasing and acquisitions that are either being left incomplete or require further
investment. This position will better allow for the appropriate assigned duties roles and responsibilities of the section.

2018-2021 Business Plan & 2018 Budget                                                                                                       C-33
You can also read