National Financial Inclusion Strategic Plan 2016-2020 - RESERVE BANK OF FIJI - Pacific Financial Inclusion Programme
←
→
Page content transcription
If your browser does not render page correctly, please read the page content below
National Financial
Inclusion Strategic Plan
2016–2020

                     RESERVE BANK
                            OF FIJI
NATIONAL FINANCIAL INCLUSION STRATEGIC PLAN | 2016-2020

OUR VISION
Improving the livelihoods of Fijians through inclusive financial services.

OUR OBJECTIVES
•   To enable all Fijians to have access to a range of affordable and
    appropriate financial services and products.
•   To support financial inclusion deepening through increased usage and
    quality of financial services and products.
•   To ensure all Fijians have sufficient financial competencies to better
    utilise the financial services available and foster improved consumer
    protection.
•   To grow financial inclusion amongst Fijians through a multi-stakeholder
    and collaborative approach.

                                       b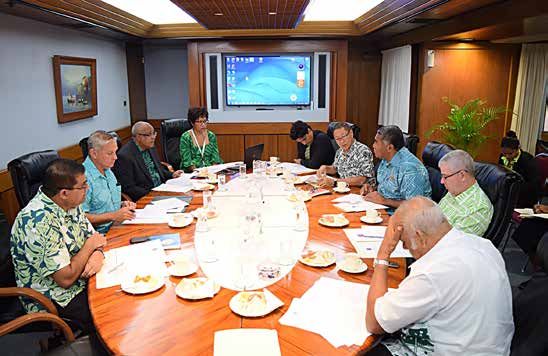
NATIONAL FINANCIAL INCLUSION STRATEGIC PLAN | 2016-2020

Foreword

This National Financial Inclusion Strategic Plan 2016-2020 provides a roadmap to further advance our
financial inclusion journey and the effective collaboration and partnership of all our stakeholders.

The preparation of this Strategic Plan involved significant reflection and consultation with relevant
financial inclusion stakeholders, the National Financial Inclusion Taskforce (NFIT) and its four working
groups. The Strategic Plan, which will guide the work of the NFIT, addresses seven key priority areas
pivotal to our progress in financial inclusion.

Our vision is “Improving the livelihoods of Fijians through inclusive financial services” and to us it means
that irrespective of their social or economic status, gender or age, we want to ensure that every Fijian
has access to basic financial services. To the financially excluded population, having access and usage
of financial services and products opens up opportunities for a better and higher living standard. It
enables them to plan ahead and better manage their finances to put food on the table, save and invest
for a better future, build a house or protect their loved ones and belongings from an unexpected disaster
or crisis. Our vision also recognises the need to close the gender disparity. Our objectives sit within a
structure that integrates strategies to improving access and enhancing usage and quality to improve the
livelihoods of all Fijians.

I thank all our financial inclusion partners for collaborating with the Reserve Bank of Fiji with every effort
to improve the livelihoods of our Fijian people through an inclusive financial system.

.........................................
Barry Whiteside
Governor and Chairman, National Financial Inclusion Taskforce

                                                                      c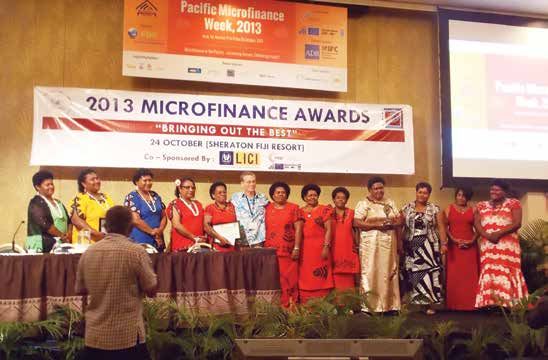
NATIONAL FINANCIAL INCLUSION STRATEGIC PLAN | 2016-2020

Reserve Bank of Fiji New Commitments to
the Maya Declaration
 Policy Areas                     Concrete Targets
 Overall National Goals           o    Increase access to formal financial services from 64% to 85% (by 130,000) of the adult population,
                                       of which 50% are women by the year 2020.
                                  o    Increase the percentage of youth accounts with formal financial institutions from 51% to 80%
                                       (25,000) by the year 2020.
                                  o    Establish a policy framework for SME development.
                                  o    Grow SME contribution to GDP by 5% by the year 2020.
 Digital Financial Services       o    Increase the percentage of adults using mobile money from 2% to 15% (79,000) by the year 2020.
                                  o    Increase Government digital payments from 75% to 90% by the year 2020.
 Financial Education              o    Integrate entrepreneurial training into tertiary education by the year 2020.
 Green Finance                    o    Work with partners on developing and promoting sustainable business models to support
                                       communities’ response to climate change.
 Data Measurement                 o    Formulate and report on the SME Base Set Indicators by the year 2020.
                                  o    Enhance data measurement and analysis by collecting disaggregated data on gender, age, and
                                       ethnicity by the year 2020.
September 2016

    Governor Whiteside receives the inaugural Maya Declaration Award at the 5th AFI GPF at Kuala Lumpur, Malaysia on September 2013

                                                                    d
NATIONAL FINANCIAL INCLUSION STRATEGIC PLAN | 2016-2020

Table of Contents
List of Acronyms                                                                           ii
Acknowledgment                                                                            iii
Executive Summary                                                                         iv
1.    Background                                                                          1
2.    Guiding Principles                                                                  3
3.    International Comparisons in Financial Inclusion                                    4
3.1   Comparative Analysis Against Developing Countries                                    4
3.2   Regional Comparison                                                                  5
4.    Financial Inclusion in Fiji                                                         6
4.1   Financial Inclusion Strands                                                          6
4.2   Access to Financial Services and Products                                            7
4.3   Financial Education                                                                  8
4.4   Digital Financial Services (DFS)                                                     8
4.5   Credit                                                                               9
4.6   Savings                                                                              9
4.7   Remittances                                                                          9
4.8   Insurance                                                                            9
5.    Vision and Objectives of this Strategic Plan                                        10
5.1   Our Vision                                                                          10
5.2   Objectives                                                                          10
6.    Financial Inclusion Strategic Plan 2016-2020                                        11
6.1   Strategic Goal 1 - Empowerment of Women, Youth and those living with Disabilities   11
6.2   Strategic Goal 2 - Financial Infrastructure                                         12
6.3   Strategic Goal 3 - Digital Financial Services                                       13
6.4   Strategic Goal 4 - Services and Products                                            14
6.5   Strategic Goal 5 - Financial Literacy and Consumer Protection                       14
6.6   Strategic Goal 6 - Private/Public Sector Collaboration and Partnership              15
6.7   Strategic Goal 7 - Data Measurement                                                 15
7.    Stakeholders                                                                        16
8.    Coordination, Monitoring and Evaluation                                             17
8.1   Coordinating Committee                                                              17
8.2   Monitoring and Evaluation Framework                                                 19
Annex                                                                                     23
1     Highlights and Achievements from the 2010-2014 Strategy                             24
2     NFIT and Working Group Representatives                                              26

                                                      e
NATIONAL FINANCIAL INCLUSION STRATEGIC PLAN | 2016-2020

List of Acronyms

ABIF     Association of Banks in Fiji                 MFIs       Microfinance Institutions
ADB      Asian Development Bank                       MNOs       Mobile Network Operators
AFI      Alliance for Financial Inclusion             MOA        Ministry of Agriculture
AML      Anti-Money Laundering                        MOE        Ministry of Education
ATM      Automated Teller Machine                     MOEc       Ministry of Economy
BFA      Bankable Frontier Associates                 MiTA       Ministry of iTaukei Affairs
CBs      Commercial Banks                             MITT       Ministry of Industry, Trade &
                                                                 Tourism
CCoF     Consumer Council of Fiji
                                                      MLGHE      Ministry of Local Government,
CFT      Counter Financing Terrorism
                                                                 Housing & Environment
Co-ops   Cooperatives
                                                      MRMDNDM Ministry of Rural & Maritime
FBoS     Fiji Bureau of Statistics                            Development and National Disaster
                                                              Management
FCC      Fiji Commerce Commission
                                                      MSMEs      Micro, Small and Medium
DFS      Digital Financial Services
                                                                 Enterprises
DSS      Demand Side Survey
                                                      MWCPA      Ministry of Women, Children &
EFTPOS   Electronic Funds Transfer at Point of                   Poverty Alleviation
         Sale
                                                      MYS        Ministry of Youth & Sports
FinED    Financial Education Program
                                                      NFIT       National Financial Inclusion
FIU      Fiji Intelligence Unit                                  Taskforce
FLWG     Financial Literacy Working Group             NGOs       Non-Government Organisations
FNPF     Fiji National Provident Fund                 PFIP       Pacific Financial Inclusion
                                                                 Programme
FRCA     Fiji Revenue and Customs Authority
                                                      PFTAC      Pacific Financial Technical
FSP      Financial Service Providers
                                                                 Assistance Centre
GPF      Global Policy Forum
                                                      PIRI       Pacific Islands Regional Initiative
IFC      International Finance Corporation
                                                      RBF        Reserve Bank of Fiji
iTLTB    iTaukei Land Trust Board
                                                      SWG        Statistics Working Group
IIWG     Inclusive Insurance Working Group
                                                      UNCDF      United Nations Capital
ISPWG    Inclusive Services and Products                         Development Fund
         Working Group
                                                      WB         World Bank
KYC      Know Your Customer
MDF      Market Development Facility

                                                 ii
NATIONAL FINANCIAL INCLUSION STRATEGIC PLAN | 2016-2020

Acknowledgment

The Reserve Bank of Fiji (RBF) wishes to acknowledge and thank all the stakeholders, development
partners and peers that contributed to the second Financial Inclusion Strategic Framework for Fiji.

We would like to make special mention of the Alliance for Financial Inclusion (AFI), Pacific Financial
Inclusion Programme (PFIP), the Australian Department of Foreign Affairs and Trade, Bankable Frontier
Associates (BFA), Government of Fiji in particular the Fiji Bureau of Statistics (FBoS) and the members
of the Statistics Working Group (SWG) under the National Financial Inclusion Taskforce (NFIT) for their
contribution to the Demand Side Survey (DSS).

We also acknowledge the support from our peers, Pacific Islands Regional Initiative (PIRI), Bank of
Tanzania and AFI for their feedback. In drafting this document, we considered the financial inclusion
plans from Nigeria, Philippines, the Republic of Burundi, Tanzania and Turkey.

We also wish to thank our stakeholders for their feedback at the consultation workshop in November
2015, as well as the immense contribution from the NFIT and its working groups: Financial Literacy,
Inclusive Insurance, Inclusive Services and Products1 and Statistics Working Groups.

1
    Formerly known as the Microfinance Working Group.

                                                        iii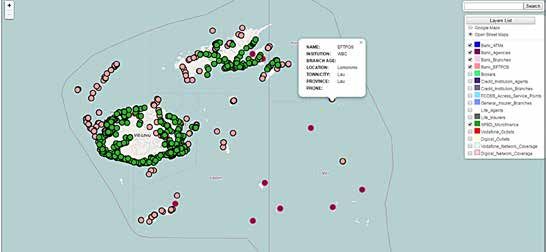
NATIONAL FINANCIAL INCLUSION STRATEGIC PLAN | 2016-2020

Executive Summary

Financial inclusion has become an important policy and development agenda for many developing
countries. The concept of inclusive finance is at the heart of most Government initiatives to level the
playing field to support individuals and communities efforts, particularly the poor and disadvantaged, to
work themselves out of poverty and contribute to economic growth.

Fiji is amongst the growing number of developing and emerging countries that have made public
measurable commitments under the AFI’s Maya Declaration to achieve financial inclusion.

The National Financial Inclusion Strategic Plan 2016-2020 hereinafter referred to as the “Strategic Plan”
continues on the platform set by the first national strategy (2010-2014). This is a five year plan with
measurable targets and part of a larger national agenda to contribute to a deep, competitive and
stable financial system: an inclusive system that provides all Fijians, irrespective of economic and social
background, an equal opportunity to improve their livelihoods.

According to the 2015 DSS2 more than 36 percent of the adult3 population in Fiji had not used the formal
financial system in the prior 12 months. This Strategic Plan sets out a road map to move those using the
informal sector to the formal sector. The focus will be on increasing the formally served adult population
from 64 percent to 85 percent4, of which 50 percent are women. Priority will also be given to those living
with disabilities, youth and those in the rural and maritime areas.

Our vision is “Improving the livelihoods of Fijians through inclusive financial services” and in doing so we
aim to strengthen demand, improve equality and enhance social and economic conditions for financial
stability and growth in Fiji.
In addressing the financial inclusion goals over the next five years, the strategic plan will focus on:
1.    Expanding account ownership among the underserved;
2.    Ensuring the regular use of accounts with financial service providers including mobile accounts;
3.    Enhancing the range and quality of financial services and products;
4.    Creating an enabling regulatory environment to support innovation;
5.    Continuing and building on the financial literacy programmes established in the first Plan and
      including entrepreneurial training; and
6.    Promoting the development of the MSME sector.

2
  “Financial Services Demand Side Survey of Fiji”, Reserve Bank of Fiji, 2015.
3
  Adult population refers to those who are 15 years of age and older.
4
  This involves reaching out to at least 130,000 adult population.
                                                                                 iv
NATIONAL FINANCIAL INCLUSION STRATEGIC PLAN | 2016-2020
1. Background
Financial inclusion herein is defined as an enabling environment where all Fijian adults, irrespective
of where they live, socio-economic status or gender, have access to, and are able to effectively use a
broad range of affordable and appropriate financial services and products that are complemented by
appropriate financial education and consumer protection policies.
The RBF is committed to and has taken a strategic lead in driving financial inclusion in Fiji. This journey
began with a National Microfinance workshop in late 2009 to take stock, consult and strategise on
a way forward for the development of financial inclusion in Fiji. The forum included representatives,
from public and private sector, civil society groups, donor agencies and development partners. This
collaborative approach has been the underlying and instrumental factor contributing to the success of
Fiji’s financial inclusion efforts.
One of the key outcomes of the workshop was the establishment of the NFIT. This is the apex body
responsible for driving, coordinating, facilitating and monitoring financial inclusion initiatives in Fiji.
Amongst other goals, and to set some quantifiable measures, the NFIT was assigned a mandate to reach
150,000 unbanked Fijians by 2014.
In 2011, the RBF took the national commitment further and was one of 17 countries that made a global
measureable commitment to the Maya Declaration at the 3rd AFI Global Policy Forum (GPF) in Cancun,
Mexico. The four areas of focus were: (1) accessible and appropriate financial education and consumer
protection to empower consumers; (2) appropriate and affordable financial services and products to the
unbanked population; (3) a comprehensive data upgrade with relevant surveys; and (4) provision of an
enabling regulatory environment.
Significant achievements have been made on most of the agreed targets. These included: the
integration of financial education (FinED) into the school curriculum at both primary and secondary
levels; the introduction of mobile money; policies for commercial banks to setup microfinance units
and extend financial services to the poor, low income households and to micro and small enterprises;
branchless banking guidelines to commercial banks for reliable and sustainable delivery of financial
services to communities where there is no bank presence and services are difficult to access; public
awareness and community outreach through a variety of initiatives such as the national microfinance
awards and financial inclusion expositions; and the adoption of international financial inclusion indicators
and geo-spatial mapping of financial access points that monitor geographical coverage of financial
inclusion initiatives.
In recognition of its monitoring and reporting on its global commitment towards financial inclusion, the
RBF was awarded the inaugural Maya Declaration Award at the 5th AFI GPF in Kuala Lumpur, Malaysia in
2013. Details of the achievements are noted in Annex 1.
1NATIONAL FINANCIAL INCLUSION STRATEGIC PLAN | 2016-2020
In spite of these achievements, there still remains a lot to be done to ensure more of Fiji’s adult
population are financially included.
The financial inclusion journey has provided stakeholders with opportunities and challenges that have
helped shape the financial inclusion framework in Fiji. Key factors that have contributed to the drive of
this development are: the strong leadership and convening power of the RBF; the buy-in and effective
collaboration and support from stakeholders; and the recognition of the need for data for effective
monitoring and evaluation of goals.
The lessons learnt and progress made from the first strategy have set a sound foundation for building a
national financial inclusion strategy and will be the basis for this new Strategic Plan.
Taking financial inclusion to rural areas
2NATIONAL FINANCIAL INCLUSION STRATEGIC PLAN | 2016-2020
2. Guiding Principles
The guiding principles that have influenced this national financial inclusion policy framework take into
account the nine principles that have been encapsulated by the G20 Financial Inclusion Experts Group
which are:
• Leadership - cultivate a broad based Government commitment to financial inclusion to alleviate
poverty;
• Diversity - implement policy approaches to promote competition and market based incentives
for delivery of sustainable financial services;
• Innovation - promote technological and institutional innovation as a means for expanding
financial access and usage, including infrastructure;
• Protection - encourage a comprehensive approach to consumer protection that recognises the
roles of government, providers and consumers;
• Empowerment - develop financial literacy and financial capability;
• Cooperation - create an institutional environment with clear lines of accountability and
coordination within government , and encourage partnerships and direct consultation;
• Knowledge - utilise improved data to make evidence based policy, measure progress and
consider an incremental “test and learn” approach by both regulators and service providers;
• Proportionality - build a policy and regulatory framework that is proportionate with the risks
involved in developing innovative services and products that are based on the understanding of
the gaps and barriers in the existing regulations;
• Framework - consider the following in the regulatory framework: reflecting international
standards, national circumstances and support for a competitive landscape and appropriate,
flexible risk based Anti-Money Laundering (AML) and Counter Financing of Terrorism (CFT)
conditions for the use of agents as a customer interface; a clear regulatory regime for
electronically stored value; and market based incentives to achieve the long term goal of broad
interoperability and interconnection.
3NATIONAL FINANCIAL INCLUSION STRATEGIC PLAN | 2016-2020
3. International Comparisons in Financial
Inclusion
Financial inclusion is now globally recognised and many countries have adopted it as an important
development agenda. The following sections provide a comparative analysis against developing
countries and the Pacific region.
3.1 Comparative Analysis Against Developing Countries
Formal financial inclusion is significantly lower in the Philippines and Indonesia, as measured by the
World Bank’s Global Findex survey, when compared to the findings from Fiji’s DSS. However, Fiji’s level of
inclusion falls slightly behind that of other upper-middle income countries included in the Global Findex
survey, particularly in rural areas and for female adults.
Figure 1: Financial Inclusion in Fiji compared with Philippines, Indonesia and Upper and Lower-income Countries
46%
39%
rural (% age 15+) 69%
29%
25%
68%
48%
male (% age 15+) 74%
22% 35%
52%
36%
female (% age 15+) 67%
37%
34%
60%
42%
(% age 15+) 70%
36%
28%
0% 10% 20% 30% 40% 50% 60% 70% 80%
Fiji Lower-middle income countries Upper-middle countries Indonesia Philippines
Source: Reserve Bank of Fiji on Financial Services Demand Side Survey, 2015
4NATIONAL FINANCIAL INCLUSION STRATEGIC PLAN | 2016-2020
3.2 Regional Comparison
At a regional level as depicted in Figure 2 below, inclusion strands vary widely with Fiji having the highest
percentage of banked adults amongst both males and females. However the gender disparities are
quite significant in Fiji, where women are 16 percentage points less likely to have a bank account
compared to men. In Solomon Islands, the gender disparity is 12 percentage points. This exceeds the
average gap of nine percentage points as measured in other developing countries.5 Samoa on the other
hand has slightly more banked female adults as compared to males, even though policymakers and
providers have yet to make dedicated efforts to include women. Regional peers such as Solomon Islands
and Papua New Guinea have recently made national commitments to include women in the banking
system.
Figure 2: Financial Inclusion in Fiji compared to Solomon Islands and Samoa
20%
40%
female (% 15+)
52%
32%
38%
male (% 15+)
68%
26%
39%
(% 15+)
60%
0% 20% 40% 60% 80%
Solomon Islands Samoa Fiji
Source: Pacific Financial Inclusion Programme on Benchmarking Financial Inclusion in Fiji, Samoa and Solomon Islands, 2015
5
http://www.pfip.org/resources/uploads/attachments/documents/PIRI%20Cross%20Country%20Reportv2.pdf
5NATIONAL FINANCIAL INCLUSION STRATEGIC PLAN | 2016-2020
4. Financial Inclusion in Fiji
4.1 Financial Inclusion Strands
The status of financial inclusion in Fiji is outlined below. The data has been extrapolated from the 2015
DSS report.
Figure 3: Financial Inclusion Strands
Banked 60%
Financially
368,463
Served 73%
448,297
Adult Population Other Formal 4%
614,105 24,564
Financially
Excluded 27%
Informal 9%
165,808
55,270
Source: Reserve Bank of Fiji on Financial Services Demand Side Survey, 2015
Figure 4: Financial Inclusion Strands Definition
Banked Other Formal Informal Excluded
Adults who have Adults who used Adults who used Adults who have
a formal bank the service of savings clubs, not used any
account whether a credit union, moneylenders, of the services
they are using it microfinance credit from shop mentioned in
or not. institution, or hire purchase the other three
superannuation, in the last 12 categories
investments, months. but may have
insurance borrowed or lent
and finance to friends and
companies in family.
the past 12
months.
6NATIONAL FINANCIAL INCLUSION STRATEGIC PLAN | 2016-2020
Table 1: Financial Inclusion Strands by Division
Financial % of Adult Adult Central Western Northern Eastern
Strands Population Population
Total Population 614,105 252,169 239,023 96,495 26,418
Banked 68% 58% 51% 41%
60 368,463 170,220 138,633 48,778 10,832
Other Formal 5% 4% 4% 3%
4 24,564 11,340 8,366 4,198 660
Informal Only 5% 5% 25% 16%
9 55,269 13,693 12,979 24,257 4,341
Excluded 24% 33% 21% 40%
27 165,808 57,623 77,682 19,830 10,673
Source: Reserve Bank of Fiji and Fiji Bureau of Statistics
4.2 Access to Financial Services and Products
In Fiji more than a third of the adult population do not have access to formal financial services and
exclusion is typically highest amongst women, youth (aged 15–30), and those living in the rural and
maritime areas. The percentage of exclusion is highest in the Eastern division at 40 percent and the
Western division in terms of population size. Generally, financial access points, as expected, are clustered
mainly around urban centres.
Whilst all urban administrative units6 have an access point, 12 percent of rural administrative units
(accounts to 10 administrative units) do not have any formal financial access point. The adult
Fiji’s Financial Services Access Points Map
6
Administrative Units are measured at “Tier 4” level in terms of urban and rural districts.
7NATIONAL FINANCIAL INCLUSION STRATEGIC PLAN | 2016-2020
population within the excluded administration units account to less than one percent of the total adult
population. Access to formal financial services is a challenge to those in the rural and maritime areas as
noted in the DSS report. Rural respondents on average travel 27km to reach the nearest bank branch,
24.9km to reach an Automated Teller Machine (ATM), 13.6km to reach a bank agent and 17km to reach a
mobile agent. These areas have high concentrations of agricultural workers with irregular incomes.
4.3 Financial Education
Lack of financial knowledge, understanding and awareness is noted to be a significant barrier to
accessing formal financial services. A 2011 Fiji Financial Competency Survey supports the DSS findings,
highlighting that low-income households displayed low levels of financial competence in managing
the financial decisions of their households.7 The lack of understanding about the formal financial sector
along with lack of suitable products to meet the needs of the poor, further limits their opportunities to
engage with the formal financial sector.
The Financial Literacy Mascot, Vuli the Vonu with Students
4.4 Digital Financial Services (DFS)
The global spread of mobile communications has created the opportunity to harness digital technology
to increase access to financial services and enhance economic activity. In Fiji, use of digital financial
services is very low. The DSS reports that less than 10% of the respondents use mobile banking
7
Sibley, Jonathan. “The Financial Competence of Low-Income Households in Fiji”. Pacific Financial Inclusion Programme, UNDP Pacific Centre, 2012.
8NATIONAL FINANCIAL INCLUSION STRATEGIC PLAN | 2016-2020
and internet banking whilst only 2.2% of the respondents actively use mobile money”. Two studies
conducted by PFIP on mobile money attitudes in 2012 and DFS in 2014, found very low usage of digital
financial services among respondents and not much appears to have changed since then.8
4.5 Credit
Use of credit is relatively low in Fiji where 32 percent of DSS respondents confirmed to have taken a
loan in 2014 compared to similar upper-middle income countries at 37.7 percent.9 Fijians rely primarily
on informal credit sources such as friends, family and shopkeepers. According to the DSS findings,
close to 50 percent of credit users are from shop credit and hire purchases (30 percent alone use hire
purchases), 6 percent from credit unions and MFIs, 17 percent from commercial banks and 5 percent
from finance companies.
4.6 Savings
According to the DSS, 60 percent of the respondents have a bank account; however, more than 50
percent of those that have a bank account reported to be saving at home whilst 38 percent are
saving with the formal sector. It is also noted that only 27 percent use superannuation funds to save for
retirement. This is mainly amongst urban adults and those with formal employment.
4.7 Remittances
Remittances received by Fijians were approximately 5.4 percent of Fiji’s Gross Domestic Product or
US$234.2 million in 201510 and represent Fiji’s second largest foreign exchange earner after tourism.
About 23 percent of Fijians receive money from other parts of Fiji or from abroad. It is also noted that
more women receive remittances compared to men.
Examining the domestic channels used to remit funds, it is noted that the Post Office is the more
common channel (51%) even though this is a more expensive option compared to mobile money at
only three percent.
4.8 Insurance
Insurance provides safety and security against uncertainties and is an equally important product for
driving financial inclusion. Overall, it is estimated that only around 12 percent of Fiji’s adult population
have some form of insurance cover. Similar to other formal products, insurance ownership is higher
among those with formal employment and in urban areas. Interestingly 25 percent of the DSS
respondents that do not have insurance do not know what insurance means and 40 percent said they
do not need insurance. This implies that there is a low level of understanding of insurance.
8
Subramanian, R.” Mobile Money Attitudes and Perception Omnibus Survey”. February 2012, PFIP Study on Digital Financial Services in Fiji, 2014.
9
Global Financial Inclusion Database.
10
Reserve Bank of Fiji estimates
9NATIONAL FINANCIAL INCLUSION STRATEGIC PLAN | 2016-2020
5. Vision and Objectives of this Strategic Plan
5.1 Our Vision
“Improving the Livelihoods of All Fijians Through Inclusive Financial Services”
5.2 Objectives
1. To enable all Fijians to have access to a range of affordable and appropriate financial services and
products.
2. To support financial inclusion deepening through increased usage and quality of financial services
and products.
3. To ensure all Fijians have sufficient financial competencies to better utilise the financial services
available and foster improved consumer protection.
4. To grow financial inclusion amongst Fijians through a multi-stakeholder and collaborative
approach.
10NATIONAL FINANCIAL INCLUSION STRATEGIC PLAN | 2016-2020
6. Financial Inclusion Strategic Plan 2016-2020
This Strategic Plan is part of Fiji’s five and 20 year National Development Plan which have the guiding
philosophy to “Build a Better Fiji for All”. Government has acknowledged the growing disparities that
currently exist in the access of our citizens to basic services and economic opportunity”.11 Government
has also committed to building an inclusive and more equitable society and fundamental to this focus
on inclusive development is the motto that “no one is left behind”.
The Strategic Plan sets out a clear agenda for financial inclusion. Based on the recent findings from the
DSS report, an estimated 221,077 (36 percent) of the adult population are underserved. These are Fijians
in the informal sector and the excluded as defined by the financial inclusion strands in Figure 3.
The overall target of this Strategic Plan is to increase the formally served adult population from
64 percent to 85 percent (by 130,000 adults), of which at least 50 percent are women. In terms of
geographical distribution, it is anticipated that six percent are to be from the Eastern Division, 22
percent from the Northern Division, 40 percent from the Western Division and 32 percent from the
Central Division.
This Strategic Plan focuses on seven key areas: Empowerment of Women, Youth and those living
with Disabilities; Financial Infrastructure; Digital Finance; Services and Products; Financial Literacy and
Consumer Protection; Public/Private Sector Partnership; and Data Measurement.
6.1 Strategic Goal 1 - Empowerment of Women, Youth and those living
with Disabilities
Empower women, youth and those living with disabilities through improved access, usage and quality of
financial services and products.
6.1.1 Increase membership, affiliation and partnerships of target groups with Government, Non-
Government Organisations (NGOs) and civil society organisations.
6.1.2 Link income-generating activities including Micro, Small and Medium Enterprises (MSMEs) and
targeted programs in the various economic sectors including equal employment opportunities
at all levels in the private and public sectors.
6.1.3 Empower target groups through training on financial competency. Training can link to
leadership, awareness of human rights issues, health and quality of life through partnership,
networking and coordination with women, youth and disabled groups and increased
collaboration and partnership with NGOs.
6.1.4 Inculcate a culture of savings.
6.1.5 Leverage technology and digital financial services especially amongst young people who are
digitally savvy to enable this target group to maximise their economic participation.
11
Fiji National Development Plan 2016-2020
11NATIONAL FINANCIAL INCLUSION STRATEGIC PLAN | 2016-2020
6.1.6 Develop innovative and tailor-made services and products to fully harness economic
opportunities of this group.
6.1.7 Encourage innovation and relaxation of financial rules and procedures (AML/KYC) to address
barriers faced by these groups.
Late, Mr. Reuben Summerlin and Recipients of the National Microfinance Awards
6.2 Strategic Goal 2 - Financial Infrastructure
Develop and strengthen the financial sector.
6.2.1 Collaborate with development partners on diagnostic exercises and evaluate the assessment
of financial inclusion and financial infrastructure, including reviewing the design process,
prioritisation, and sequencing of policies and legal reforms and of key interventions.
6.2.2 Implement a regulatory framework that is conducive to support financial infrastructure and
institutional strengthening.
6.2.3 Enhance the range of financial services and products by strengthening existing financial
service providers such as: microfinance institutions (MFIs), Credit Unions and Co-operatives,
as well as facilitating the entry of additional financial service providers (FSPs), for the benefit of
consumers.
12NATIONAL FINANCIAL INCLUSION STRATEGIC PLAN | 2016-2020
6.2.4 Ensure there is effective collaboration between Government and the private sector in regard to
improving access and usage of financial services and products in particular to rural and remote
areas. This includes specific considerations for incentives where appropriate.
6.2.5 Advocate institutional strengthening by aligning the human resource and capacity training
needs to international best practices.
6.2.6 Ensure consistency in KYC requirements across all financial service providers and ensure that
they are revised to fit the changing market.
6.3 Strategic Goal 3 - Digital Financial Services
Creating a digital financial ecosystem that enhances the use of DFS.
6.3.1 Review product and services design and delivery of DFS in Fiji with a view to increasing usage.
6.3.2 Promote retail payment efficiency and an environment conducive to support consumer
protection.
6.3.3 Implement interoperability between all FSPs and mobile network operators.
6.3.4 Promote the use of DFS through e-money channels and Near Field Communication devices to
facilitate retail payments and cash in and cash out services.
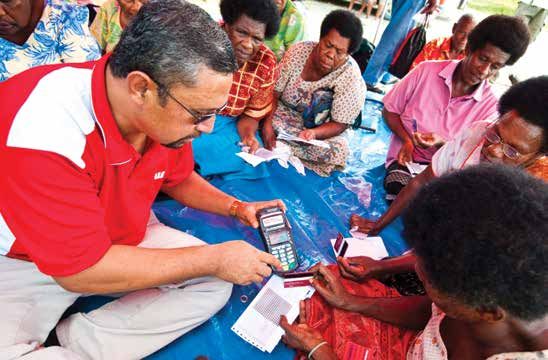
Digitising Fiji’s social welfare payments
13NATIONAL FINANCIAL INCLUSION STRATEGIC PLAN | 2016-2020
6.3.5 Adopt or maintain proportionate and risk based regulatory supervisory framework where
necessary, to develop financial services market whilst maintaining sufficient consumer
protection standards.
6.3.6 Design education and awareness programs on DFS for consumers and service providers.
6.4 Strategic Goal 4 - Services and Products
To provide financial services and products that is relevant, affordable and accessible.
6.4.1 Pilot programs between private and public sectors that link up products and channels for
delivery of financial services and products including insurance, retirement savings for the
informal sector and credit for MSMEs.
6.4.2 Support competition and market based incentives for delivery of sustainable financial services
and products.
6.4.3 Advocate and support the collaboration between the public and private sectors and
development partners particularly with information sharing and research on services and
products design and quality standards.
6.4.4 Assess and determine appropriate financial services and products for target groups and
tailored financial literacy programs and messages.
6.4.5 Encourage and support innovative concepts and solutions from financial service providers and
others that expand financial penetration in Fiji.
6.4.6 Provide support for the development of green financial services and products. This includes
services and products designed for individuals, households and MSMEs that reduce negative
environmental impacts or provide environmental benefits.
6.4.7 Advocate and ensure that services and products are offered with appropriate consumer
messages or instructions in a language that is understood by the consumer.
6.5 Strategic Goal 5 - Financial Literacy and Consumer Protection
Improve and expand responsible and relevant financial literacy initiatives.
6.5.1 Strengthen and enhance the coordination and development of effective financial literacy
programs for the formal and informal sectors through partnerships and collaboration amongst
the private and public sector.
6.5.2 Review and ensure there are effective market conduct measures in place and support
appropriate consumer protection mechanisms.
6.5.3 Develop innovative and sustainable training programs with consistent messaging.
6.5.4 Review, monitor and strengthen the FinED and embed financial education into the curriculum
of teacher training at tertiary institutions.
14NATIONAL FINANCIAL INCLUSION STRATEGIC PLAN | 2016-2020
6.5.5 Create and support initiatives for adequate provision for retirement.
6.5.6 Develop a curriculum to incorporate entrepreneurial learning and skills development as a
scale-up program to FinED at tertiary level.
6.5.7 Advocate and support services and products that strengthen socio-cultural education of
responsible environmental stewardship and civic responsibility.
6.6 Strategic Goal 6 - Private/Public Sector Collaboration and
Partnership
Strengthen private public sector partnership buy-in and ownership.
6.6.1 Integrate national financial inclusion strategy with national development plans, including the
development of the MSME sector.
6.6.2 Strengthen dialogue between stakeholders and their roles.
6.6.3 Collaborate on the development and delivery of viable and sustainable services and products
to the underserved.
6.6.4 Encourage where appropriate shared services and infrastructure, the utilisation of common
delivery platform or mechanisms to reduce costs and promote greater efficiency in the
provision of financial services to the public.
6.6.5 Enhance engagement and two-way information flow.
6.7 Strategic Goal 7 - Data Measurement
Bridging the data gap – getting more, better and credible data.
6.7.1 Ensure collection of disaggregated data (gender, age, ethnicity, disability) on the financial
sector. Existence of disaggregated data is critical for identifying and quantifying barriers as well
as developing appropriate policies and products to meet the needs of the underserved.
6.7.2 Collaborate and engage relevant stakeholders to share data and continuously explore new
data sources to enhance the financial inclusion database.
6.7.3 Annually review and make available to the public the updated financial inclusion maps.
6.7.4 Continuously review the existing financial inclusion data measurement framework to ensure its
relevancy.
6.7.5 Use a unique identifier to improve on data capture and to ensure integrity and quality.
6.7.6 Data analytics and interpretation – obtain client oriented data to drive usage.
15NATIONAL FINANCIAL INCLUSION STRATEGIC PLAN | 2016-2020
7. Stakeholders
Financial inclusion requires a multi stakeholder integrated approach and aims to bring about positive
and measurable outcomes. The effective collaboration of public and private sector partners are key
aspects of this policy framework.
Government of Fiji and the RBF has embedded financial inclusion into the draft national mid and long
term development plan12 and this provides opportunities for the public and private sector to align their
goals and plans for economic growth and stability.
Key stakeholders and roles are noted below; however this is not an exhaustive list.
Table 2: Financial Inclusion Key Stakeholders
Categories Institutions Roles/Responsibilities
Regulatory Authority RBF, FCC, FIU - Ensure enabling regulatory and supervisory
framework in place for financial inclusion
- Coordinate and monitor financial inclusion
initiatives
- Provide advice to government and providers on
financial inclusion initiatives and developments
- Ensure compliance with financial inclusion policies
NFIT FLWG, IPSWG, IIWG, SWG - Drive, monitor, coordinate and implement overall
financial inclusion strategy
Government Ministries/ FBoS, MOA, MOE, MOEc, MiTA, MLGHE, - Drive and implement financial inclusion initiatives
Departments/Statutory MWCPA, MYS, MITT, iTLTB, FRCA - Budget allocation for financial inclusion initiatives
Financial Service Providers CBs, MFIs, Co-ops, Credit Unions, MNOs, - Implement financial inclusion initiatives
FNPF, Finance Companies, Capital Market - Supply relevant data to regulatory authority on
Intermediaries, Insurance Companies regular basis
Advocacy Institutions CCoF - Ensure compliance with financial consumer
Insurance Taskforce protection issues
ABIF - Report financial complaints to relevant authority
Development Partners PFIP, MDF, AFI, UNCDF,ADB, WB, IFC Donor - Provide capacity building and technical support
Agencies, NGOs, International Entities
Customers Clients and other users of financial services - Provide customer feedback
12
Draft Fiji 5-year and 20-year National Development Plan (2016-2020) (2016-2036) and Fiji’s Financial Sector Development Plan (2016-2025).
16NATIONAL FINANCIAL INCLUSION STRATEGIC PLAN | 2016-2020
8. Coordination, Monitoring and Evaluation
8.1 Coordinating Committee
The NFIT is the coordination committee for the overall financial inclusion strategies. The RBF will
continue to provide leadership and secretariat support to the NFIT and its Working Groups. Membership
includes representatives of key stakeholder groups and every effort has been made to ensure that all
parties are adequately represented13.
The four working groups are tasked with specific areas of focus as noted below:
1. Financial Literacy Working Group (FLWG)
- Improving financial competencies through financial education in the school curriculum;
- Building adult financial competency through better coordination and increase public and private
sector support; and
- Enhancing financial education awareness and consumer empowerment.
2. Inclusive Services and Products Working Group (ISPWG)
- Ensure the provision of sustainable, relevant, affordable and accessible financial services and
products;
- Strengthen the existing financial infrastructure;
- Create an enabling regulatory environment;
- Create a digital financial ecosystem; and
- Increase and strengthen public private sector partnership.
3. Inclusive Insurance Working Group (IIWG)
- Facilitate and offer relevant insurance products that are sustainable, affordable and responsive to
the needs of the poor and low income groups; and
- Create a balance between regulations, enhancing access to insurance service and empowering
and protecting policyholders.
4. Statistics Working Group (SWG)
- Monitor the outreach and coverage of existing financial services; and
- Regularly monitor impact of financial inclusion efforts through coordination and comprehensive
data collection and sharing.
13
Detailed list of members are noted in Annex 3.
17NATIONAL FINANCIAL INCLUSION STRATEGIC PLAN | 2016-2020
The monitoring and coordinating committee structure is noted below.
Figure 7: National Financial Inclusion Taskforce Structure
National Financial
Inclusion Taskforce
Reserve Bank of Fiji
Secretariat support to NFIT
and its Working Groups
Financial Inclusive Services Inclusive Statistics
Literacy and Products Insurance Working
Working Group Working Group Working Group Group
Digital Financial
Services Sub-
Working Group
National Financial Inclusion Taskforce meeting
18NATIONAL FINANCIAL INCLUSION STRATEGIC PLAN | 2016-2020
8.2 Monitoring and Evaluation Framework
The working groups under the NFIT will develop implementation plans for strategic areas relating to
their respective core objectives. The NFIT will closely monitor key initiatives undertaken by each of the
working groups on a quarterly basis.
The RBF as the secretariat of the NFIT will track the overall performance indicators and targets and report
to the NFIT on an annual basis to ensure that efforts are in line with the agreed targets in this Strategic
Plan.
The tracking process will be in two parts through: 1) continuous monitoring of the overall progress made
towards achieving the stated financial inclusion objectives and new strategies that needs to be taken;
and 2) mid-term evaluation of the completed and ongoing activities to determine the extent to which
stated objectives are achieved as well as contribute to strategy review.
8.2.1 Monitoring Framework
The traffic light rating system will be used to monitor the progress made with respect to its targets.
Table 3: Traffic Light Rating System
Color Code Representation
Green signals that the set targets have been achieved.
Amber signals that at least 50 percent of the target has been achieved and programs are
underway. The programs and objectives that are outstanding will be highlighted and timelines
noted for completion.
Red signals that less than 50 percent of the target has been achieved or programs have yet to
commence.
Table 4: Illustrative Monitoring Framework
Key Focus Area Activity Status Report
Financial Services - Design an interactive financial Completed
Mapping Exercise services access points map and place it
on the public domain
Regulatory Impact - Undertake a regulatory impact Completed
Assessment assessment of financial inclusion
policies
Inclusive Insurance - Approve new regulations with Regulation has been drafted and awaiting approval.
Regulation proportionate prudential requirements Timeline for approval - 31 August, 2016
to support inclusive insurance
Credit Union Act - Review of Credit Union Act 1978 Engaged technical expertise of IMF’s PFTAC in the review.
The first draft of the Bill has been endorsed by the Solicitor
General’s Office and is now with the credit union industry
for written submission. Consultations to conclude in August
2016
19NATIONAL FINANCIAL INCLUSION STRATEGIC PLAN | 2016-2020
Key Focus Area Activity Status Report
FinED Knowledge - Develop financial education A firm has been hired and development of the FinED
Product knowledge product knowledge product is well underway. Timelines for release
– 31 July, 2016
Disaggregation of Data - Collect disaggregated data in terms of Returns to the commercial banks are yet to be revised to
gender, age, ethnicity and location include disaggregation
Remittance-linked - Introduce remittance linked products A research paper has been circulated to Stakeholders
Products through working group level and have yet to discuss and
explore options
8.2.2 Evaluation Framework
The evaluation framework uses a mix of AFI Core Set of Indicators, Quality Indicators, Digital Financial
Services Indicators and PIRI Core Plus Indicators to measure the status of financial inclusion in Fiji. The
core indicators provide the foundation for measuring the country’s financial inclusion efforts.
Core Indicators:
Access Indicators – The access indicators are measured through: 1) availability of a financial access point
and at administrative level; and 2) new accounts opened to the extent of Women, Youth and at Divisional
levels.
Usage Indicators – The usage indicators are measured through active financial accounts, meaning that
there is at least one transaction in the last 90 days.
Quality Indicators – The quality indicators are captured through barriers to accessing and using financial
services and products.
Table 5: Key Evaluation Indicators
Financial Core Baseline Global Global Mid-Term Target Measure- Data
Inclusion Performance Data14 Findex Data Findex Data Target ment Source(s)
Dimension Indicators 2018 2020 Frequency
Upper Mid- Middle
dle Income Income
Countries Countries
Access to Number of 21 n.a n.a 25 30 Annually Supply
formal cash-in cash-out side data
Financial financial access from FSPs,
Products and points per Population
Service. 10,000 adults Census
Percentage 88% n.a n.a 89% 90% Annually Supply
of rural side data
administrative from FSPs,
units with at Financial
least one access Access
point Points Map
20NATIONAL FINANCIAL INCLUSION STRATEGIC PLAN | 2016-2020
Financial Core Baseline Global Global Mid-Term Target Measure- Data
Inclusion Performance Data14 Findex Data Findex Data Target ment Source(s)
Dimension Indicators 2018 2020 Frequency
Upper Mid- Middle
dle Income Income
Countries Countries
Access to Percentage of 64% 70.4% 57.6% 75% 85% Quarterly Supply side
formal new account(s) data from
Financial at a formal FSPs
Products financial
and Service. institution
(cont.)
Percentage of 52% 67.3% 52.9% 60% 72% Quarterly Supply side
new account(s) data from
at a formal FSPs
financial
institution -
Women
Percentage of 51% 58.1%15 44.9% 65% 80% Quarterly Supply side
new account(s) data from
at a formal FSPs
financial
institution –
Youth (aged 15
– 30)
Access to Percentage of 44% n.a n.a 55% 70% Quarterly Supply side
formal new account(s) data from
Financial at a formal FSPs
Products financial
and Service. institution –
(cont.) Eastern Division
Percentage of 55% n.a n.a 65% 80% Quarterly Supply side
new account at a data from
formal financial FSPs
institution
– Northern
Division
Percentage of 62% n.a n.a 75% 85% Quarterly Supply side
new account(s) data from
at a formal FSPs
financial
institution -
Western Division
Percentage of 73% n.a n.a 80% 90% Quarterly Supply side
new account(s) data from
at a formal FSPs
financial
institution –
Central Division
21NATIONAL FINANCIAL INCLUSION STRATEGIC PLAN | 2016-2020
Financial Core Baseline Global Global Mid-Term Target Measure- Data
Inclusion Performance Data14 Findex Data Findex Data Target ment Source(s)
Dimension Indicators 2018 2020 Frequency
Upper Mid- Middle
dle Income Income
Countries Countries
Usage of Percentage of 2.16% 0.7% 1.5% 8% 15% Quarterly MNO
Services and adults that have Returns
Products an active mobile
money account
(used in the last
90 days)
Percentage of 8.1% 19.9% 15.1% 12% 15% Annually Supply side
adults using data from
digital payments FSPs
other than
mobile money
Percentage of 38% 32.2% 24.1% 40% 45% Quarterly Supply side
adults using data from
formal savings FSPs
products
Percentage of 6.9% 10.4% 9.1% 10% 15% Quarterly Bank
adults using Returns
formal credit
products
Percentage of 12% n.a n.a 15% 25% Annually Insurance
adults with Annual
an insurance Returns
product
Percentage of 3% 8.8% 8.3% 5% 10% Quarterly MNO
remittance sent Returns
through mobile
money
22NATIONAL FINANCIAL INCLUSION STRATEGIC PLAN | 2016-2020
Financial Core Baseline Global Global Mid-Term Target Measure- Data
Inclusion Performance Data14 Findex Data Findex Data Target ment Source(s)
Dimension Indicators 2018 2020 Frequency
Upper Mid- Middle
dle Income Income
Countries Countries
Usage of Percentage 65% n.a n.a 70% 75% Annually FNPF
Services and of adults
Products with a FNPF
(cont.) membership
account
Percentage of 27% n.a n.a 30% 35% Annually FNPF
adults using
pension products
Quality Cost of entry $16.67 n.a n.a n.a $10.00 Annually Mystery
level to the shopper/
banking system Bank Infor-
mation
Average number 2.5 n.a n.a n.a 1 Annually Mystery
of identification shopper/
documents Bank Infor-
required to open mation
a basic bank
account
Percentage of 54% n.a n.a 60% 70% Annually Financial
adults within Access
5km of an access Points Map
point
Entrepreneurial Annually MOE
training is
integrated
into tertiary
education.
14
Baseline Data is from the Demand Side Survey and Supply Side data for 2015.
15
Global Findex measures Youth from age 15-24.
23NATIONAL FINANCIAL INCLUSION STRATEGIC PLAN | 2016-2020
Annex
1. Highlights and Achievements from the 2010-2014 Strategy
The achievements of the first strategic objectives and key focus areas were made through the combined
effort and commitment from all the key stakeholders involved as outlined below:
Policy & Coordination
− National Financial Inclusion and National Financial Literacy strategies formulated.
− National Financial Inclusion Taskforce and Working Group structure was established.
− Introduction of agent banking and increased deployment of EFTPOS and ATM machines in rural
and outer areas.
− Commercial banks setting up Microfinance Unit in all their branches.
− Active involvement of Commercial Banks and other Financial Service providers in financial
inclusion work and getting the lower income household empowered for a secure financial future.
− RBF joins the Alliance for Financial Inclusion global policy network.
− Active member of the Alliance for Financial Inclusion’s Pacific Island Working Group including
three other Working Groups, Financial Inclusion Data Working Group, SME Finance Working Group
and the Financial Inclusion Strategy Peer Learning Group.
− Maya Declaration commitment made and regular updates provided to AFI.
− Inclusive insurance action plan put in place.
− Model e-money Trust agreement implemented.
− Managed to build a strong network and good working relationships with the stakeholders (private
and public sectors).
− Hosted two of AFI’s Working Group meetings (Pacific Islands Working Group and Financial
Inclusion Strategy Peer Learning Group).
24NATIONAL FINANCIAL INCLUSION STRATEGIC PLAN | 2016-2020
Deepening Access
− 207,083 underserved people banked – 138 percent of target achieved by end of 2014.
− Implementation of mobile/branchless banking deployments.
− Piloting and issuance of microinsurance products.
− Introduction of low-cost international remittances to mobile wallets.
− 23,000 social welfare clients paid through electronic savings account by end of 2014.
Competent Consumers
− Financial competency baseline for low income adults established.
− Approximately 67,352 adults participated in financial literacy trainings conducted by various
financial stakeholders by end 2014.
− Full roll-out of financial education in the school curriculum in 2013 impacting around 910 schools
and 197,000 students.
− Supplementary policy notice issued on standardised and minimum disclosure on consumer credit
products.
Other Major Highlights:
− Awarded the Inaugural AFI Maya Declaration Award in September 2013.
− Hosted 18 RBF Microfinance Expositions around Fiji, with active participation from both the
private and public sectors.
− Introduction of the National Microfinance Awards.
− Licensed Financial Institution’s active involvement in organizing public awareness and education
campaigns to support financial inclusion.
25NATIONAL FINANCIAL INCLUSION STRATEGIC PLAN | 2016-2020
2. NFIT and Working Group Representatives
2.1 NFIT Members
Mr Barry Whiteside, Governor Reserve Bank of Fiji (Chairman)
Mr Ariff Ali, Deputy Governor, Reserve Bank of Fiji
Mr Vereimi Levula, Chief Manager, Financial System Development, Reserve Bank of Fiji
Mr Yogesh Karan, Permanent Secretary, Office of the Prime Minister
Mr Naipote Katonitabua, Permanent Secretary, Ministry of iTaukei Affairs
Mr Meleti Bainimarama, Permanent Secretary, Ministry of Rural & Maritime Development & National
Disaster Management
Mrs Litia Mawi, Roving Ambassador for the Pacific Island Countries, Ministry of Foreign Affairs
Mr Mark Flaming, Regional Financial Inclusion Adviser & Project Manager, PFIP
Mr Dijendra Singh, Former Company Director.
Mr Kevin McCarthy, Country Manager, Bank South Pacific
Ms Eseta Nadakuitavuki, Manager Sustainability and Head of Rural Banking, Westpac Banking
Corporation (Chairperson FLWG)
Mr Nafitalai Cakacaka, GM Business Risk Services, Fiji Development Bank (Chairman ISPWG)
Mr Lolesh Sharma, CEO SUN Insurance (Chairman IIWG)
Mr Epeli Waqavonovono, Government Statistician, Fiji Bureau of Statistics (Chairman SWG)
2.2 Financial Literacy Working Group Representatives
Westpac Banking Corporation (Chairperson)
BSP Life
Fiji National Provident Fund
26NATIONAL FINANCIAL INCLUSION STRATEGIC PLAN | 2016-2020
Bank South Pacific
Pacific Financial Inclusion Programme
Bank of Baroda
ANZ Banking Group
Consumer Council of Fiji
Ministry of Education
Ministry of Women, Children and Poverty Alleviation
HFC Bank
Bred Bank
Department of Strategic Planning & National Development
2.3 Inclusive Services and Products Working Group Representatives
Fiji Development Bank (Chairperson)
South Pacific Business Development
National Centre for Small and Micro Enterprise Development
Vodafone
Telecom Fiji
ANZ Banking Group
Westpac Banking Corporation
Office of the Prime Minister
Ministry of Industry Trade and Tourism
Ministry of Women, Children and Poverty Alleviation
Ministry of Rural & Maritime Development & National Disaster Management
Pacific Financial Inclusion Programme
Handy Finance Ltd
International Trade Centre
27NATIONAL FINANCIAL INCLUSION STRATEGIC PLAN | 2016-2020
2.4 Inclusive Insurance Working Group Representatives
SUN Insurance (Chairperson)
Pacific Financial Inclusion Programme
BSP Life and Health
FijiCare Insurance Ltd
Life Insurance Corporation of India
Fiji Revenue and Customs Authority
Ministry of Economy
National Disaster Management Office
2.5 Statistics Working Group Representatives
Fiji Bureau of Statistics (Chairperson)
Pacific Financial Inclusion Programme
University of the South Pacific
Market Development Facility
Digicel
Vodafone
Telecom Fiji
Tebbutt Research
Commercial Banks
28NATIONAL FINANCIAL INCLUSION STRATEGIC PLAN | 2016-2020
Notes:
29NATIONAL FINANCIAL INCLUSION STRATEGIC PLAN | 2016-2020
Notes:
30NATIONAL FINANCIAL INCLUSION STRATEGIC PLAN | 2016-2020
RESERVE BANK
OF FIJI
Postal: Private Mail Bag, Suva, Fiji
Postal: Private Mail Bag, Suva, Fiji
Telephone: (679) 331 3611
Telephone: (679) 322 3440
Facsimile: (679) 330 2094
Facsimile: (679) 322 3491
Email: info@rbf.gov.fj
Email: nfitfiji@rbf.gov.fj
Website: www.rbf.gov.fj
Website: www.nfitfiji.com
32You can also read