Improving health through the social quality approach in 800 communes in Madagascar - May 2013
←
→
Page content transcription
If your browser does not render page correctly, please read the page content below
Improving health through the
social quality approach in 800
  communes in Madagascar

                     May 2013

 Prepared by Laura Hurley and Mamy Tiana Rakotoarimanana,

                 IntraHealth International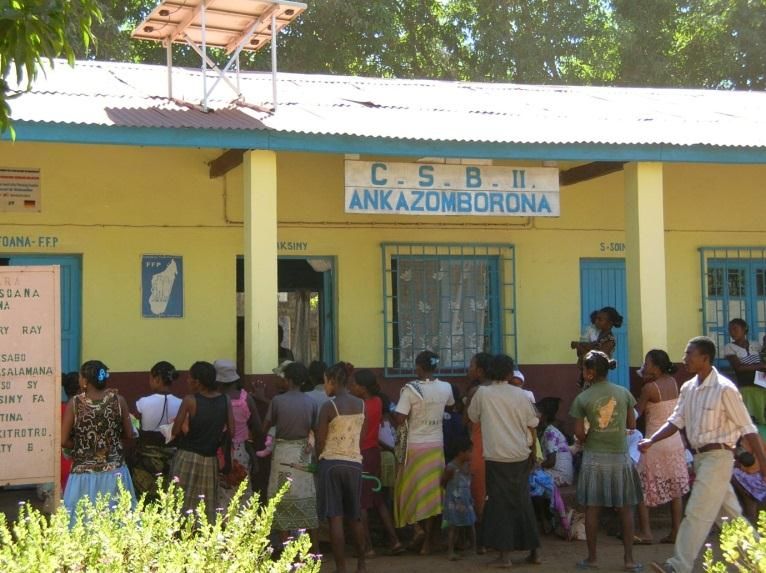
TABLE OF CONTENTS
EXECUTIVE SUMMARY ....................................................................................................................................... iv
I.     BACKGROUND ............................................................................................................................................. 1
           A.         Health in Madagascar .................................................................................................................. 1
           B.         Description of the USAID/Santénet2 Project .............................................................................. 1
II.    SOCIAL QUALITY .......................................................................................................................................... 3
           A.         Goals and objectives .................................................................................................................... 3
           B.         Conceptual Framework ............................................................................................................... 4
           C.         Implementation ........................................................................................................................... 6
           1.         Stakeholders ................................................................................................................................ 6
           2.         Implementation process.............................................................................................................. 6
           3.         Monitoring and evaluation system ............................................................................................. 8
III. METHODOLOGY .......................................................................................................................................... 9
           A.         Quantitative Analysis ................................................................................................................... 9
           B.         Correlation Analysis ..................................................................................................................... 9
           C.         Qualitative Data Collection........................................................................................................10
IV. RESULTS……… .............................................................................................................................................11
           A.         The community expresses its health needs and addresses problems ......................................11
           1.         Local capacity to understand community needs .......................................................................11
           2.         Capacity to implement local solutions in order to meet pre-identified needs .........................13
           B.         Health services offered respond to the needs of the community ............................................15
           1.         Improvement of health service quality .....................................................................................15
           2.         Use of community-based health services..................................................................................18
V.     ESSENTIAL COMPONENTS FOR SUCCESS ..................................................................................................21
           A.         Integration of the approach to existing structures ...................................................................21
           B.         Unification of community actors ...............................................................................................22
           C.         Promotion of gender equality ...................................................................................................22
           D.         CHDC motivation .......................................................................................................................23
           E.         CHDC understanding of role ......................................................................................................24
           F.         Ownership by local authorities..................................................................................................24
           G.         Efficiency of the supervision strategy for STs and NGOs ..........................................................25
VI. SUSTAINABILITY OF THE APPROACH ........................................................................................................25
VII. RECOMMENDATIONS................................................................................................................................27
VIII. CONCLUSION .............................................................................................................................................28
IX. APPENDICES...............................................................................................................................................29

                                                                                                                                                                        ii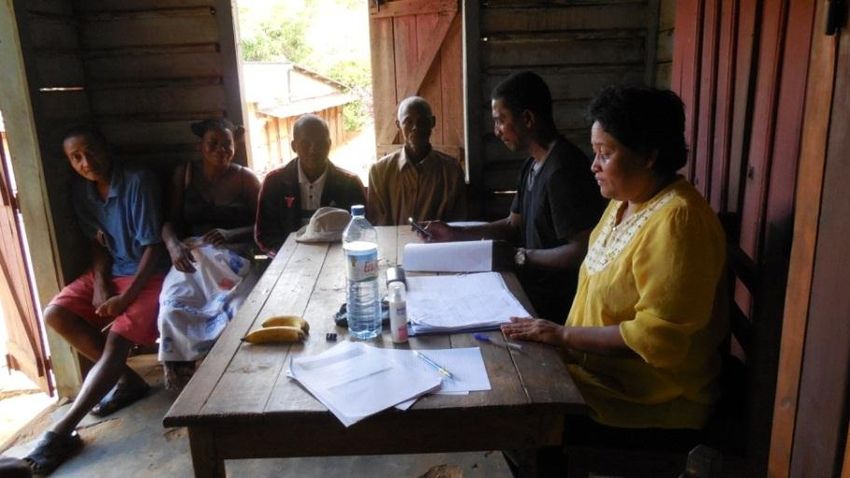
ACRONYMS AND GLOSSARY
APPROPOP/MSH   Appui aux programmes des populations-Support for Population
               Programs/ Management Sciences For Health
CARE           Cooperative and Assistance for Relief Everywhere
CHDC           Communal Health Development Commission
CHV            Community Health Volunteer
COPE           Client-Oriented, Provider-Efficient Services
CRS            Catholic Relief Services
CSB            Centre de Santé de Base- Primary Health Care Center
CSC            Community Score Card
CSP            Community Supply Point
DHS            Demographic and Health Surveys
DRV            Dinika sy Rindran’ny Vehivavy (a member NGO of the consortium that is
               responsible for the project’s gender promotion efforts)
Fokontany      Administrative denomination of village level in Madagascar
GTZ            Gesellschaftfür Technische Zusammenarbeit/ German Agency for
               Technical Cooperation
INSTAT         Institut National de la Statistique de Madagascar/ National Institute of
               Statistics of Madagascar
KM             Kaominina Mendrika or Champion Commune
KM Salama      Kaominina Mendrika Salama or Champion Commune for Health
MBB            Marginal Budgeting Bottlenecks
MSI-M          Marie Stopes International - Madagascar
MSIS           Multi-Sector Information Service
PAQ            Partenariat pour l’Amélioration de la Qualité- Partnership for Quality
               Improvement
PSI            Population Services International
SAGE           Service d’Appui à la Gestion de l’Environnement
ST             Support Technician
UNICEF         United Nations International Children's Emergency Fund
USAID          United States Agency for International Development
WASH           Water, Sanitation, and Hygiene
WHO            World Health Organization

                                                                                          iii
EXECUTIVE SUMMARY
Madagascar, an island nation of nearly 22 million people, is one of the poorest countries in the world.
The Malagasy population struggles with childhood disease, high maternal mortality and chronic
malnutrition which are all exacerbated by the lack of access to clean water and to quality health
services. To help empower the Malagasy people to address their own health needs, the
USAID/Santenet2 program introduced the social quality approach in 800 communes in Madagascar.
The social quality approach is a community-based approach for encouraging service recipients to get
involved in the availability, use, and quality of health services. This report, based on Santenet2 project
data, correlation analysis, and qualitative data collection, illustrates the implementation process,
successes and essential components to the successful implementation of the social quality approach.

The social quality approach is implemented in Madagascar through the Communal Health Development
Commissions (CHDC) in each of the 800 communes working in partnership with the community, the
community health volunteers (CHVs), and the health center. The social quality approach as
implemented in Madagascar has been successful in attaining all four of its key objectives. First, the
social quality approach improved local capacity to identify and understand the needs of the community
through community meetings held in the fokontany by members of the CHDC. Secondly, it improved
local capacity to implement local solutions to the identified needs through the development and joint
implementation of workplans with one key success being the construction or rehabilitation of 3,552
health huts for CHVs. Third, the approach was able to improve both the perceived and actual quality of
community-based health services offered through support to the CHVs, the health supply logistics
systems, and other activities. Finally, the social quality approach, through the work of the CHDC, helped
increase the use of health services by improving the quality, but also through community mobilization
and, in some cases, the establishment of emergency evacuation systems.

In addition to these results, the social quality approach also succeeded in promoting gender equality. In
addition to improving women’s expression of their needs and their involvement in decision-making
processes, the social quality approach has fostered constructive male engagement in family health.

Essential components that contributed to the successful implementation of the social quality approach
in Madagascar are explained in this report. These essential components include the integration of the
social quality approach into previously existing structures, the unification of community actors, the
promotion of gender equality, the CHDC’s motivation and their own understanding of their assigned
role, the ownership and engagement of the social quality approach by local authorities, and the
effectiveness of the support and mentoring to the local NGOs and their support technicians (STs).

                                                                                                             iv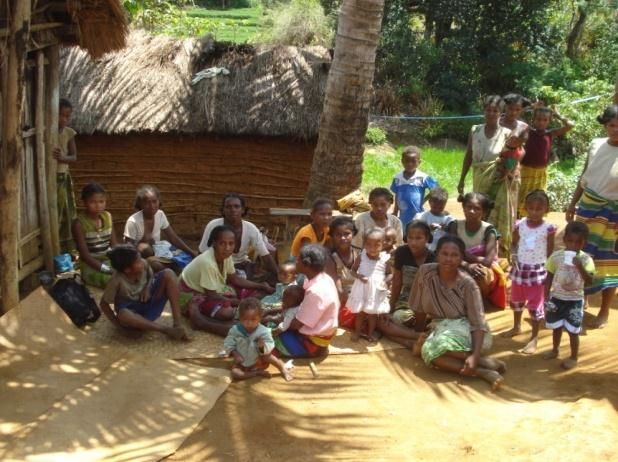
The social quality approach was designed and implemented in Madagascar to be sustainable since it
worked with previously existing structures, it complied with the sociocultural environment, it
empowered the CHDC to lead the process, and it mobilized local resources. Despite this, the report
presents recommendations for improvements to the social quality approach, further promotion of
sustainability of the approach, and recommendations for expansion of the approach.

The end goal of the social quality approach is a healthy Malagasy population. Through the sustainability
and the expansion of this approach, this goal can be met. While still in the early phases of
implementation, the social quality approach has convinced communities that poor health is not
inevitable. Through local governance and community ownership, the social quality approach has
created communities that are both expressing and resolving their own health needs and improving the
quality of services provided to them.

                                                                                                       v
I.      BACKGROUND
     A. Health in Madagascar

Madagascar, an island nation of nearly 22 million people, is one of the poorest countries in the world. In
2010, the proportion of Malagasy people living below the poverty line of $1 per day reached 76.5
percent (INSTAT, 2010). Prior to the most recent political crisis, Madagascar was making progress in
child health, with under-five mortality dropping from 92/1000 to 72/1000 between 2003-2004 and
2008-2009 (DHS). The percentage of fully immunized children doubled, and infant mortality decreased
from 59/1000 to 48/1000. During the same period, modern contraception use increased from 18 to 29
percent (DHS, 2008/9). Despite these successes, maternal mortality and nutrition indicators have
remained stagnant. Maternal mortality is 498/100,000, well above the MDG target of 149/100,000. Half
of children under five years of age are stunted, indicating chronic malnourishment in this group (DHS,
2008/9). In addition, more than 60 percent of the population does not have access to safe drinking
water (DHS, 2008/9).

Access to quality health services is a major challenge in Madagascar, where over 80 percent of the
population lives in difficult to reach rural locations (World Bank, 2010). The rural population has less
information and knowledge about health-seeking behaviors, and they have less access to health
services since 54 percent of the rural population lives more than 5 km (or 1 hour’s walk) from the
nearest primary healthcare center. Due to limited access, the rural population tends to be less informed
regarding life-saving behaviors. It also has a higher percentage of early and undesired pregnancies,
lower modern contraceptive use, higher malnutrition, fewer parents who seek treatment when children
show symptoms of illness, and a lower rate of immunization coverage. As a consequence, the total
fertility rate, child mortality rate, maternal mortality rate, and malnutrition rates are higher among the
rural population than their urban counterparts (DHS, 2008/2009).

     B. Description of the USAID/Santénet2 Project

Santénet2, known locally as KM Salama, comprises the fourth phase of a United States Agency for
International Development (USAID)-funded community health project. Since 2008, Santénet2 has been
implementing integrated community health activities in 800 of 1,566 communes, covering 16 of 22
regions and 72 of 111 districts (see Figure 1).

Santénet2 contributes to the achievement of the USAID Strategic Objective 5 (SO 5): “Increased use of
specific health services and products and improvement of practices.”

                                                                                                             1
Figure 1: 800 KMs supported by 16 nongovernmental organizations
The Santénet2 conceptual framework has three building blocks: (1) developing and strengthening key
community health system components; (2) empowering community participation and accountability in
setting and achieving community health goals; and (3) linking the two for at-scale impact to reduce
maternal, child, and infant mortality; fertility rate; chronic malnutrition in children under the age of 5;
and prevalence of malaria (particularly among
children under 5 and pregnant women), as well as Santénet2 worked in partnership with:
to expand access to water, sanitation, and hygiene 16 partner NGOs
(WASH) and maintain a low HIV prevalence rate. 16 regions and 70 districts (pop. 11 million)
5,758 fokontany located 5 km or more from
To improve the accessibility of outreach health care the nearest primary healthcare center (CSB)
services, Santénet2 trained over 11,000 CHVs in 800 CHDCs
fokontany that are located 5 km or more from the 11,413 CHVs
The leaders of the 800 KMs (Champion
nearest health facility. As a member of the project’s
Communes), 10 per commune on average
consortium, IntraHealth International implemented 1,100 religious leaders
the training and supervision strategy targeting the 1,051 youth leaders
CHVs to help them deliver quality integrated 400 independent trainers and supervisors
UNICEF, WHO, World Bank, MSI-M, PSI
maternal and child health services.
2
Not only did IntraHealth ensure the technical quality of the services being delivered, it also developed
an approach aimed at establishing a partnership between the providers and the service beneficiaries to
ensure services meet the needs expressed by the population. Since the level of quality delivered by the
providers often differs from the quality perceived by the community, several quality improvement
processes have been implemented in Madagascar.1 Through IntraHealth International, the Santénet2
project used the social quality approach to provide a simple vision to quality improvement that was
easily accessible to rural populations and ensured its suitability to Madagascar’s sociocultural context.
Thus, the social quality approach was integrated into the KM Salama process.

II.      SOCIAL QUALITY
The Santénet2 social quality approach is a community involvement strategy aimed at ensuring the local
governance of health services through a democratic and accountable process. It was designed to build
skills within the community to enable members of the community to participate in health needs
assessments and the development of solutions. This approach was based primarily on IntraHealth’s PAQ
(Partenariat pour l’Amélioration de la Qualité) Approach but was adapted to the local context. It was
also inspired by the best practices implemented by Santénet2 as part of the KM Salama approach and
the World Bank’s experience with the community score card (CSC) in 20 communes within the Anosy
region. The gender dimension was also integrated into this approach along with these key social
accountability principles.

      A. Goals and objectives

The end goal of the social quality approach is to ensure that the Malagasy population becomes active
beneficiaries of health services so that these services remain available and accessible while meeting
their needs. The involvement of community stakeholders in the improvement of health service quality
and in the promotion of behavior change should have a positive impact on the health outcomes of
each commune. The social quality approach is designed to accomplish two primary goals:

      1. Communities in Madagascar are able to express and meet their own health needs.
      2. Health services respond to the needs expressed by the community.

The Santénet2 project objectives for the social quality approach are as follows:

1
 1992: Client-Oriented, Provider-Efficient (COPE) services supported by the Support for Population Programs/ Management
Sciences for Health (APPROPOP/MSH) Project and aimed at improving emergency obstetrical care and family planning services
2005: Marginal Budgeting Bottlenecks (MBB) approach supported by UNICEF and aimed at improving vaccination services
2005: Quality assurance system supported by Santénet2 and implemented in hospitals and primary healthcare centers
2007: Quality competition supported by German Agency for Technical Cooperation GTZ) and implemented in hospitals
2007 and 2008: Community Score Card supported by the World Bank and implemented in primary healthcare centers

                                                                                                                        3
1. Improve local capacity to identify and understand the needs of the community
   2. Improve local capacity to implement local solutions to the identified needs
   3. Improve the quality of the community-based health services being offered
   4. Increase the use of quality health services

   B. Conceptual Framework

The conceptual framework below illustrates how the social quality interventions implemented through
the Santénet2 project were designed to reach the above objectives, and over time, improve community
accountability for their health and improve the quality of services offered in their communities.

                                                                                                      4
Figure 2: Social Quality Conceptual Framework
Activities Results Outcomes Impact
Training of NGOs
and STs
Training of CHDC Capacity to understand
members the needs of the
community at the local
level The community
Community expresses its health
needs and addresses
assessment problems in this area.
Capacity to implement
meetings local solutions in order
to meet identified
needs
Development of
Malagasy communities
CHDC action are healthy
plans
Improvement of health
service quality
CHDC self- The health services
assessments being offered meet the
needs expressed by the
community.
Monitoring and Use of health services
Evaluation System
5C. Implementation
1. Stakeholders
The main stakeholders involved in the implementation of the KM Salama approach as well as their
roles in the social quality approach are described below:
Partner NGOs, through ST and their supervisors, work as facilitators and provide
organizational support and leadership.
The CHDC represents the community, identifies the challenges to address as part of the
needs assessment analysis, coordinates the implementation of the social quality approach
within the KM Salama approach, mobilizes the community to carry out and monitor the
selected activities, addresses the issues encountered during the implementation process and
supports the community health volunteers in their duties.
The technical supervisors2 are members of the CHDC who ensure the technical supervision
of the community health volunteers.
The groups of local facilitators are designated by the CHDC members and ensure the proper
implementation of activities at the KM level, delivery of reports, and promote gender
equality (two quality facilitators and one gender facilitator in each KM).
The community supply point (CSP) is identified by the CHDC members and ensures the
procurement of social marketing products for the community health volunteers.
The CHVs raise awareness among the community, ensure the distribution of health products
and the management of clients at the community level, refer complicated cases to health
centers, and help health facilities actively search for clients who are lost to follow-up.
The community takes part in all health-related activities, evaluates the quality of health
service delivery, expresses its health needs and implements timely actions at the local level.
2. Implementation process
USAID/Santénet2 trained and supported 48 NGO supervisors and 156 support technicians. The STs
in turn trained 9,562 CHDC members in the 800 targeted communes in order to hold community
evaluation meetings as well as self-assessments among CHDC members, and develop simple,
relevant and achievable action plans.
The social quality approach is implemented in three stages through a continuous cycle:
2
The technical supervisors are providers from primary health care centers (CSB).
6Figure 3: Steps toward quality improvement
Step 1: Quality
assessment/identification of Step 2: Problem-solving and
priority problems in terms development of action plans
of quality
Step 3: Partnership between
the community, the CHDC,
the CHVs, the CSB to
implement and monitor
action plans
Step 1: Service quality assessment and identification of priority issues related to the quality of
health services through community evaluation meetings
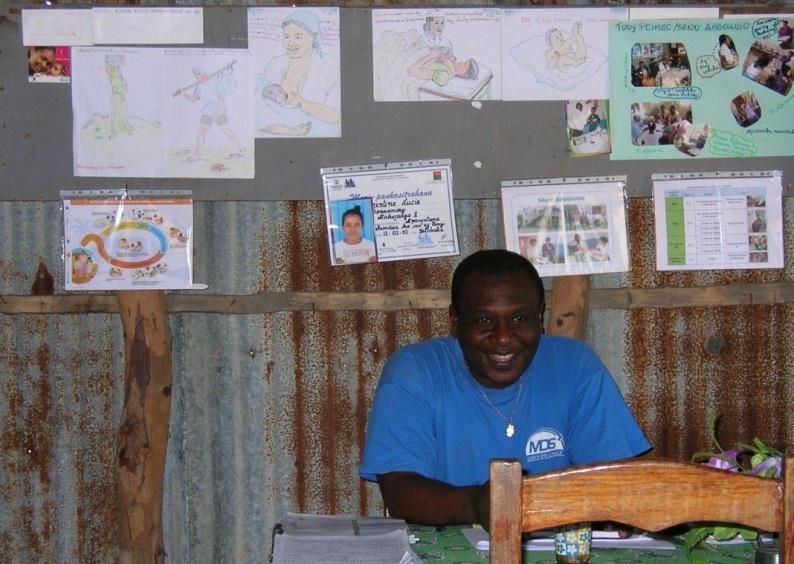
The community evaluation meetings are held in each fokontany and are facilitated by the head of
the fokontany (administrative denomination of village level in Madagascar), a leader or the group of
facilitators from the CHDC. In other words, the meeting facilitators are local leaders who are neither
politicians nor health providers.
The community evaluation meetings proceed as follows:
The facilitator informs the
community of the meeting’s
objective which is to identify the
health needs of the population. The
facilitator then informs the
participants of their rights in terms
of health accessibility, dignity,
confidentiality, safety, continuity of
care, as well as their right to be
informed regarding the services
that are available at various levels
of the healthcare system.
7 The participants then confidentially evaluate their level of satisfaction with available health
services and the acceptance of responsibility by men and women in health-related matters.
This assessment is then followed by a participatory discussion during which various needs
and recommendations are discussed.
The outcomes of the meetings are then reported to the CHDC and will be debated during
the CHDC review session.
Step 2: Problem-solving and development of action plans promoting CHDC accountability through
self-assessments
The outcomes from the community evaluation meetings are reported to the CHDC in order to
identify solutions. Since the members of the CHDC represent the community, they carry out self-
assessments to hold themselves accountable to their community. The CHDC self-assessment aims to
evaluate the level of satisfaction of CHDC members regarding their own responsibilities, reminding
them of their role, and improving decision-making processes. This self-assessment takes place prior
to the development of a new community action plan.
Following the self-assessment, the CHDC members identify areas for improvement and discuss the
needs expressed by the community in order to implement
solutions. Action plans are then drafted in order to determine Two to three self-
the timeframe and the individuals in charge of each activity, as assessments were carried
well as the resources that need to be allocated. out each year in the 800
KMs. The CHDC in each
Step 3: Partnership with the community, the CHDC, the CHVs commune developed action
and the CSB in order to implement and monitor the action plans plans at least every six
months.
The CHDC members share their action plans with the
community, mobilize the various stakeholders in order to
implement the activities, and monitor the implementation process while addressing potential issues.
The NGO support technicians monitor the implementation of activities on a monthly basis and
support the CHDC, as needed, to solve problems.
3. Monitoring and evaluation system
User-friendly management tools were developed locally to monitor the various activities and their
results:
The reports of the community evaluation meetings include the name of the fokontany, the
number of participants (men and women) who are satisfied with the quality of services
provided by the CHVs and the CSB, as well as the participants’ satisfaction with their level of
responsibility in health-related matters, the needs/problems expressed and the
recommended solutions.
8 The CHDC self-assessment reports include information on the number of satisfied and
dissatisfied participants regarding their roles and responsibilities and the functions needing
to be strengthened.
The community action plans include the activities that need to be implemented, as well as
expected results, responsible individuals and timeframes.
The implementation reports compare actual achievements to the expected outcomes
included in the action plans.
The reports developed by the local facilitators are certified by the local authorities and
shared with the STs before being submitted to Santénet2.
Throughout the implementation process, the impact of the approach was assessed with a tool called
the “quality index”. This tool was used to measure the performance of community-based healthcare
services by assessing the availability of CHVs in remote fokontany, CHVs’ skills, available resources,
community involvement, and healthcare service use. The quality index was used twice a year in all
800 communes to monitor the various activities.
III. METHODOLOGY
In order to assess the efficiency, the relevance, and the results of the social quality approach as
presented in this report, three types of analysis were conducted: quantitative analysis, correlation
analysis and qualitative analysis.
A. Quantitative Analysis
All quantitative data in this report were taken from the various databases of regular programmatic
data collection. Programmatic indicators were chosen and pulled from the following sources:
Community assessment reports (See Appendix A)
CHDC self-assessment reports (See Appendix B)
CHV monthly activity reports (on Extranet)
ST reports
Quality index (See Appendix C)
The data was processed and analyzed in Excel before being audited by the program manager.
B. Correlation Analysis
In addition to presenting regular programmatic data, correlation analysis was conducted with the
use of scatter diagrams. A scatter diagram is a graphical technique used to analyze the relationship
between two variables. They show whether or not there is correlation between two variables.
Correlation refers to the measure of the relationship between two sets of numbers or variables. Two
sets of data are plotted on a graph, with the y-axis being used for the variable to be predicted and
the x-axis being used for the variable to make the prediction.
9In order to better understand the results of the social quality approach, the level of community
engagement (based on results from the quality index) and participation in community meetings
were plotted on the x-axis with anticipated results on the y-axis. To better understand factors that
contribute to the success of the social quality approach, the potential determining factors were
plotted on the x-axis with the level of community engagement plotted on the y-axis. In most cases,
the scatter diagrams use 800 points as data from all 800 communes are available. However, since
not all communes have reported on community meetings, scatter diagrams using the participation
of women in the community meetings only have data for 689 of the 800 communes.
There are limitations to this type of analysis. First, the visible slope of the line does not necessarily
provide information about the strength of correlation. Second, a direct or strong correlation does
not necessarily imply a cause-and-effect relationship, it simply shows a correlation. It is possible
that both plotted variables are strongly correlated to a third causal variable. These limitations are
considered in the analysis and discussion of the scatter diagrams.
C. Qualitative Data Collection
In order to both verify and better understand some of the correlations pulled from the scatter
diagrams and to better understand the determining factors for the successful implementation of the
social quality approach, site visits were conducted in four communes. Two communes were chosen
from two different regions, one commune designated as successful and another designated as only
moderately successful. This designation was based on the level of community engagement (from
the quality index), the commune performance score (from the quality index), and the percent of the
population of the communes participating in the community meetings. In the region of Haute
Matsiatra, the two communes visited were Kirano Firarintsoa and Fiadanana. In the region of
Vatovavy Fitovinany, the communes Vatohandrina and Ambohimiarina were visited.
Seven questionnaires (See Appendix D) were elaborated for the following seven targets: the CHDC,
the deputy mayor, the head of the CSB, the CHVs, the community supply point, the ST, and the NGO
ST supervisor. The CHDC and CHV
questionnaires were administered as
part of focus group discussions.
Interviews with the deputy mayor,
the head of the CSB, the CSP and the
ST supervisor were conducted. The
ST questionnaire was given as a
written questionnaire. All
questionnaires were written in
French, but translated to and
administered in Malagasy.
10IV. RESULTS
A. The community expresses its health needs and addresses problems
The social quality approach fostered equitable relationships at the local level and helped the
community have a better understanding of health service quality, its own health needs, and ways to
address them so that community members became active beneficiaries.
1. Local capacity to understand community needs
Nearly one million people took part in the community
Social quality has allowed for
evaluation meetings, including over 500,000 women. The the needs of the community
social quality approach has been successful at increasing to be heard. 1,250 people
the local capacity to understand community needs, participated in the community
including the needs of women. A total of 790 KMs assessment meetings
conducted meetings at the fokontany level and the average compared to only 72 people
coverage rate of fokontany in with meetings held reached per commune during the
85%. Female participation in these meetings was high, application of the CSC.
ranging from 44% to 88%.
The quantitative results from the community evaluation meetings informed the CHDC of the
community’s level of satisfaction regarding the services provided by the CHVs and the CSBs. The
level of satisfaction in both CHV and CSB services are presented in the table below.
Table 1: Community’s satisfaction with health services provided in the 800 KMs
Services provided by the CHVs Services provided by the CSBs
Case Medicines Environment Case Medicines Environment
Management Management
60% 44% 37% 56% 59% 56%
Source: Reports of community assessment meetings (April 2012 to September 2012)
The participation of clients in these meetings is representative of their need to express themselves
and to be listened to. “For the first time in my life, I have been consulted so that people would know
if I am satisfied with health care services and what my actual needs are,” a 60 year-old woman said
in KM Antotohazo, Ankazobe District (Source: NGO report).
The CHDC members were aware of the importance of these meetings since they would help identify
community needs. During the focus groups, the CHDC (especially the head of the fokontany) shared
their satisfaction with the process. In addition to the community-level problems raised by the
community, the meetings helped raise specific issues at the CHDC, commune and CSB levels. The
problems that were raised during the meetings included staff absences at the CSB, the need to
perform nutritional demonstrations rather than just giving advice, the need to consult with a
11midwife at the CSB level rather than with a male physician, and problems related to stockouts for
products used by the CHVs.
The CHDC members also insisted on their ability to represent the community. The women were
chosen in the community as members of the CHDC “because of their ability to represent women
and children at the fokontany level,” some female CHDC members from Kirano Firariantsoa said.
The CHDC members also tried to understand the needs expressed by the youth, including in the
area of adolescent reproductive health. A total of 1,052 youth leaders participated in the CHDC
review sessions. In addition to fostering a better understanding of the community’s needs and level
of satisfaction, the social quality approach also encouraged the CHDC members to periodically
assess their own capacity to understand the community. As a result, 14,546 CHDC members
(including 2,245 women) conducted self-assessments in 800 KMs. As indicated in the table below,
the CHDC members consider themselves efficient when it comes to supporting community
evaluation meetings. However, they need to improve the way the information is transferred back to
the community.
Table 2: CHDC self-assessment results regarding their capacity to understand the community
in the 800 KMs
Level of satisfaction with Level of satisfaction with the General level of
information sharing with the support provided to community satisfaction
community assessment meetings
59% 71% 65%
Source: CHDC self-assessment reports, April 2012 to September 2012
The CHVs were also satisfied with the community evaluation meetings. “These meetings help us
improve the way we deliver services by having a better understanding of the community’s needs,” a
CHV in Vatohandrina said. Another CHV in Ambohimiarina also explained that the community
evaluation meetings provide relevant information on their own strengths and weaknesses. The CHVs
would also like to get feedback from the CHDC or the head of their fokontany regarding their
performance.
Although some providers at the CSB level are weary of the community assessment meetings, most
are supportive. Quality improvement activities at the CSB level have shown that there is a real
partnership between these primary healthcare centers and the community.
Likewise, the NGOs considered the approach to be relevant. “The meetings gave us the opportunity
to evaluate the services provided by the CHVs and to identify problems at the CSB level,” an ST in
the Haute Matsiatra region said. “Needs are discussed and then integrated into the action plans,”
said another ST in the Vatovavy Fitovinany region. An NGO supervisor also revealed that the
community meetings allowed community members to express needs that they would have kept
secret in the past.
122. Capacity to implement local solutions in order to meet pre-identified needs
The social quality approach helps the community meet its health-related needs by using local
capacity. Once the community’s needs were identified during the evaluation meetings, the CHDC
members developed and implemented action plans in order to meet these needs in the 800 KM. A
total of 780 KMs (98%) carried out activities in order to improve the quality of services provided by
the CHVs, while 741 KMs (93%) conducted quality improvement activities at the CSB level.
These quality improvement activities yielded the following results for CHVs:
Assignment of regular service hours
Continuous mentoring of CHVs by technical supervisors
Organization of income-generating activities in order to strengthen the availability of health
products
Creation of a system to monitor the procurement of health products
Creation of an emergency referral system from the fokontany to the health centers (6,388
fokontany in all 800 KMs have a referral system.)
Construction/rehabilitation of 3,552 health huts
Implementation of incentives aimed at motivating the CHVs (official recognition, use of fields
for crops, t-shirts, payment of transportation fees, increased involvement of CHVs in the
CSB’s outreach activities).
The quality improvement activities yielded
the following results at the CSB level:
Assignment of regular service
hours
Development of a plan aimed at
informing the community of staff
absences
Increased availability of health
products: improved transportation
for the purchase of medicine,
payment of the salary of the
procurement pharmacy manager at the commune level
Public display of medicine prices
Construction, rehabilitation and maintenance of the facilities: room for the families, kitchen,
waiting room, roof, painting, well, pond, electrical wiring, waste disposal, restrooms, gardens,
fence, periodical waste management procedures, etc.
13During the focus group sessions, the CHDC explained how they used the action plans to respond to
the needs of the community. The CHDC team in Vatohandrina was satisfied with the action plans as
they defined both deadlines and the people responsible for each action item. These plans were also
easy to use. In Ambohimiarina, the action plan included a dance in each fokontany to raise money
for building a health hut for their CHVs. Four of the seven dances had been organized and the
health huts were put in place.
The issue of product availability for the CHVs was discussed in all the communes during the site
visits. In Ambohimiarina, the CHDC acknowledged that it was part of their role and the CSP
expressed her satisfaction with their support. « I am satisfied with the work accomplished by the
CHDC members. Early on, the CHDC raised money in order to purchase key commodities. Then, I
had the opportunity to work with the CHDC members in order to purchase health products in
collaboration with PSI. I was also able to express my needs to the CHDC members so that they could
support me on a continuing basis, » she said. In Kirano Firariantsoa, the CHDC had contributed
funds for the purchase of stock for the CHVs. Unfortunately, in Vatohandrina, there was a stockout
problem primarily due to the CSP. The CHDC had advocated for changes, but felt the problem was
really between the mayor and the CSP and thus was somewhat out of their control. They had
however tried to address the problem by ensuring the CHVs had supplies from other sources. The
CHV continued to work with supplies either from the CSB or from InterAide, a French NGO working
in the area.
The satisfaction of the CHDC members in terms of their ability to respond to the community’s needs
progressively increased as shown in the figure below. This graph shows how the level of satisfaction
evolved by comparing the results from the first self-assessment with the second one.
Figure 4: CHDC satisfaction level in terms of their ability to respond to the community’s needs
in the 800 KMs
86%
Gender dimension
66%
90%
CHV monitoring and support
67%
76%
Action plan monitoring and support
66%
71%
Community retroinformation
59%
0% 10% 20% 30% 40% 50% 60% 70% 80% 90% 100%
2nd assessment (October 2012 to March 2013) 1st assessment (April 2012 to September 2012)
Source: Self-assessment reports from the CHDC, April 2012 to March 2013
14The graph shows the CHDC’s increased satisfaction
regarding the promotion of gender equality. Indeed, the "Before the approach, men were
social quality approach helped the CHDC members and reluctant to use family planning.
the community to empower women and men in health- Now, they are the ones that
related decision-making processes. At this time, 2/3 of encourage women to use it."
women are accompanied by their husband when they (CHDC, Vatohandrina).
visit the CSB, and nearly half of husbands actively
participate in the purchase of food for their children. In addition, over 90% of men are consulted
regarding the adoption of an FP method.” (Source: Evaluation report on the integration of gender
promotion at the KM level, DRV 2013.)
B. Health services offered respond to the needs of the community
The community is more likely to be satisfied with health services when these services are improved
based on the community’s perception of their quality. The social quality approach contributed to
service quality improvement and the increased use of community-based health services.
1. Improvement of health service quality
The more involved the community is, the more competent the community health volunteers
become. The CHVs interviewed during the focus group discussions shared their appreciation for the
support they received from the CHDC (recognition, solutions to logistics problems). The correlation
analysis shows a positive correlation between the level of community involvement in health services
and the level of skills displayed by CHVs. The graph below shows that the communes with higher
community involvement rates (based on the quality index) seem to have high-performing and more
skilled CHVs (based on CHV supervision reports.
15Figure 5: Relationship between community involvement and CHV skills
120%
Proportion of CHVs with adequate
100%
80%
competences
60%
40%
20%
0%
0% 20% 40% 60% 80% 100% 120%
Level of community involvement
Source: Quality Index 2012 and CHV supervision reports, 2012
Likewise, the results from the last five applications of the quality index in the 800 targeted KMs also
show how community-based health services were improved over time, as shown below.
Figure 6: Evolution in the 800 communes during the five quality index applications
Acceptable Average Insufficient
1% 1% 1%
12% 10% 6%
15%
26%
23%
26%
89% 94%
84%
65%
48%
Application April Application Application April Application Application April
2011 September 2011 2012 September 2012 2013
Source: Results from the implementation of the quality index, 2011-2013 fiscal year
As health service quality improved, the community became more satisfied. For services provided by
the CHVs, the level of community satisfaction had a relative increase of 24% for patient
16management, 39% for medicines and 76% regarding the work environment between the first and
second community assessment meetings.
Figure 7: Evolution of community satisfaction regarding CHV services
provided in the 800 KMs
80% 74%
70% 65%
60% 61%
60%
50% 44%
40% 37%
30%
20%
10%
0%
Management by CHVs Availability of health products Work environment
1st assessment (April 2012 to September 2012) 2nd assessment (October 2012 to March 2013)
Source: Community assessment reports, April 2012 to March 2013
At the CSB level, community satisfaction between the first and second meetings regarding patient
management had a relative increase of 16%, with a relative increase of 19% for medicines and 52%
for the work environment.
Figure 8: Evolution of community satisfaction regarding services provided by the CSB in the
800 KMs
90% 85%
80%
70%
70% 65%
59%
60% 56% 56%
50%
40%
30%
20%
10%
0%
Management by CSB Availability of health products Work environment
1st assessment (April 2012 to September 2012) 2nd assessment (October 2012 to March 2013)
Source: Community evaluation reports, April 2012 to March 2013
17The quality of care provided by the CHVs led to a significant change within the community. “We
used to take our children to traditional healers. But we were not satisfied with the results. We
observed many sudden deaths for no reason. The current results are tangible: The children who are
managed by the CHVs have all been healed,” some CHDC members from the Vatohandrina
commune said.
2. Use of community-based health services
Not only did the social quality approach improve the quality of health services, it also increased their
accessibility and their use. As the community got more involved in the way health services were
organized, the more people used them. According to the correlation analysis below, there seems to
be a relatively strong correlation between the level of community involvement and the use of health
services in the commune (based on data from the quality index). While there are outliers on the
graph, the majority of communes fall close to the line which illustrates a positive correlation
between the two indicators.
Figure 9: Relationship between community involvement and the use of health services
120%
100%
Level of service use
80%
60%
40%
20%
0%
0% 20% 40% 60% 80% 100% 120%
Level of community involvement
Source: Quality Index, 2012
During focus group discussions, all the CHDC mentioned their role in mobilizing the community to
use services. This included formal introductions of CHVs to their communities to ensure awareness
of the services they provide, as well as education of the community about the use of family
planning, vaccinations, and delivery at health centers.
18In order to improve the management of
pregnant women, the CHVs were trained to
promote the use of iron/folic acid by patients
(as part of the national anemia prevention
program); refer women to health centers for
antenatal consultations (at least four
consultations); screen and refer in case of
pregnancy complications; and refer pregnant
women to the CSB to ensure their delivery
would be attended by a qualified provider.
The following table shows that between 2011
and 2012 the number of pregnant women
being referred for an antenatal consultation had a relative increase of 25%, compared with an 11%
increase in the number of women screened and referred for pregnancy complications and a 15%
increase for deliveries referred to health centers. Unfortunately, the number of pregnant women
receiving iron/folic acid decreased due to a stockout of this product at the country level.
Table 3: Evolution of CHV service use by pregnant women in the 800 KMs
Number of women using specific services January to January to Relative
December December increase
2011 2012
Iron/folic acid 14,890 11,888 -20%
Prenatal consultations referred 23,308 29,085 25%
Danger signs referred 673 746 11%
Deliveries referred 9,034 10,387 15%
Source: Monthly activity reports, CHV, Extranet, January 2011 to December 2012
In the domain of family planning, the use of services provided by CHVs increased by 31%. As part of
the focus group discussions, most CHDC members emphasized their support for FP. A CHDC
member in Vatohandrina even said that he was proud of the changes that occurred in the way
family planning services are used and of the significant advances that were made in terms of birth
spacing.
Likewise, the use of CHV services for child survival also increased. In the 800 KMs, there was a 38%
relative increase in case management targeting children under five suffering from respiratory
infections and a 58% increase in malaria case management. As highlighted above, the population no
longer consults traditional healers. When a child gets sick, the parents contact the CHVs.
19Table 4: Evolution of CHV service use for child survival in the 800 KMs
Number of children January to December 2011 January to December 2012 Relative
under five using specific increase
services
Respiratory infections 26,975 37,339 38%
Malaria 64,151 101,569 58%
Source: Monthly activity reports, CHV/Extranet, January 2011 to December 2012
Another important intervention for service use that is supported by the CHDC and the social quality
approach is the installation of an emergency evacuation system. The CHDC set up evacuation
systems as part of the social quality approach. The community defined the mode of transportation,
the distribution of tasks for ensuring evacuation, and, in some cases, created a solidarity fund. Both
the CHDC in Kirano Firariantsoa and the CHDC in Ambohimiarina mentioned their role in setting up
evacuation systems. In Kirano Firariantsoa, the CHDC talked about their distribution of tasks for
ensuring evacuation and their construction of stretchers. In Ambohimiarina, the CHDC mentioned
construction of chairs that could be used for evacuation as well as canoes in some of the less
accessible fokontany. Formalized in all 8000 communes, the emergency evacuation system allowed
for the referral of 7,812 individuals, including 3,471 pregnant women, 1,272 newborns and 3,069
others. (Source: Review reports, Fiscal Year 2013, January-April 2013).
CHVs believe community meetings increase
the use of health services. One CHV stated
that it promoted continuity of services
because clients were happy to be asked
about their satisfaction (CHV mother,
Kirano). Another CHV stated that the
community meetings increase people’s
trust in their services (CHV mother,
Vatohandrina). Correlation analysis
reinforced the fact that there was a
correlation between the percentage of the
population participating in community
meetings and the level of health service
use.
However, correlation analysis also showed the importance of having male participation in the
meetings. The scatter graph below shows the relationship between the participation of women in
these meetings and the use of child health services (based on the quality index). There is a clear
curve that implies that if female participation is low, service use is low as well. However, if women’s
participation is extremely high, service use is also low. The curve in this scatter graph seems to
imply that community participation needs to include both men and women and that egalitarian
20participation (between 40 and 60% women) encourages the best use of health services, particularly
for the use of child health services. For the most part, focus group discussions supported this theory
because most believe that the decision to seek care is a mutual decision. “Men and women are now
discussing health issues, and they are making health decisions together” (CHDC, Vatohandrina).
While a small number of people stated that women make the decision to take a child to a CHV, they
agreed she would definitely need her husband’s permission to go to the CSB if referred.
Figure 10: Relationship between the level of female representation in community meetings
and child health service use
250%
% of children under 5 managed for fever
200%
150%
100%
50%
0%
0% 10% 20% 30% 40% 50% 60% 70% 80% 90% 100%
Level of female representation
Source: Quality Index, 2012
V. ESSENTIAL COMPONENTS FOR SUCCESS
Based on the quantitative project data and the qualitative data collected during site visits, several
essential factors were identified as critical to the successful implementation of the social quality
approach.
A. Integration of the approach to existing structures
The use of existing structures (CHDC, community meetings and social structures) was a key factor for
success in introducing the approach. The approach was integrated into the community’s
representation framework through the CHDC. The leaders of the fokontany and the various local
authorities and members of the civil society were represented in the CHDC which was already the
official structure identified as part of Madagascar’s national community health policy. Not only did
the approach strengthen the relationship between the community and the CHDC by reporting the
community’s needs to the CHDC members, it also reinforced the accountability of CHDC members
toward the community via self-assessments.
21Likewise, the social quality approach was based on local capacity. The community evaluation
meetings as well as the CHDC self-assessments were conducted by local facilitators. The support
technicians who attended the self-assessment meetings during the CHDC review sessions did not
attend the community evaluation meetings. No financial incentives were given as part of the
community evaluation meetings. In addition, the quality improvement facilitators and the gender
facilitators are volunteers who have been designated by the community.
B. Unification of community actors
When the deputy mayor of Kirano Firariantsoa was asked what factors contributed to the success of
the approach, he mentioned the partnership between the CHDC and the CHVs and said: “The
participation of all stakeholders from the commune like a police force for enforcing activities made
this approach a success.”
The social quality approach succeeded in unifying community actors to work together. “This
approach unifies the community and improves the health environment,” a support technician said in
Vatohandrina. This unification of actors is reflected in the fact that all actors interviewed pointed
out similar successes and the same challenges. The CHDC in Ambohimiarina considered the
improved health of the community to be a result of a “trio” of actors – the head of the CSB, the
CHVs, and the CHDC. Each actor has a specified role, but they have to work together to engage the
community.
C. Promotion of gender equality
The social equality approach is based on the participation of community actors and a representative
sample of the community as a whole is expected to participate in the CHDC. The average CHDC is
made up of about 20% women but that does vary with some having much more active participation
of women and others having very limited participation of women. While not all CHDC have
appropriate representation of women, most have ensured that women are represented and given a
voice.
One of the roles of the CHDC is to promote men and women taking equal responsibility for the
health of their families. They do this by example
and by community education. During the last
application of the CHDC auto-evaluations, 86% of
CHDC members were satisfied with their
engagement in promoting equality.
The facilitators of the community meetings
encourage the participation of both men and
women in the community in order to ensure that
all community voices are heard. During focus
group discussions, a CHDC member in Fiadanana
22stated that “men and women make joint decisions” when their child is sick.
This is not just the case for child health but also for family planning. “Men used to be reluctant to
use family planning services. Now, they are the ones encouraging women to use it” (CHDC
Vatohandrina). In addition, a member of the CHDC in Kirano Firariantsoa said that the social quality
approach had promoted gender equality because family planning is more accepted and with family
planning use, women are more available for meetings and other social activities.
D. CHDC motivation
The motivation of the CHDC varied from site to site but was directly correlated with the amount of
work and/or advocacy the CHDC reported performing to understand the needs of the community,
respond to the needs of the community, and improve the quality of services provided by the CHVs
and the CSB. When asked about his/her motivation to participate in the CHDC, a member from
Vatohandrina said: “It is our social duty to improve health for everyone. Sustainable development is
impossible if the population is not healthy. A country can only thrive if the population is healthy.
That’s why we bought into the social quality approach.” This attitude was reflected in their activities
including holding community meetings, assisting the CHVs, attempting to intervene in the logistics
management issues between the mayor and the CSP, and community mobilization.
Likewise, where CHDC are more active in one aspect of their role, it seems to be based on the
motivation behind
participating in the social
quality approach. The
CHDC in Ambohimiarina
stated their motivation as
the following: “It is difficult
for the community to
access the CSB, and it can
take several hours of
transportation to access
health services. We now
have the opportunity to
access outreach health
services. Therefore, how could we not be motivated?” Thus, their primary activities revolved around
supporting the CHVs in their role, particularly building health huts, working with the CHVs to
mobilize the community and having review meetings with the CHVs to support them. An example
that is pervasive throughout the communes is that many CHDC have begun to organize review
meetings on their own. While the project encouraged quarterly review meetings to review the
progress of the action plans and support the CHVs and share feedback from the community, many
CHDC started holding monthly review meetings on their own.
23You can also read