Heathrow Air Quality Strategy 2011-2020 - Heathrow Airwatch
←
→
Page content transcription
If your browser does not render page correctly, please read the page content below
Heathrow Air Quality
Strategy
2011–2020
Contents

Foreword                                                     3

Executive Summary                                             4

1.   Introduction                                             7

2.   Purpose of Strategy                                      9

3.   Overview of regulations                                 13

4.   Local air quality and Heathrow – the current picture    17

5.   Managing Local Air Quality – Our Strategic Approach     24

Appendix 1 – Air Quality Action Plan                         27

Appendix 2 – Tables and Figures                              46

Appendix 3 – Review of the 2007-11 Air Quality Action Plan   53

Appendix 4 – Abbreviations and glossary                      55
Foreword
The UK faces many challenges in terms of meeting EU air quality limits and it is not alone.
Many parts of Europe experience similar issues, in particular in meeting limit values for the main
pollutant of concern, nitrogen dioxide (NO2).
Within the UK, it is not surprising that central London records the highest levels of NO2 nationally.
Around Heathrow, concentrations are substantially lower than in the capital but are still above
recommended levels.
Our sustainability policy for Heathrow commits us to enhance the economic and social benefits
that the UK’s only hub airport brings, while at the same time reducing our environmental impacts
and meeting agreed environmental limits. The sources of emissions in the Heathrow area are a
complex mix – from major motorways such as the M25 and M4, to the Great Western rail line,
industrial outlets and residential properties. The presence of a major international airport adds to
the emissions in the area. And while Heathrow’s operations make up a relatively small proportion of
the pollution in air around the airport – up to 20% at the airport boundary – BAA is committed to
playing its role in achieving compliance with EU air quality limits.
We have worked closely with stakeholders to align our strategy to those of others in this arena
including local authorities around the airport, the Mayor of London, and central Government
departments. We will only achieve our goals by close collaboration with other partners that have a
stake in reducing the UK’s emissions.
This Air Quality Strategy builds on the progress that has been made at the airport to reduce
emissions from its operations. Through it we have set out actions to further cut emissions from the
airport over the next 10 years. We will keep these actions under review and regularly assess their
emissions impact.
We have seen some encouraging results at Heathrow over the past three years. For example,
as airlines are replacing older aircraft with newer, low emitting models, this has brought about
significant emissions reductions. To support this, we have re-balanced airport landing charges to
encourage airlines to use cleaner, quieter aircraft which have local noise benefits too.
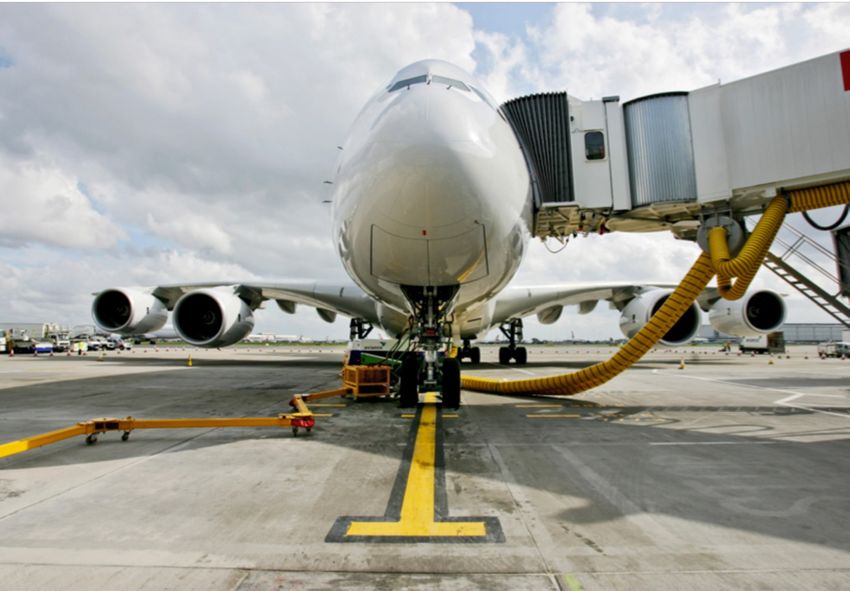
Another example is our commitment to reduce aircraft emissions on the ground. We provide power
and increasing numbers of pre-conditioned air units for aircraft, which enables airlines to reduce
their use of APUs (auxiliary power units); small jet engines which provide electrical power when
aircraft are parked and main engines are switched off. We will continue to work with airlines to
reduce APU use.
We recognise Heathrow is a small but significant source of pollution in the local area and we are
committed to playing our part to help meet AQ limits.
Colin Matthews,
Chief Executive Officer
BAA
3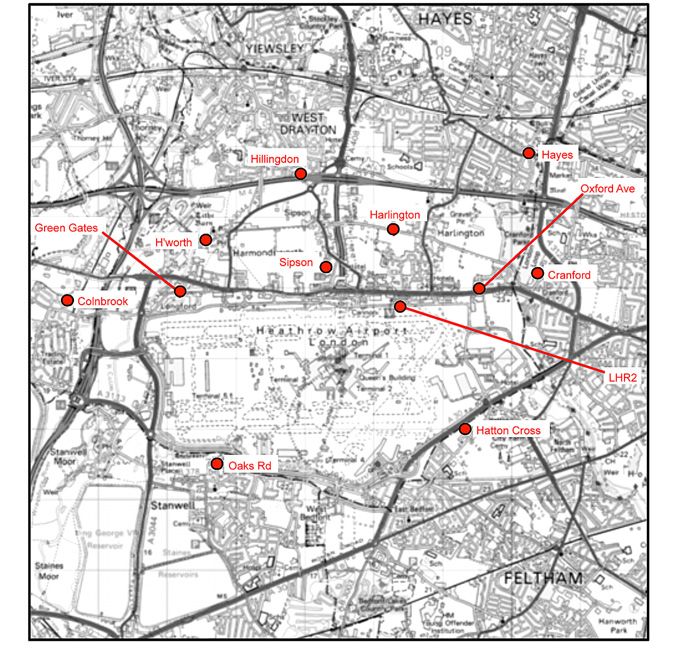
Executive Summary
Introduction
As the world’s busiest international airport and the UK’s only major hub airport, Heathrow performs
the important economic role of maintaining a frequent and profitable network of direct long haul
air routes that help the economic vitality of London and the UK.

Located to the west of London, the airport is within an area of high emissions; with significant
contributions from London itself as well as from two nearby motorways, major roads, local industry
and local housing as well as the airport. Tackling local air quality issues will require action and
collaboration from a range of industries, organisations and individuals. Where airport operations
significantly add to these emissions Heathrow Airport Ltd (HAL) will play its role in achieving
compliance with the EU limit values at sites around Heathrow. We will do this by tackling our own
emissions (those we control), and working in partnership with airlines and other companies that use
our airport to address the emissions they create (those we guide and influence).

We take a logical, systematic approach and this Strategy sets out the actions we will take to
reduce air pollution emissions. The actions taken will be balanced against the other operational
environmental needs of the airport – i.e. seeking reductions in noise and CO2 emissions. This Strategy
builds on the success of previous Air Quality Action Plans as well as incorporating new initiatives and
technological advances. It has three primary objectives:

     1.	To accurately quantify the contribution from airport related sources to local
         air quality concentrations at all relevant local receptors to ensure we focus our
         management activity in areas with the most significant impacts;

     2.	To reduce NOX emissions we control, guide and influence to help achieve
         compliance with the EU air quality limit values;

     3.	To demonstrate we are using the best practicable measures to reduce Heathrow’s
         contribution to air quality to ensure our contribution is understood by key
         stakeholders.

Pollutants of concern
Large areas of London exceed the health-based air quality limit values due primarily to emissions
from road traffic and from buildings, and every London borough has declared at least one Air
Quality Management Area (AQMA). This pattern is repeated locally, where the activities that
take place at Heathrow Airport are just one of the many sources of air pollutant emissions in the
local area.

Air quality management is a key priority for HAL and local air quality is one of the issues of concern
to local residents and national stakeholders. The main pollutants of concern in the Heathrow
area are nitrogen dioxide (NO2) and particles (measured as PM10 and PM2.5). The EU has specified
concentration limits for these pollutants due to their impact on human health. Only NO2 exceeds the
EU limit value in some local areas which requires HAL and other stakeholders to reduce emissions of
its precursor – oxides of nitrogen (NOX).

Local air quality monitoring shows measured concentrations of particles have declined over recent
years and that the UK and EU health-based air quality objectives have not been breached at
locations inside or outside the airport boundary since 2003. Even so, HAL is committed to reduce
these emissions and many of the actions within this Strategy, focussed on reducing emissions of NOX,
will also reduce emissions of particles.

                                                                                                          4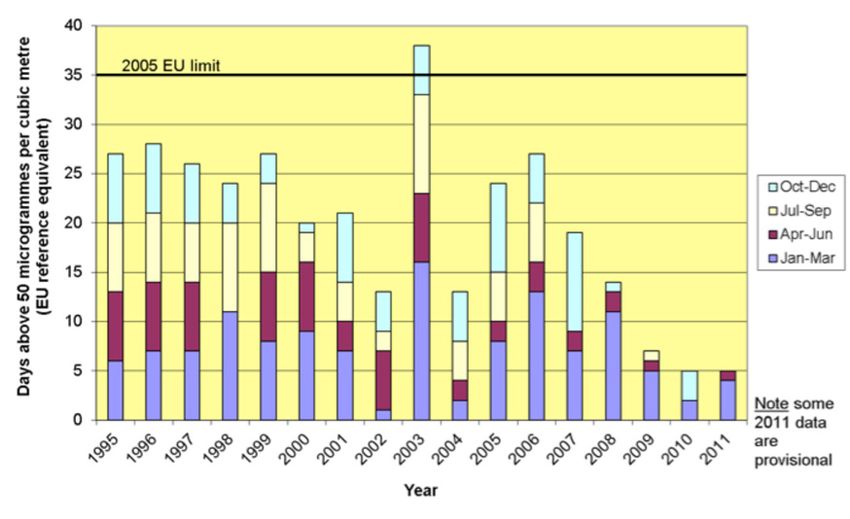
We use two methods to determine air quality levels;

          1.	Continuous air quality measurements are undertaken to national standards at a
              number of fixed sites – providing comparison with legal limit values, as well as
              historical trends and a basis to enable computer models to be verified.

          2.	Dispersion modelling gives a much clearer picture of concentrations over a large
              area, and ‘fills the gaps’ between monitoring stations. Because the modelling
              is based on an estimate of emissions in and around the airport, the impact of
              changing these emissions and carrying out future projections is also possible.

Areas of focus
HAL recently completed a new emissions inventory for Heathrow Airport1. It updates the last
inventory completed for 2002, which was used as a basis for the Project for the Sustainable
Development of Heathrow (PSDH) and takes account of the new airport layout – including Terminal 5.

Direct airport NOX (oxides of nitrogen) emissions for 2008/09 were estimated to be in the region of
5,800 tonnes. Ground level emissions, which make the most impact to local air quality, were less than
half of these – approximately 2,600 tonnes.

The main improvements to on-airport emissions were brought about from the opening of Terminal 5
enabling more efficient aircraft movements on the airport and changes to the aircraft fleet. Total
NOX emissions from ground-level aircraft sources were approximately 1,637 tonnes; a fall since 2002
of around 24 tonnes even though there were 3,500 more aircraft movements in 2008/09.

In 2010, we calculated emissions fell by approximately 80 tonnes compared with 2008/09 which
indicates two of our key policies are working well:

          1.	More aircraft with lower NOX emissions are using the airport, partly in a response
              to our landing charges. Ground emissions from aircraft main engines fell by
              approximately 45 tonnes

          2.	Limit the use of auxiliary power unit (APU) use on the airport and assess how long
              they run for. This data indicates APU emissions fell by approximately 35 tonnes,
              based on manual surveys.

Elevated aircraft NOX emissions – those produced after take-off – have a much lower impact on local
air quality. These emissions increased between 2002 and 2008/09, and although part of this increase
was due to increase number of aircraft movements, methodological changes have also had an impact
– see section 4 for details.

Emissions for airside vehicles and stationary sources increased between 2002 and 2008/09, which may
partly be due to better data collection methods for the 2008/09 inventory.

Although HAL is committed to reducing airport-related emissions, we also expect other organisations
to play their part to reduce emissions from other sources over which HAL has no influence or control;
non-airport related road traffic for example. We will work in partnership with relevant organisations
to influence emissions reduction from these non-airport sources.

This Strategy focuses on reducing emissions from the four main airport sources:

          •               Aircraft emissions – both airborne and whilst on the ground

          •               Airport-related road traffic

          •               Airside vehicles and plant

          •               Fixed energy plant

1
    AEA, 2010: Heathrow Airport Emission Inventory 2008/9 Warrington, UK.                               5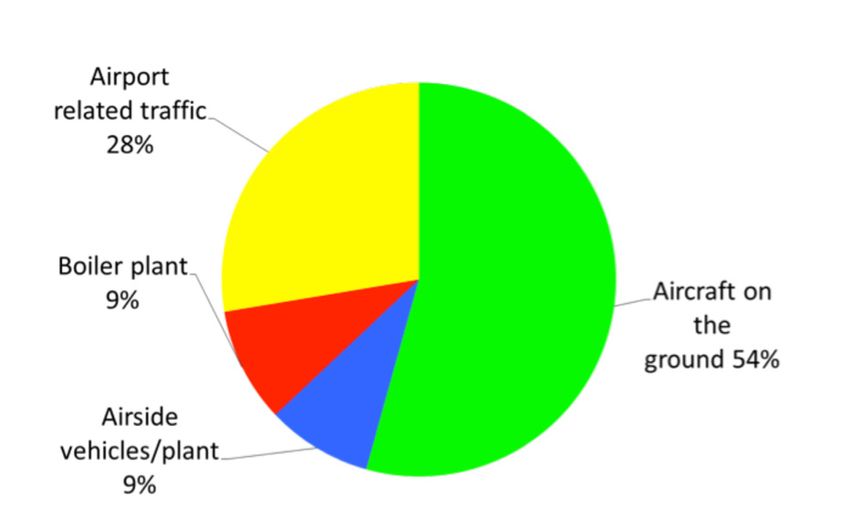
Key actions
We encourage the cleanest possible aircraft fleet to use Heathrow by levying a NOX-based landing
charge; minimise the use of auxiliary power units by enforcing mandatory time limits and encourage
the efficient movement of aircraft whilst taxiing.

Over the next 10 years, the development of low and zero emission vehicle fuels and technologies is
likely to provide a range of choices to reduce NOX (and CO2). It is not clear at this stage which will
be most appropriate for use in airside vehicles. It is likely that a mix of technologies and fuels will
be needed due to the niche applications that exist on a major airport such as Heathrow, and we
are committed to supporting the trials of new vehicle fuels and technologies to assess their cost-
benefits for deployment. These trials could include further investigations of electric vehicles, biofuels
and hydrogen.

Actions to reduce emissions from landside airport-related vehicles will be investigated and where
appropriate incorporated into the Sustainable Transport Plan in 2012.

For further information on our wider corporate responsibility programme, please visit our website
www.heathrow.com.

Key Performance Indicators
The following table summarises the Key Performance Indicators we will use to track the effectiveness
of key policies in the Strategy.

 Objective                          KPI                                Current position

 1. Accurately quantify             Maintain agreement between         met in 2008/09 inventory
 contribution from airport          monitored and modelled NOX
 related sources to local air       concentrations of ±15%
 quality
                                    Minimum of 90% data capture        9 monitors out of 13 above
                                    at our monitoring sites            90% data capture in 2010, 2
                                                                       above 80% and 2 above 75%

 2. Reduce NOX emissions we         Number of relevant air quality     3 sites out of 8 exceeded in
 control, guide and influence       monitoring sites within the        2010
                                    Heathrow Study Area which
                                    are not compliant with the EU
                                    limit value for NO2

 -Control                           PPC permit emissions limits        zero in 2010
                                    exceedance for boiler plant
                                    resulting in EA taking
                                    enforcement action

                                    Total NOX emissions from HAL       Emissions baseline of 4.2
                                    vehicle fleet                      tonnes established for 2010

 -Guide                             Proportion of ATMs by CAEP         91% ATMs CAEP 4 or better
                                    standard

                                    Compliance with maximum            2010 compliance target was
                                    APU run time allowances on         85%
                                    arrival and departure
                                                                       Actual compliance was 91%

 -Influence                         Total NOX emissions from           Calculated as 929 tonnes in
                                    airport related traffic.           2002. Updated contribution to
                                                                       be determined in 2011

 3. Demonstrate we are using        Heathrow’s performance             To be determined in 2011
 best practicable measures to       benchmarked against other
 reduce emissions and ensure        airports
 our strategy is understood by
                                    Survey of stakeholder opinion      To be determined in 2011
 key stakeholders                                                                                           6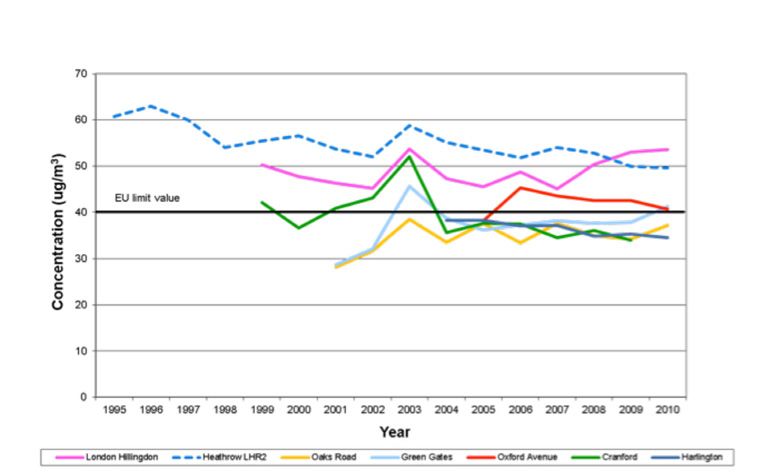
1. Introduction
Heathrow Airport
Heathrow is the world’s busiest international airport. In 2010 it handled some 66 million passengers
on approximately 460,000 flights. It has two runways and four terminals2 and approximately 90
scheduled airlines fly from Heathrow to 176 destinations around the world.

Heathrow is the UK’s only major hub airport and is vital to the health of the UK economy. Hub
airports perform an important economic role because their high proportion of transfer passengers
enables them to maintain a frequent and profitable network of direct long haul air routes that could
not be supported by a point-to-point airport.

Heathrow Airport is located on the western edge of London. Close to two motorways and the
main line rail route from Paddington to the southwest, it is in an area of high emissions. Airport
operations add to them and aircraft emissions are significant at locations directly adjacent to the
airport. Heathrow Airport Ltd (HAL), as the airport operator, will play its role in achieving compliance
with the EU limit values at sites around Heathrow. This Strategy represents HAL’s commitment to
manage air quality emissions from the airport.

Local air quality
The EU has set legally binding limit values for nine air pollutants. Two of these are of concern around
Heathrow – nitrogen dioxide (NO2) and particles (measured as PM10 and PM2.5). Based on health
studies, some pollutants have both a short-term and long-term limit value. NO2 is one example; it has
both an hourly and annual average objective.

The main pollutant of concern is NO2, and large areas of London, the rest of the UK and Europe,
exceed the annual average EU limit value, due mainly to emissions from road traffic and from
buildings. This pattern is repeated locally, where the activities that take place at Heathrow Airport
are just one of the major sources of air pollutant emissions in the local area.

Air quality management is a key priority for HAL and we use two methods to determine air quality
levels;

          1.	Continuous air quality measurements are undertaken to national standards at a
              number of fixed sites – providing comparison with legal limit values, as well as
              historical trends and a basis to enable computer models to be verified.

          2.	Dispersion modelling gives a much clearer picture of concentrations over a large
              area, and ‘fills the gaps’ between monitoring stations. Because the modelling
              is based on an estimate of emissions in and around the airport, the impact of
              changing these emissions and carrying out future projections is also possible.

Our approach to air quality management
This Strategy builds on the achievements of the second Heathrow Air Quality Action Plan, which
covered the five year period to 2011. It aligns with the current UK Air Quality Strategy, London
Air Quality Strategy and neighbouring local authorities’ air quality action plans and introduces
additional measures that focus on reducing NOX emissions up to the end of 2020. A review of the
2007-11 Heathrow Air Quality Action Plan is included in Appendix 3.

2
    Terminal 2 was being rebuilt at the time of publication.                                               7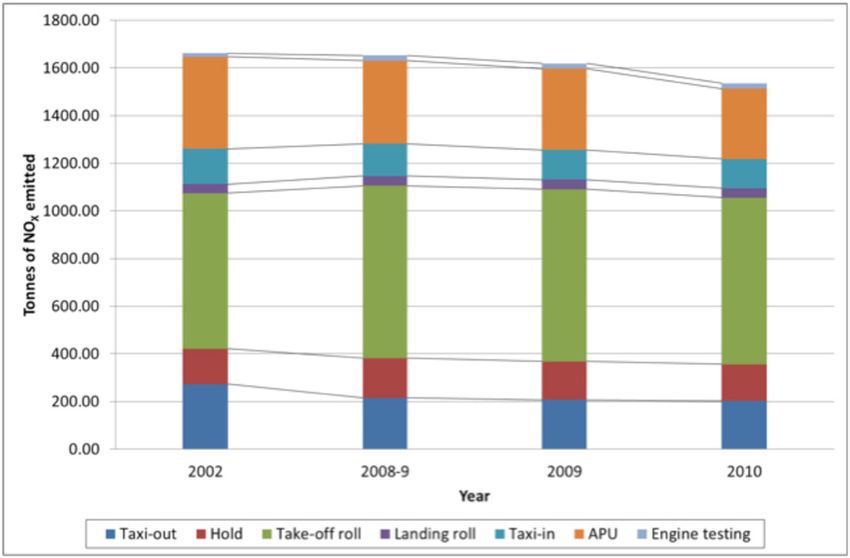
We envisage this Strategy will evolve over its implementation period as new data and emission
reduction technologies become available. Progress updates will be produced annually via our
sustainability website3 and, where appropriate, the associated Action Plan may be revised and
updated to reflect developments in government policy and regulation, scientific knowledge,
stakeholder feedback, company policy and airport air quality management.

Although HAL will focus on reducing emissions of oxides of nitrogen (NOX) the majority of actions
will also reduce other local air pollutants, such as particles. Where practicable, actions in this
Strategy will also help reduce emissions of carbon dioxide (CO2) and other greenhouse gases. Further
explanation of the relationship between greenhouse gases and local air pollutants is given in
Chapter 2.

Recent airport development
In March 2008 Terminal 5 became operational. One major aspect of its design was to improve the
efficiency of aircraft movements at the airport. Looking at aircraft movements since it opened
shows that the time taken for aircraft to taxi to the runways, and from the runways to terminals,
has decreased by about 30% on average, significantly reducing aircraft emissions on the ground. We
will work with NATS, the UK air navigation service provider, to investigate how these more efficient
movements can be maintained and improved.

A similarly designed new terminal is currently being built on the eastern end of the airport; replacing
Terminal 2. The new design should also help in reducing taxiing times as well as giving HAL the
opportunity to make the terminal itself more sustainable in terms of energy and water use.

3
    www.heathrowairport.com, click on ‘our business and community’, then click on ‘sustainability’.       8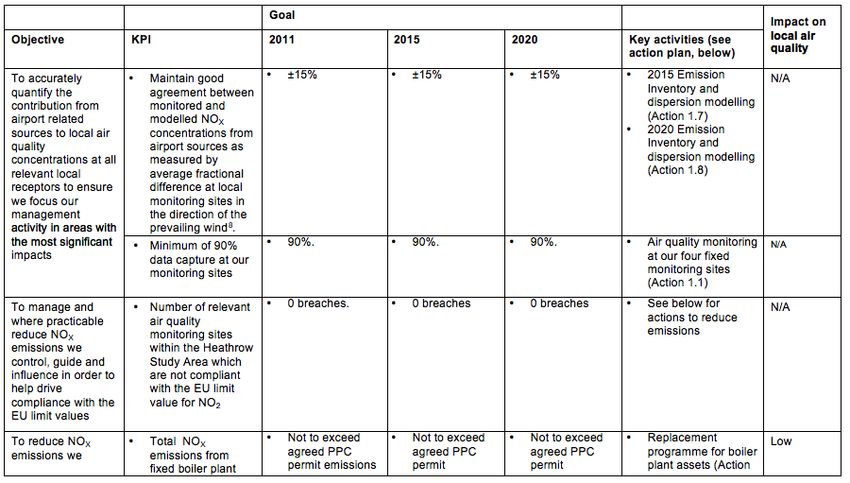
2. Purpose of Strategy
Objective

	Heathrow Airport Ltd will play its role in helping to achieve compliance with the EU limit
  values at sites around Heathrow.

Action taken by HAL will only have a limited impact to local air quality. Dispersion modelling
has shown that direct airport emissions (i.e. aircraft, airside vehicles and fixed plant) account for
between approximately 4 and 25% of concentrations within 2km of Heathrow. Consequently we
also expect other organisations to play their part to reduce emissions from other sources over which
HAL has no influence or control; non-airport related road traffic for example. We will work with key
stakeholders to facilitate further emission reductions.

We carried out a full emissions inventory and dispersion modelling for the 12 month period from
April 2008 to March 2009 to determine the emissions from the airport and from indirect airport-
related traffic (see Table 5 in Appendix 2). Since then, we have updated the aircraft component of
the Emissions Inventory twice – for 2009 and 2010, using actual aircraft movement data for each
year. We estimate ground level emissions have fallen by approximately 80 tonnes between 2008/09
and 2010 suggesting our policies are working well; particularly by encouraging airlines to use cleaner
aircraft, and by also encouraging the use of auxiliary power units to be cut.

Scope
Timescale
This Strategy outlines our approach to managing local air quality impacts associated with the
operation of a five-terminal, two-runway airport up to the end of 2020, capped at 480,000 flights.
This includes the opening of a new Terminal 2 and any other developments which have been granted
planning permission at the time of publication. It is primarily focused on reducing emissions of NOX.

We are still developing our transport policies and taking into account new data sources. We will
publish further transport related policies in a Heathrow Vehicle Emission Action Plan in 2012

Assessing air quality
The basic methodology recommended by the panel of experts who participated in the Project for the
Sustainable Development of Heathrow (PSDH) is still used to assess air quality; from the production
of emission inventories to subsequent dispersion modelling using ADMS-Airport. HAL will continue
to use the agreed methodology for future assessments, but will take into account any relevant
developments in emissions assessment methodologies or improvements to modelling.

                                                                                                         9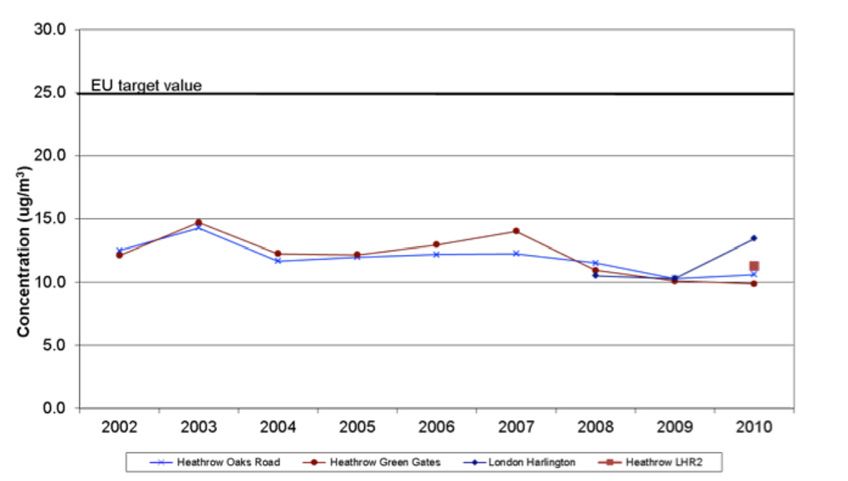
Air pollution and emissions
As mentioned previously, only two air pollutants are of concern in the local area – nitrogen dioxide
(NO2) and particles – and only NO2 exceeds the EU limit value around Heathrow. HAL is committed
to play its role in reducing emissions of its precursor NOX (oxides of nitrogen) from the four main
airport-related sources:

     •           Aircraft emissions – both airborne and whilst on the ground

     •           Airport-related road traffic

     •           Airside vehicles and plant

     •           Emissions from fixed plant

The percentage of NOX emissions estimated to come from activities relating to Heathrow are shown
Table 5 (Appendix 2) and in Figs. 1 and 2.

Fig. 1 – Estimated ground level airport-related emissions from Heathrow Airport in 2008/09

Note: Emissions from airport-related traffic is estimated using 2002 breakdown

                                                                                                       10
Ground-level emissions associated with the airport have the biggest impact on local air quality
whereas elevated aircraft emissions have less impact because they take place at increasing height.
Fig. 1 shows aircraft make up approximately 54% of ground level emissions, whereas airport related
traffic is estimated to make up a further 28%. Of any airport-related emissions, these two sources
have the most significant impact to local air quality. The remainder of emissions are from boiler
plant and airside vehicles (approximately 9% each). These two sources have a lower impact on local
air quality.
Aircraft NOX emissions are broken down further into a number of ‘activities’ in Fig. 2. Take-off roll
is the biggest emissions source (46%); though taxiing and use of auxiliary power units (APUs) are
almost as large when considered together. These areas all impact on local air quality and we have
developed actions to reduce their local impacts – see section 4.
Fig. 2 – Estimated ground level emissions from aircraft at Heathrow Airport in 2010
(% by flight phase)
Although HAL will focus on reducing emissions of NOX the majority of actions will also reduce
other local air pollutants, such as particles. Where practicable, actions in this Strategy will also help
reduce emissions of carbon dioxide (CO2) and other greenhouse gases. Further explanation of the
relationship between greenhouse gases and local air pollutants is given below.
Interdependencies between air quality and other topics
HAL has long been aware of the trade-offs between air quality and other topics such as noise and
CO2 emissions and has undertaken a number of studies to help quantify the balance that needs to
be struck for specific joint actions (e.g. in relation to reduced engine taxiing). Additional studies
will be undertaken to provide HAL with the information it needs to make informed decisions when
operational changes are planned.
11Local air quality and climate change
Emissions of carbon dioxide (CO2) and other greenhouse gases produced by operations at Heathrow
Airport are not addressed directly by this Strategy. However, the implementation of some of the
actions will result in a reduction in CO2 emissions from certain activities.
Some measures designed to tackle climate change have a beneficial effect on local air pollution,
whereas others can be detrimental. For example, improvements in aircraft engine technology
designed to improve fuel efficiency (and so reduce emissions of CO2) tend to result in fuel being
burned at higher temperatures, which increases emissions of NOX.
More research needs to be carried out to ensure that by trying to fix one problem, we do not
inadvertently exacerbate another. Where trade-offs are needed between climate change and local
air quality at Heathrow, we will take careful account of them and make an informed decision on
what action to take based on our current understanding of impacts at the airport. Work being
undertaken includes investigating the use of reduced engine taxiing and assessing the implications
of reducing APU use.
Heathrow’s carbon emissions are managed through our Climate Change Strategy which uses the
model of control, guide and influence. See website for more information; www.heathrow.com.
Local air quality and aircraft noise
The management of air quality is further complicated by the trade-offs that exist with aircraft noise
management. Most of the technological advances in aircraft design in the last twenty years have led
to a reduction in emissions of both noise and CO2. Emissions of local air pollutants such as NOX, have
been reduced through the introduction of increasingly stricter emissions standards defined by the
Committee on Aviation Environmental Protection (CAEP).
A balanced approach also needs to be taken during operations. For example, in some cases the
adoption of a reduced thrust setting for an aircraft during take-off can lower NOX emissions by up to
30% when compared to a full-thrust setting. While many airlines already employ “reduced thrust”
as their standard operating procedure and this may decrease noise in the immediate vicinity of the
airport, there can be a small increase in noise experienced further away from the airport under the
departure flight path as the aircraft takes a gentler ascent
Another example is the use of continuous descent approach (CDA), where aircraft maintain a
constant rate of descent with very limited or no periods of level flight during landing as opposed
to using a number of short descents followed by periods of prolonged level flight. The use of CDA
reduces noise as well as CO2 and NOX emissions.
Local Air Quality and Surface Access
Airport-related traffic can make a significant contribution to local air quality concentrations because
these vehicles are driven along roads where people live. Heathrow’s Surface Access Strategy 2007
– 2012 (ASAS) seeks to balance the provision and use of transport modes in relation to airport
operations. It deals with the airport’s strategic placement to act as an interchange and ‘hub’ for bus,
coach and rail routes and the quality of these modes.
The ASAS sets targets to minimise the impact arising from transport activities; such as numbers of
passengers using public transport and staff travelling in single car journeys.
HAL’s Consolidation Centre was set up in 2001 to increase the efficiency of deliveries into the airport
by reducing the number of vehicles needing to enter airside. This measure reduces congestion,
emissions of NOX and CO2 as well as ensuring timely deliveries.
To focus action on surface access issues, we will seek to develop a number of complementary actions
in the forthcoming Heathrow Vehicle Emission Action Plan aimed at reducing NOX and CO2 emissions
from traffic HAL can influence.
More information is available in our brochures Towards a Sustainable Heathrow from
www.heathrowairport.com.
123. Overview of regulations
This section summarises the principle legislation and regulations for the management of air quality
in the UK. Table 1 (Appendix 2) provides a brief summary.
Air quality regulation
Global
International Civil Aviation Organisation (ICAO)
The ICAO is an inter-governmental organisation and develops the principles and techniques of
international civil air navigation as well as planning the development of international air transport.
One of ICAO’s chief activities is the establishment of International Standards, Recommended Practices
and Procedures regarding the technical fields of aviation, including aircraft emissions.
Through its Committee on Aviation Environmental Protection (CAEP), ICAO has set progressively
tighter certification standards for air pollutant emissions from new and future civil aircraft, which
are known as CAEP standards. The latest standard is CAEP/6, with CAEP/8 coming into force in 2012.
Europe
European Union
EU directives define the policy direction to be taken by Member States’ governments by providing
a framework for emissions reduction, ranging from; setting targets for tighter vehicle emission
standards to setting national emissions ceilings for each Member State.
To address the health impacts of poor air quality, the EU placed a requirement on Member States
to achieve prescribed health-based air quality limits through the Air Quality Framework Directive
on Ambient Air Quality (see Table 2). These limits are legally binding and must be met by the UK
Government (see Table 3). The EU Directive recognised member states may need more time to meet
the EU limit values for NO2 and enables them to apply for a time extension. More detail can be found
on the Defra website, www.defra.gov.uk.
UK
DfT
DfT is responsible for transposing EU legislation into UK law with respect of tighter vehicle emissions
limits and road pricing. It is also responsible for providing fiscal support for alternative technologies
(e.g. electric vehicles) either directly, or through grant bodies, such as the Office for Low Emission
Vehicles and CENEX. Under the Civil Aviation Acts, DfT also has direct control over many aspects of
aviation at Heathrow Airport. Operational procedures and operating restrictions relate largely to
noise. Some measures help reduce air pollution emissions, such as continuous descent approach and
banning noisier Chapter 2 aircraft.
Defra
Defra is the lead Government department in terms of air quality and has published its UK Air Quality
Strategy as required by the Environment Act 1995 (which also outlines measures to be taken by the
Mayor of London and local authorities to improve air quality under the local air quality management
(LAQM) regime). The UK Air Quality Strategy provides a framework to identify air quality
13improvement measures and sets out a co-ordinated approach to achieve them. It implements the
requirements of the EU Air Quality Directive which defines the EU air quality limit values for specific
pollutants. Defra is also able to specify tighter national air quality objectives if it chooses. At the time
of going to press, Defra is expected to apply to the EU for a five year time extension to enable the
EU limit values for NO2 to be achieved within 40 of the 43 UK regions which still exceeded in 2010.
Regional regulation
Established by the Greater London Authority Act 1999, the Mayor of London is required to produce
an Air Quality Strategy as one of several strategies for Greater London. The Mayor’s Air Quality
Strategy is required to include proposals and policies to implement measures in the UK Air Quality
Strategy as well as any other proposals and policies which may act to improve air quality. In addition,
the Mayor of London has a duty to assess the air quality action plans of London local authorities and
ensure actions are commensurate with both the London and UK Air Quality Strategies.
Local regulation
As required under the Environment Act 1995, local authorities have a statutory duty to review and
assess air quality in their area and to identify areas of poor air quality where national targets will
not be met. If after carrying out a review and assessment, a local authority finds that one or more
of the EU limit values or national air quality objectives is likely to be breached, it is obliged by law
to declare an Air Quality Management Area (AQMA). Once an authority has declared an AQMA, it
must then develop an action plan which sets out how it will use its powers to help meet the EU limit
values or national objectives. This duty is described as Local Air Quality Management (LAQM).
Nationally, more than 200 local authorities have identified locations within their boundaries where
the EU limit values have been, or are likely to be breached. This equates to 40 out of 43 UK regions
having areas of exceedence within them.
The four local authorities closest to Heathrow (LB Hillingdon, LB Hounslow and Spelthorne and
Slough Borough Councils) have all declared air quality management areas (AQMAs) for NO2. HAL is
working especially closely with these local authorities to implement measures to improve air quality
in the Heathrow area and this Strategy is a key element of this work.
Heathrow’s role and the regulation of air pollutant emissions at source
As explained earlier in this section, many organisations are involved in regulating emissions of
air pollutants from many sources and HAL encourages action to reduce NOX emissions from these
sources. Local authorities can include actions related to these organisations, as appropriate, within
their air quality action plans. HAL seeks to reduce emissions from the sources outlined below.
Emissions from aircraft
Aircraft emissions are regulated in the UK by the European Aviation Safety Agency and the UK Civil
Aviation Authority (CAA). As outlined above, the International Civil Aviation Organisation (ICAO)
publishes internationally agreed standards and recommended practices on aircraft engine emissions
through its Committee on Aviation Environmental Protection (CAEP).
Emissions standards for new aircraft were agreed at the CAEP/6 meeting in 2004 and were applicable
from 2008. At the CAEP/8 meeting in 2010, these standards were further modified for new engine
14types certified after 31 December 2012. The ICAO standards are ‘technology following’ and many
aircraft engines manufactured before the CAEP/8 meeting already met the CAEP/8 standards.
Current operational fleets contain aircraft with a mix of CAEP emission standards, which are a
function of the time these aircraft were bought or leased. This has an important impact on NOX
emissions because there is a time lag between new technology being introduced and then being
taken up in large enough volumes to start having a positive impact on emissions. The lifetimes
of aircraft are generally between 30 and 40 years, so the introduction of cleaner aircraft is a long-
term solution.
In order to encourage a quicker take-up of cleaner aircraft, HAL introduced a NOX charge as part of
its landing charges in 2004 to incentivise airlines to operate planes with lower emissions. The NOX
fee was increased at twice the rate of the underlying increase in landing charges to provide a more
robust financial incentive for airlines to reduce emissions.
In 2010 we reviewed the landing charging structure and following consultation with partner airlines
we introduced a new landing fee structure in April 2011. The new landing fee charges reflect the
changing priorities of air travel and will strengthen the incentives for airlines to use Heathrow in the
most efficient way, with the quietest and cleanest aircraft. The charge for NOX was increased from
£2.73 per kg to £5.18.
Emissions from other airport operations
Emissions from transport
We use the Euro and Stage emission standards to encourage the use of cleaner vehicles on
the airport.
HAL’s current Airport Surface Access Strategy has targets to increase the proportion of passengers
who travel to the airport by public transport, and as a consequence reduce emissions by reducing
the number of private cars driven on local roads. We will seek to incorporate into our Surface Access
Strategy air quality objectives to develop the transport provision relevant to Heathrow.
Emissions from boilers
At Heathrow Airport our network of fixed boilers, which produce heating and hot water for the
terminals and associated buildings, is regulated by the Environment Agency through a Pollution
Prevention and Control Permit. The main aim is to reduce emissions of NOX, but it also controls other
environmental impacts from their operation. When we install new equipment our aim is to use the
most energy efficient plant with the lowest CO2, NOX and particle emissions.
15Planning conditions
Where further development of Heathrow Airport may result in an increase of air pollutant emissions,
the local planning authority can choose to impose planning conditions on HAL to mitigate the local
impact.
For example, the planning permission for Terminal 5 set a number of conditions which relate to air
quality:
• limit of 480,000 air transport movements per year which restricts the total number
A
of aircraft that can use Heathrow.
• A limit on the number of car parking spaces for both passengers and staff to 42,000
• he production of a five-year air quality strategy to show how HAL intends to
T
minimise the emissions of pollutants attributable to Heathrow Airport.
Roles of others
Other organisations have a big role to play in reducing emissions relating to the airport, or to control
emissions in the local area over which HAL has no influence. HAL will continue to reduce emissions
we are directly responsible for and seek to reduce emissions from sources we guide and influence.
We also seek to work in partnership with other organisations to reduce emissions from sources that
are beyond our control, for example;
• lobbying aircraft manufacturers (via ICAO and UK Government) to increase focus on
landing and take-off cycle NOX emissions and CAEP standards;
• orking with NATS (which provides air traffic control services) and the CAA (Civil
w
Aviation Authority) to reduce emissions from ground operations at Heathrow;
• orking with aircraft manufacturers, airlines and research bodies for improved
w
emissions-related data, and;
• s upporting the work of DfT, the Highways Agency, Mayor of London, Network Rail
and rail operators to reduce the emissions from sources under their remits.
164. Local air quality and Heathrow – the current picture
Pollutants of concern
This Strategy addresses the air pollutants of most concern in the local area –nitrogen dioxide and
particles – due to their impact on health and the local environment. Only the annual average NO2 EU
limit value is exceeded in the local area.
Nitrogen dioxide (NO2) is formed during combustion. Operation of vehicles, aircraft and boilers,
for example, produces oxides of nitrogen (NOX), which is a mixture of gases made up primarily from
nitrogen dioxide (NO2) and nitric oxide (NO). NO reacts with ozone in the air to form more NO2 over
time, so the proportion of NO2 within a concentration of NOX can increase with increasing distance
from the source.
Particles (PM10 and PM2.5) are categorised in terms of their size. PM10 refers to particles with an
aerodynamic diameter of less than 10 microns (µm) and PM2.5 is a sub-set of this, referring to particles
of less than 2.5µm. PM10 and PM2.5 are produced from a wide range of materials and from many
sources including vehicles, aircraft and boilers, brake and tyre wear, fires and construction. Natural
sources can also be significant, e.g. sea salt blown inland.
Air quality monitoring locations and trends
Fig. 3 – Principal automatic air pollution monitoring sites near Heathrow Airport
Reproduced from Ordnance Survey digital map data © Crown copyright 2009. All rights reserved.
17The Heathrow Airwatch website4 provides information on air quality monitoring carried out by HAL,
local authorities and Government around Heathrow Airport. Measurements are undertaken by both
automatic monitoring equipment and passive methods, such as NO2 diffusion tubes. Fig. 3 indicates
the location of the key automatic monitoring sites and the boundary of the Heathrow Study
Area5 used for our dispersion modelling exercises. More information of the range of air pollutants
measured at each site is in Table 4 in Appendix 2.
Fig. 4 – Annual average NO2 concentrations measured at a selection of sites around Heathrow
Airport from 1995
Fig. 4 shows the annual trends in NO2 concentrations measured at a selection of key sites. Over the
last decade, concentrations have fallen at most monitoring sites, though these reductions are not as
fast as predicted; mainly because the benefits of replacing older road vehicles in the UK fleet with
new models with tighter exhaust emissions standards have not been as great as forecasts suggested.
A number of pollution incidents occurred in 2003 due to prolonged hot, sunny conditions producing
higher than average NO2 concentrations. The peak in annual average concentrations can be clearly
seen, and was mirrored at monitoring sites across the UK.
The PM10 EU limit value has been met at all monitoring sites in the Heathrow Study Area for a
number of years. In general, concentrations are highest at LHR2, where the EU limit value for PM10
has been met since 2003, when unfavourable weather conditions produced 38 breaches of the EU
limit value and also affected sites throughout the UK. See Fig. 5.
It is not unusual for daily mean PM10 levels to exceed 50µg/m3, though the EU limit value allows 35
exceedances (equal to 35 days) per year before the limit value is breached.
4
www.heathrowairwatch.org.uk
5
Heathrow Study Area is a 81km2 zone around the airport 18Fig. 5 – Comparison of daily average PM10 concentrations with the EU limit value on Heathrow
Airport from 1995
As well as PM10, HAL also monitors the finer fraction PM2.5 at all four of its monitoring sites. Fig. 6
shows annual mean concentrations of PM2.5 measured at Green Gates, Oaks Road, Harlington and
LHR2 in 2010 were less than half of the EU target of 25 µg/m3.
Fig. 6 – Annual average gravimetric PM2.5 measurements at HAL’s monitoring sites from 2002
192008/9 Emissions Inventory and subsequent work
HAL recently completed a new emissions inventory for Heathrow Airport6. It updates the previous
inventory for 2002 and took into account the new 5-terminal airport layout.
Because Terminal 5 opened in March 2008 a convenient 12 month period needed to be chosen
so that dispersion modelling could be carried out, enabling air pollution concentrations to be
calculated. The inventory runs for the 12-month period April 2008 – March 2009. Emissions were
assessed for the pollutants NOX, PM10 and PM2.5.
The Inventory covers an area approximately 81 km2 around the airport, as shown in Fig. 3 and Table 6
(Appendix 2) summarises estimated emissions from four major airport sources and road traffic within
it. The proportion of NOX emissions from ground-level airport activities are summarised in Figs. 1 and
2 on pages 11 and 12.
The main improvement to on-airport emissions is brought about from the opening of Terminal 5
enabling more efficient aircraft movements on the airport – cutting NOX emissions by approximately
75 tonnes. Since 2002, APU emissions were cut by approximately 40 tonnes, helping to bring about
a total fall from all ground-level aircraft activities of 24 tonnes even though there were 3,500 more
aircraft movements in 2008/09. Total ground level aircraft emissions were approximately 1,637
tonnes.
Since 2009 we have produced an annual mini-update of the inventory to assess aircraft emissions and
the NOX results are shown in Fig. 7.
Fig. 7 – Comparison of total annual ground level aircraft NOX emissions at Heathrow Airport
6
AEA (2010) Heathrow Airport Emission Inventory 2008/9 Warrington, UK 20In 2010, emissions of NOX fell for three main reasons:
– NOX landing charges have encouraged the use of cleaner aircraft, and main engine emissions
fell by approximately 45 tonnes
– Limit the use of auxiliary power unit (APU) use on the airport and assess how long they
run for. This data indicates APU emissions fell by approximately 35 tonnes, based on
manual surveys.
– Fewer aircraft movements resulted in a further reduction of 25 tonnes
Due to increased dilution and dispersion and because they take place at increasing height, elevated
aircraft emissions – from take-off to 1,000m – have a less significant impact on air quality than
aircraft emissions on the ground. These emissions were approximately 2,806 tonnes in 2008/9.
Emissions for airside vehicles and stationary sources increased, due to increased fuel sales. This
increase may partly be due to an artefact of better data collection methods for the 2008/09
inventory. Airside vehicles may be the focus of further emissions reduction policies in the Heathrow
Vehicle Emission Action Plan.
Emissions from airport car parks and surrounding roads decreased since 2002. This was due to
increased numbers of newer vehicles with lower exhaust emissions replacing older models. Airport-
related landside vehicles will be a focus of the Heathrow Vehicle Emission Action Plan.
At the time when the inventory was being developed no new data was available on the proportion
of airport-related vehicles which use landside roads. The split estimated in 2002 is used as the best
available data and estimated emissions were approximately 880T. HAL has commissioned work in
2011 to update this data set and produce an improved emissions estimate.
Source apportionment at air quality monitoring sites around Heathrow
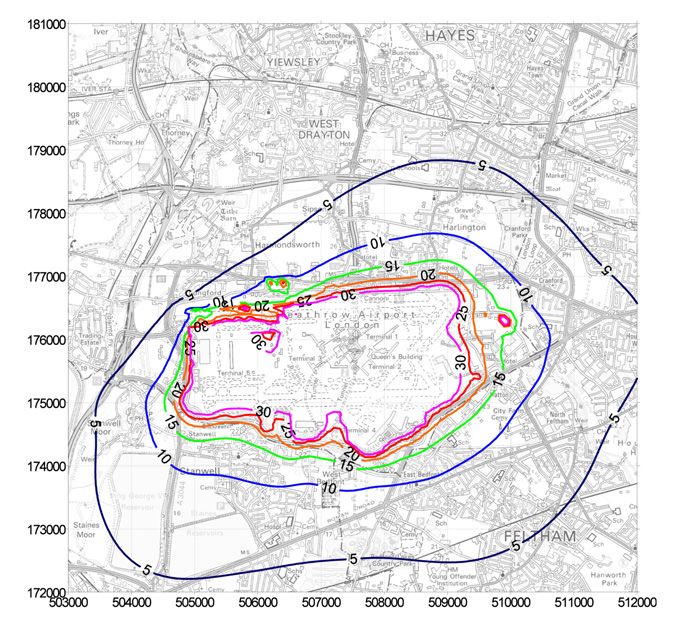
Fig. 8 – Airport contribution to 2008/9 period-mean NOX concentrations (contours shown for 5µg/m3
to 30µg/m3)
Reproduced from Ordnance Survey digital map data © Crown copyright 2009. All rights reserved.
21Direct emissions from Heathrow Airport have a lower impact at monitoring sites outside of
the airport boundary, compared to emissions from road traffic7 which predominates at them.
Background concentrations, comprising local emissions from housing, minor roads and from London
and the southeast, are also higher than emissions from the airport itself.
Fig. 8 was produced as part of HAL’s 2008/9 Emission Inventory modelling evaluation. It shows only
the calculated NOX contribution from direct airport emissions (i.e aircraft, airside vehicles and fixed
plant). Relatively high (approximately 30%) airport-related concentrations are present on the campus
and close to the boundary, but concentrations directly attributable to airport-related emissions
fall quickly with distance from the airport. The impact of the prevailing wind can be seen, which
blows emissions to the north and east of the airport. Direct airport emissions make a very small
contribution to concentrations at the monitoring station adjacent to the M4 where traffic is the most
significant source. It is approximately 1.8km from the airport boundary.
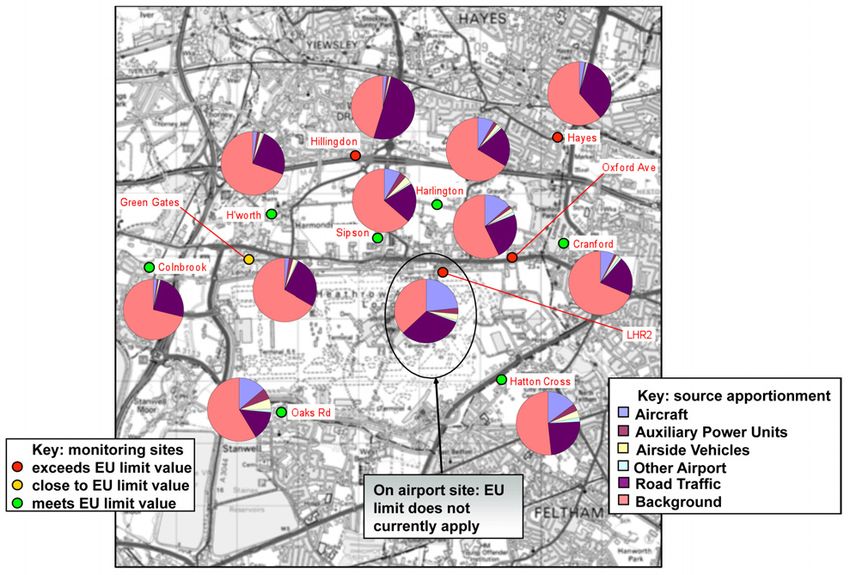
Fig. 9 – NO2 monitoring sites and 2008/9 NOX source apportionment estimates
Fig. 9 shows the estimated NOX emissions that contribute to measurements at each of the monitoring
sites on and around Heathrow. Comparing these estimates with Fig. 8, direct emissions from the
airport are significant at the three monitoring sites closest to the airport to the northeast, east and
southwest (Oxford Avenue, Hatton Cross and Oaks Road respectively), though background emissions
(local housing, minor roads and emissions from London and the southeast) predominate at them all.
Direct airport emissions make up approximately 14%, 19% and 17% respectively of concentrations at
these three sites.
7
irport-related traffic will have an impact to local air quality. HAL will make an assessment of this impact as
A
part of its on-going air quality assessment in 2011. 22The influence of Heathrow’s direct emissions can be seen by looking at the proportion of the
different emission sources at three monitoring stations which are roughly in line going north from
the northern runway:
1. LHR2 where 33% of emissions are directly from airport operations
2. Sipson 0.5km away, where 11% of emissions are directly from airport operations
3. M4 1.8km away, where 4% of emissions are directly from airport operations
Particulates
None of the EU limit values are exceeded for particles on and around Heathrow Airport. Even so,
HAL is committed to reducing these emissions. Many of the actions within this Strategy, focussed on
reducing emissions of NOX, will also reduce emissions of particles.
Table 6 (Appendix 2) gives estimates of PM10 emissions, and comparison with emissions in the 2002
inventory.
235. Managing Local Air Quality – Our Strategic Approach
Heathrow Airport Ltd will play its role in helping to achieve compliance with the EU
limit values at sites around Heathrow.
The Strategy has the following three objectives:
1. To accurately quantify the contribution from airport sources to local
air quality concentrations to ensure we focus our management
activity in areas with the most significant impacts
Our primary aim is to understand the quantity of emissions coming directly from the airport, the
quantity and source of other airport-related emissions and the impact these all have to local air
quality. We use two methods – air quality monitoring and dispersion modelling based on a specific
emissions inventory.
Access to a good quality, robust database is critical to our ability to assess airport-related emissions
on a year-on-year basis and their impact on local air quality. The availability of new sources of data
may require a subsequent change to our emission inventory methodology and we will seek to
develop these two separate, but mutually dependent work streams in a coordinated way.
Key actions include:
• Improving our sources of airport activity data for more robust emission assessments
• Testing the NOX emission impact of potential new airport policies (e.g. reduced
engine taxiing)
• Annual assessment of key policies and their impact to NOX emissions
Key performance indicators:
• Maintain agreement between monitored and modelled NOX concentrations of
±15%
• Minimum of 90% data capture at our monitoring sites
2. To reduce NOX emissions we control, guide and influence to help
achieve compliance with the EU air quality limit values
Our action plan addresses our air quality management responsibilities. It focuses on the four main
sources identified in the 2008/09 Heathrow Emissions Inventory namely:
• Aircraft in the air and whilst on the ground
• Airport-related road traffic
• Airside vehicles and plant
• Fixed boiler plant.
24The level of control HAL has can be divided into three areas. These are:
• ontrol – airport fixed energy plant and vehicles we own or lease (approximately
C
10% of airport-related emissions)
• uide – aircraft ground movements, airside vehicles and staff travel to and from the
G
airport (approximately 30% of airport-related emissions)
• Influence – aircraft fleet mix and passenger travel to and from the airport
(approximately 60% of airport-related emissions)
As well as continuing with existing actions to reduce emissions, the action plan defines a number
of new areas to be developed to either trial or roll-out new emissions reduction measures. Where
appropriate, estimated impact to NOX emissions is included for each action in the action table in
Appendix 1.
Key actions to reduce aircraft emissions include:
• egular review of landing charges in order to encourage the greater use of cleaner,
R
quieter aircraft
• inimising emissions from APUs (auxiliary power units) by maximising the use of
M
FEGP (fixed electrical ground power) and, where fitted, PCA (pre-conditioned air)
• Encouraging airlines to sign up to the Departures and Ground Operations Code
of Practice
• Working with NATS to further reduce NOX emissions during aircraft operations (e.g.
taxiing and hold and use of reduced engine taxiing)
Key actions to reduce airside vehicle emissions include:
• We expect all companies to comply with the current vehicle OSIs (operational
safety instruction)
• orking with our Clean Vehicle Programme and Sustainability Partnership members
W
to help implement actions to reduce emissions from the airside fleets (e.g. electric,
hybrids, biofuels and hydrogen).
• arrying out exhaust emissions checks to VOSA (Vehicle and Operator Services
C
Agency) standards
• evising training materials to include reference to eco driving for all drivers who
R
require an airside driving permit.
• eviewing the relevant vehicle OSI with the aim of introducing minimum exhaust
R
emission standards
• S eeking to provide adequate infrastructure to encourage the use of low and zero
emission vehicles on the airport, including safeguarding land for future use.
Key actions to reduce airport-related landside vehicle emissions include:
• orking with our Clean Vehicle Programme and Sustainability Partnership members
W
to reduce emissions from the airport-related landside fleets.
• S eek to incorporate into our Sustainable Transport Plan air quality objectives to
develop the transport provision relevant to Heathrow.
• Supporting the Hytec Project for 15 hydrogen taxis in London by 2012.
25Key Performance indicators:
• umber of relevant air quality monitoring sites within the Heathrow Study area
N
which are not compliant with the EU limit value for NO2
• PPC Permit compliance for boiler plant
• Total NOX emissions from HAL vehicle fleet
• Proportion of ATMs by CAEP standard
• Compliance with maximum APU run time allowances on arrival and departure
• Total NOX emissions from airport related traffic.
3. To demonstrate we are using the best practicable measures to
reduce Heathrow’s contribution to air quality, balanced against the
other operational needs, and to ensure our strategy is understood
by key stakeholders
Having a full understanding of current emissions sources and the impact of emission reduction
measures is crucial to our work on the airport. We have identified a number of key areas where
improved information could help our management of air quality. New actions which the action plan
seeks to develop include:
• Investigating new methods of air quality monitoring on the airport
• Investigating improvements to our research methods
• rialling new vehicle fuels and technologies to assess their cost-benefit for
T
deployment, such as electric vehicles, biofuels and hydrogen
• Benchmarking HAL with other suitably sized airports.
• Regular emission assessment of NOX, noise and for other pollutants (e.g. particles
and CO2).
• ndertake occupational exposure monitoring at least once a year in undercrofts
U
and other high risk areas.
Key performance indicators:
• Heathrow’s performance benchmarked against other airports
• Survey of stakeholder opinion
The support of stakeholders is key to our success and is an area we seek to continuously improve. We
already report on air quality regularly to local groups; the Heathrow Airport Consultative Committee
(HACC), Local Focus Forum (LFF) and the Heathrow Air Quality Working Group (HAQWG). We will
continue to liaise with the Mayor of London and UK Government to ensure regional and national
policy with regards to air quality development is fully informed and is both realistic and possible.
Finally, research into the environmental impacts of aviation is the main way for technological
changes to happen and HAL will continue to support organisations such as CAEP and the OMEGA
Partnership in the work they do in this area.
Some potential action HAL could take to reduce emissions need agreement at an international level
to enable them to take place. For example, it is not legally possible for HAL to ban from landing
aircraft with very high NOX emissions. We will seek to influence the work of the EU and international
aviation bodies to develop measures that can be taken on a national basis or by individual airports.
26Key Performance Indicators (KPIs)
A small number of KPIs have been developed to track the delivery of this Strategy and to assess its
impact. The chosen KPIs are outlined below.
8
OTE: value was +13.7% for 2002 HEI, and – 5.6% for 2008/9 – This is a measure of the inherent variability in pollution measurement, dispersion modelling and our accuracy in assessing airport emissions –
N
so is not necessarily an area where we can drive improvement, but is an area where we can show the level of confidence we place in the results of our full airport inventories. 2728
29
Appendix 1 – Air Quality Action Plan
Air quality is one of the key environmental topics for Heathrow. In particular, emissions of NOX from
the airport impact significantly on local concentrations of NO2, which exceed the health-based EU air
quality limit values (due to be met in 2010). This Action Plan details what HAL will do to manage and
reduce emissions from aircraft, vehicles and fixed plant to help local sensitive areas meet the EU limit
values.

Key to emission reduction estimates:

•         high >50 T/yr

•         medium = 20 – 50 T/yr

•         low
31
32
33
34
35
36
37
38
39
40
41
42
43
44
45
Appendix 2 – Tables and Figures
Table 1. Overview of legal duties in relation to air quality

                                                               46
Table 2. EU Air Quality Limits for NO2 and PM10
47Table 3. UK Air quality objectives from the Air Quality Strategy 2007 for NO2, PM10
and PM2.5
a. Measured using the European gravimetric transfer sampler or equivalent.
48Table 4. pollutants measured at automatic air pollution monitoring
sites close to Heathrow Airport
49You can also read