AIRPORT FUNDING Aviation Industry Changes Affect Airport Development Costs and Financing
←
→
Page content transcription
If your browser does not render page correctly, please read the page content below

United States Government Accountability Office
                             Testimony
                             Before the Subcommittee on Aviation,
                             Committee on Transportation and
                             Infrastructure, House of
                             Representatives
                             AIRPORT FUNDING
For Release on Delivery
Expected at 10:00 a.m. EDT
Wednesday, June 18, 2014

                             Aviation Industry Changes
                             Affect Airport Development
                             Costs and Financing
                             Statement of Gerald L. Dillingham, Ph.D., Director,
                             Physical Infrastructure Issues

GAO-14-658T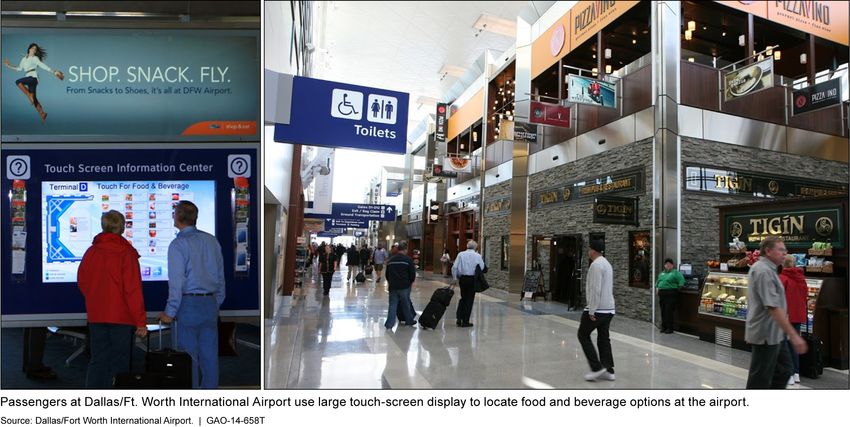
June 2014

                                                AIRPORT FUNDING
                                                Aviation Industry Changes Affect Airport
                                                Development Costs and Financing
Highlights of GAO-14-658T, a testimony
before the Subcommittee on Aviation,
Committee on Transportation & Infrastructure,
House of Representatives

Why GAO Did This Study                          What GAO Found
U.S. airports are important contributors        Since 2007, economic pressures—including high fuel prices, the financial crisis,
to the U.S. economy, providing mobility         and the ensuing recession of 2007–2009—contributed to airline restructuring
for people and goods both domestically          which has resulted in reductions in the number of commercial flights at airports,
and internationally and often                   especially at medium- and smaller-sized airports. General aviation activity, which
contributing to the economic success            includes all forms of aviation except commercial and military, has also declined
of the communities served. Since 2007           over the last decade. Because many sources of airport funding, including federal
when GAO last reported on airport               support and locally generated revenue, are tied to aviation activity, for many
funding and its sufficiency to meet             airports these trends mean less funding available for infrastructure development.
planned development of airport
infrastructure, there have been                 According to Federal Aviation Administration’s (FAA) estimates, airports' total
significant changes in the aviation             costs of planned infrastructure development eligible for federal support from
industry. During this time, federal             FAA’s Airport Improvement Program (AIP) grants are about $42.5 billion for the
support for airport development has             2013 through 2017 period, or about $8.5 billion per year on average which was
declined. As deliberations begin in             down 18 percent from $52.2 billion for the 2011 through 2015 period. FAA
advance of FAA’s reauthorization in             attributed the decline to airports’ choosing to defer projects due to reductions in
2015, Congress will consider the most           aviation activity or having identified other funding sources, among other factors.
appropriate type, level, and distribution       Airports in the national airport system receive AIP entitlement grants for eligible
of federal support for development of           projects, generally those that enhance capacity, safety, or environmental
the national airport system.
                                                conditions. The U.S. airport association, Airports Council International—North
This testimony discusses trends in (1)          America, estimated costs of other planned development not eligible for federal
aviation activity at airports since 2007,       support, such as parking structures, totaled $4.6 billion per year for the 2013
(2) costs of airports’ planned                  through 2017 period. Therefore, the total costs of planned development for the
development, and (3) federal funding            most current period are estimated to be approximately $13.1 billion per year.
and airport revenues that may be
available to finance development                To fund infrastructure development, some airports, especially smaller sized
costs. This testimony is based on               airports, rely on AIP funds which have averaged a little over $3 billion in annual
previous GAO reports on aviation from           grants and have decreased in recent years. In addition, federally authorized
June 2007 through June 2014,                    Passenger Facility Charges (PFC) collections by airports totaled about $2.8
updated through June 2014 with                  billion in 2013, more than $100 million less than the peak in 2006, prior to the
interviews with key FAA and trade               recession. PFCs have been capped at $4.50 per flight segment since 2000. To
association officials and FAA airport           finance more than $7 billion in airports’ planned development costs not covered
funding data from 2005-2013. GAO                by AIP and PFCs, airports seek to generate more revenues. Growth in
shared the information it used to               passenger related non-aviation revenue, for example from parking and
prepare this statement with FAA and             concessions, has grown over 4 percent on average each year since 2004.
incorporated its comments as                    Airports are also exploring more innovative options to boost revenue, including
appropriate.                                    commercial retail and leisure enterprises, hotels and business centers, medical
                                                facilities, and specialized cargo handling and refrigerated storage facilities,
                                                among other developments. Airports have also sought private sector participation
                                                to finance airport development projects. For example to demolish old terminals
                                                and to construct, partially finance, operate, and maintain a new terminal at
                                                LaGuardia Airport in New York, the private sector will provide financing in return
                                                for a share of the airport’s revenues. However, many smaller airports may find it
                                                difficult to access private capital markets.

View GAO-14-658T. For more information,
contact Gerald L. Dillingham, Ph.D. at (202)
512-2834 or dillinghamg@gao.gov.

                                                                                         United States Government Accountability Office
Chairman LoBiondo, Ranking Member Larsen, and Members of the Subcommittee: I am pleased to be here today to discuss airport funding as you begin considering reauthorization of the Federal Aviation Administration (FAA). U.S. airports are important contributors to our economy, providing mobility for people and goods both domestically and internationally, and often contributing to the economic success of the communities served. Since 2007, when we last reported on airports’ funding and its sufficiency to meet airports’ planned development costs, 1 aviation activity has slowed or even declined at many airports, while activity has become more concentrated at larger airports. This has affected the demands on infrastructure at these airports, as well as their finances. Also, federal support for airport development has declined during this period. In response, airports have leveraged their expected future revenues and have sought to increase their non-aviation revenues to finance past or current development. To meet future planned development costs, airports have sought an increase in the cap on Passenger Facility Charges (PFC), which are added to ticket prices along with federal taxes. However, airlines strongly oppose an increase because higher ticket prices could reduce passenger demand and therefore airline revenues. My statement today focuses on funding for airport development. Specifically, this statement discusses trends in (1) aviation activity at airports since 2007, (2) costs of airports’ planned development, and (3) federal funding and airports’ revenues that may be available to finance development costs. This statement draws from our body of work, completed from June 2007 through June 2014 examining airport and aviation-industry trends. Specific products from this work are cited throughout the statement. The products cited contain explanations of the methods we used to conduct this work. We have updated this work through June 2014 with interviews with key FAA and trade association officials and updated FAA airport funding data from 2005 through 2013. We also reviewed the President’s 2015 budget proposal for FAA and obtained updated information about 1 GAO, Airport Finance: Observations on Planned Airport Development Costs and Funding Levels and the Administration’s Proposed Changes in the Airport Improvement Program, GAO-07-885 (Washington DC: June 2007). Page 1 GAO-14-658T
FAA program activities based on public sources. In addition, we have
             ongoing work examining airports’ funding and planned development,
             alternative PFC collection methods, and FAA’s airport privatization pilot
             program, on which we plan to issue reports later this year.

             The work on which this statement is based was conducted in accordance
             with generally accepted government auditing standards. Those standards
             require that we plan and perform the audit to obtain sufficient, appropriate
             evidence to provide a reasonable basis for our findings and conclusions
             based on our objectives. We believe that the evidence obtained provides
             a reasonable basis for our findings and conclusions based on our audit
             objectives.

             The United States has the largest, most extensive aviation system in the
Background   world with over 19,000 airports ranging from large commercial
             transportation centers transporting millions of passengers annually to
             small grass airstrips serving only a few aircraft each year. Of these,
             nearly 3,400 airports are designated as part of the national airport system
             and thus are eligible for federal assistance. The national airport system
             consists of two primary types of airports—commercial service airports,
             which have scheduled service and board 2,500 or more passengers per
             year, and general aviation airports, which have no scheduled service and
             board fewer than 2,500 passengers. FAA divides commercial service
             airports into primary airports (boarding more than 10,000 passengers
             annually) and commercial service nonprimary airports. The 389 primary
             airports are arranged into various types of hub airports—large, medium,
             and small hub, and nonhub—based on passenger traffic (see fig. 1). 2
             Passenger traffic is highly concentrated: 88 percent of all passengers in
             the United States boarded at the 62 large or medium hub airports in
             2012. 3

             2
              49 U.S.C. § 40102 (29), (31), (42).
             3
              The division of airports into categories is based on the previous year’s boardings at that
             airport as a percentage of the total number of boardings in the United States.

             Page 2                                                                          GAO-14-658T
Figure 1: Commercial Airport Categories Based on 2012 Boardings of U.S. Passengers
Note: The term “hub” is defined in federal law to identify primary commercial service airports as
measured by passenger boardings. These airports are grouped into four categories—large, medium,
and small hubs and nonhub. (49 U.S.C. § 40102).
More than 2,500 airports in the national airport system are designated as
“general aviation” (GA) airports. These airports range from large business
aviation and cargo-shipment centers that handle thousands of operations
a year to small rural airports with fewer operations per year but which
provide vital access to the national transportation system for their
communities.
Since 1946, the federal government has sponsored a grant program to
fund airport development. Today, those monies come from Airport
Improvement Program (AIP) grants. AIP is supported by the Airport and
Airway Trust Fund (trust fund), which is funded in part by airline ticket
taxes and fees. 4 General aviation flights also contribute to the trust fund
through a tax on noncommercial jet fuel. Airports in the national airport
system may receive AIP entitlement grants based on the number of
passengers and amount of cargo carried and may also compete for AIP
4
In total, the trust fund collected $12.8 billion from various taxes in fiscal year 2013. The
manner in which the trust fund is funded has not changed significantly since it was
established in 1970, although attempts have been made, unsuccessfully, to implement a
user fee system.
Page 3 GAO-14-658Tdiscretionary grants. FAA selects grantees for discretionary grants
according to national priorities and objectives. 5 AIP grants can only be
used for eligible projects, generally those that enhance capacity, safety,
or environmental concerns, such as runway construction and
rehabilitation, airfield lighting, and airplane noise mitigation. AIP
appropriations totaled $3.35 billion in fiscal year 2013. The grants require
a local match ranging from 5 to 25 percent, depending on the size of the
airport and type of project.
FAA’s tool for identifying future airport capital projects that are eligible for
AIP grants is the National Plan of Integrated Airport Systems (NPIAS).
FAA relies on airports, through their planning process, to identify
individual projects for funding consideration. Federal law 6 and FAA’s rules
establish which types of airport development projects are eligible for AIP
funding. Generally, most types of airfield improvements, such as runways,
lighting, navigational aids, and land acquisition are eligible, while hangars
and interest expense on airport debt are not. AIP-eligible projects for
airport areas serving travelers and the general public—called “landside
development”—include entrance roadways, pedestrian walkways and
movers, and space within terminal buildings, such as waiting areas that
do not produce revenue and is used by the public. AIP-ineligible landside
development projects include revenue-producing terminal areas, such as
ticket counters and concessions, parking lots, and interest on construction
bonds. Because the estimated cost of eligible airport projects greatly
exceeds the available grant funding, FAA uses a priority system based on
the type of airport and type of project to ration the available funds. The
Airports Council International—North America (ACI-NA), a trade
association for airports, also estimates future airport capital projects by
surveying its airport members in the U.S.
PFCs, a federally authorized source of funding for airport development
projects, are an airport-imposed fee of up to a maximum of $4.50 per
boarded passenger per flight segment. A passenger may be charged no
more than two PFCs on a one-way trip or four PFCs on a round trip (with
a maximum charge of $18). The fee is collected by the airline on the
passenger ticket and remitted to the airports (minus a small administrative
fee retained by the airline). PFC collections can be used for the same
5
General aviation airports receive a maximum entitlement of $150,000.
6
49 U.S.C. § 47102 (3).
Page 4 GAO-14-658Ttypes of projects as AIP grants, but are also allowed to pay interest costs on debt issued for those projects. The $4.50 maximum PFC was last increased in 2000. Collections totaled $2.8 billion in calendar year 2013. According to FAA, 388 commercial service airports were approved to collect PFCs as of April 2014. Airports also fund development projects from revenues generated directly by the airport. Airports generate revenues from aviation activities such as aircraft landing fees and terminal rentals, and non-aviation activities such as concessions, parking, and land leases. Aviation revenues are a traditional method for funding airport development; however, because Department of Transportation (DOT) regulations generally limit aviation charges to the recovery of historical airport costs—rather than replacement costs—they may not fully fund new investment. Generally, the level of aviation activity—whether commercial passenger and cargo or general aviation business and private aircraft—drives airport development and the monies that finance it. While only three new major airports have been built in the United States over the last three decades, 7 billions of dollars have been invested in building new capacity and maintaining and upgrading existing airport infrastructure during that time. In addition, according to the most recent FAA forecast, air traffic demand is projected to increase 2.7 percent per year from 2014 through 2034. Funding for both AIP and PFCs is linked to passenger activity. In this way, Congress aims to direct funds to where they are needed most. Similarly, airport-generated revenues are also tied to aviation activity and the number of passengers who use airport-related services. These revenues are typically used to finance the issuance of local debt such as tax-exempt bonds, which for larger commercial airports constitutes more than half of their funding. Because of the size and duration of airport development—for example, planning, funding and building a new runway can take more than a decade and several hundred million dollars to complete—long-term debt is used to help finance these types of projects. While almost all airport sponsors in the United States are states, municipalities, or public authorities, there is a significant reliance on the private sector for finance, expertise, and control of airport assets. For 7 Denver International Airport in Denver, CO; Northwest Arkansas Regional Airport in Bentonville, AR; and Austin-Bergstrom International Airport in Austin, TX. Page 5 GAO-14-658T
example, the majority of airport employees are employed by private
                       sector entities, such as vendors and baggage handlers, and private
                       companies also own and operate some airports. Under congressional
                       authorization, since 1996, FAA has piloted an airport privatization
                       program that relaxes certain restrictions on the sale or lease of airports to
                       private entities.

                       Since 2007, economic pressures—including record-high fuel prices and
Aviation Activity at   the recession of 2007 through 2009—helped spark a wave of
Airports Has Slowed    consolidation across the airline industry. For instance, Delta acquired
                       Northwest in 2008, United and Continental merged in 2010, Southwest
or Declined Since      acquired AirTran in 2011, and US Airways and American Airlines received
2007                   U.S. District Court approval for their proposed merger in April 2014.

                       As part of this restructuring and a more general focus on capacity
                       decisions, U.S. airlines have reduced the number of flights they offer
                       passengers in certain markets. We found in June 2014, based on our
                       analysis of DOT data, that there were 1.2 million fewer scheduled
                       domestic flights at large, medium, and small hub, and nonhub airports in
                       2013 than during 2007. 8 The greatest reduction in scheduled flights
                       occurred at medium hub airports, 9 which decreased nearly 24 percent
                       from 2007 through 2013, compared to a decrease of about 9 percent at
                       large hub airports and about 20 percent at small hub airports over the
                       same time period. Medium hub airports also experienced the greatest
                       percentage reduction in air service as measured by available seats (see
                       fig. 2). 10

                       8
                        GAO, Airline Competition: The Average Number of Competitors in Markets Serving the
                       Majority of Passengers Has Changed Little in Recent Years, but Stakeholders Voice
                       Concerns about Competition, GAO-14-515, (Washington, D.C.: June 11, 2014).
                       9
                        The declines at medium hub airports can be partly attributed to closing hubs following
                       recent airline mergers. For example, Memphis, Cleveland, and Cincinnati airports, all
                       experienced significant loss of traffic after a merger.
                       10
                            GAO-14-515.

                       Page 6                                                                        GAO-14-658T
Figure 2: Percentage Change in Number of Flights and Available Seats by Commercial Airport Category, 2007–2013 However, because airlines are now better able to match capacity to demand, planes are fuller than they have ever been. As a result, passenger boardings did not fall as much as either the number of flights or available seats. According to our analysis of DOT’s data from 2007 through 2012, 11 passenger boardings decreased approximately 17 percent at medium hub airports and about 2 percent at large hub airports, but increased more than 4 percent and about 3 percent at small hub and nonhub airports, respectively. 12 In addition, this April, we testified before this Committee that air service to small communities has declined since 2007 due, in part, to higher fuel costs, airline consolidation, and reduced demand both from declining populations in those communities and as a result of some passengers’ opting to drive to larger markets with more attractive service (i.e., larger airports in larger cities). 13 A 2013 Massachusetts Institute of Technology (MIT) study of domestic air service trends reported similar results and 11 Currently, 2013 boarding data are not yet available. 12 FAA forecasts that total passenger boardings will have fully recovered by 2015, exceeding the previous peak in 2007 of 765.3 million boardings. 13 GAO, Commercial Aviation: Status of Air Service to Small Communities and the Federal Programs Involved, GAO-14-454T (Washington, D.C.: Apr. 30, 2014). Page 7 GAO-14-658T
found that the prolonged economic downturn, high fuel prices, and
capacity restraint contributed to a reduction in service. 14 The study also
concluded that airlines have been cutting back on capacity to medium
hub and small hub airports far more than at the nation’s large hub
airports.

A significant decline in general aviation activity affects airports, especially
those that rely on general aviation for revenue. For GA airports—which
generate revenues from landing fees, fuel sales, and hangar rents—the
loss of traffic can have a significant effect on their ability to fund
development. A 2012 MIT study 15 that examined historical trends for GA
operations at towered airports across the country indicates that annual
operations have fluctuated since the late 1970s but that total GA
operations dropped 35 percent from 2000 to 2010. According to the MIT
study, the number of annual hours flown by GA pilots, as estimated by
FAA, has also decreased during this period. 16 Numerous factors affect the
level of GA operations and include high fuel prices, the costs of owning
and operating personal aircraft, and the total private pilot and GA aircraft
populations. We recently found that the supply of future GA pilots is
changing as fewer students enter and complete collegiate pilot-training
programs and fewer military pilots are available than in the past. 17

14
   Michael D. Wittman and William S. Swelbar, Trends and Market Forces Shaping Small
Community Air Service in the United States, Massachusetts Institute of Technology
International Center for Air Transportation (May 2013).
15
  Kamala I. Shetty and R. John Hansman, Current and Historical Trends in General
Aviation in the United States, Massachusetts Institute of Technology International Center
for Air Transportation (Aug. 2012).
16
   Unlike commercial service aviation, GA operators are not required to report flight activity
to FAA. FAA estimates GA flight hours on the basis of estimates derived from its annual
survey of GA operators—the General Aviation and Part 135 Activity Survey. We found in
2012 that the survey has long suffered from methodological and conceptual limitations,
even with FAA’s efforts to improve it over the years. See: GAO, General Aviation Safety:
Additional FAA Efforts Could Help Identify and Mitigate Safety Risks, GAO-13-36
(Washington, D.C.: Oct. 4, 2012).
17
 GAO, Aviation Workforce: Current and Future Availability of Airline Pilots, GAO-14-232
(Washington, D.C.: Feb. 28, 2014).

Page 8                                                                           GAO-14-658T
FAA estimates that the annual costs of planned airport development
Airports’ Planned   projects that are eligible for AIP grants will average about $8.5 billion
Development Costs   (2011 dollars) from fiscal years 2013 to 2017. 18 In 2012, FAA estimated
                    $42.5 billion (2011 dollars) in total 5-year costs of eligible development for
Have Declined       fiscal years 2013–2017. This figure was down 18 percent from the
                    estimated $52.3 billion (2009 dollars) costs for fiscal years 2011—2015 or
                    $10.5 billion annually. 19 FAA attributed the decline to several factors,
                    including airport sponsors choosing to defer projects due to reductions in
                    aviation activity, having identified other funding sources for projects, and
                    projects’ having been completed. In developing the estimate, FAA
                    reviewed approximately 23,000 existing projects at the five categories of
                    commercial airports, GA airports, reliever airports, 20 and new airports and
                    adjusted, deferred, or removed from consideration approximately 3,700
                    projects (16 percent). FAA estimated that eligible development costs for
                    all airport categories decreased between the two time periods, with the
                    largest nominal decreases for large hubs ($2.7 billion, a 15 percent
                    decrease) and medium hubs ($2.3 billion, a 31 percent decrease) (see
                    fig. 3).

                    18
                       AIP projects are also eligible for PFC funds, but some PFC uses (such as debt service)
                    cannot be funded with AIP.
                    19
                       We did not adjust FAA’s estimates to a common dollar year. Doing so would result in a
                    larger percent decrease from the 2011-2015 estimate to the 2013-2017 estimate than the
                    difference between the unadjusted estimates.
                    20
                      Reliever airports are airports designated by the Secretary of Transportation to relieve
                    congestion at commercial service airports and to provide improved general aviation
                    access to the overall community. 49 U.S.C. § 47102 (23). These airports may be publicly
                    or privately-owned.

                    Page 9                                                                        GAO-14-658T
Figure 3: FAA’s Estimates of AIP-Eligible Planned Development Costs by Airport Category, Fiscal Years 2011–2015 and Fiscal Years 2013–2017 Note: 2010 dollars for fiscal years 2011–2015 costs and 2012 dollars for fiscal years 2013–2015 costs. Based on FAA’s estimates, the largest category of eligible planned development is to bring existing airports up to current design standards (28 percent), followed by reconstruction (replacement or rehabilitation of airport facilities, mostly pavement and lighting systems) (25 percent), and increasing airfield capacity (23 percent). Compared to fiscal years 2011– 2015, FAA’s estimates of planned development for fiscal years 2013– 2017 decreased across every development category except capacity, which saw a slight increase of 2.5 percent (see fig. 4). While large hubs were the only airport category that experienced an increase in the cost of planned capacity projects (from about $6.8 billion to about $8.1 billion, a 19 percent increase), this increase was greater than the corresponding decrease for all other airport categories (from about $2.7 billion to about $1.7 billion, a 37 percent decrease). FAA is currently compiling the Page 10 GAO-14-658T
estimated planned development costs for the fiscal years 2015–2019
period, due to be published in fall 2014.

Figure 4: FAA’s Estimates of AIP-Eligible Planned Development Costs by Project
Category, Fiscal Years 2011–2015 and Fiscal Years 2013–2017

Note: 2010 dollars for fiscal years 2011–2015 costs and 2012 dollars for fiscal years 2013–2015
costs.

ACI-NA also estimated airports’ costs of planned development for the
fiscal years 2013–2017 period for projects eligible for federal funding as
well as those not eligible. The total estimated costs of planned
development for fiscal years 2013–2017 are $68.2 billion (2012 dollars) or
approximately $13.6 billion per year on average. 21 This is about a 10

21
 According to ACI-NA, the $68.2 billion estimate if adjusted for inflation would be $71.3
billion. Because FAA estimates are not inflation adjusted, we present ACI-NA estimates in
a similar context.

Page 11                                                                               GAO-14-658T
percent decline from ACI-NA’s prior estimate of $75.6 billion (2010
dollars) for the prior fiscal years 2011–2015 estimating period. 22 ACI-NA
attributed the decline to several factors, including the recent recession
and challenging economic conditions, airline consolidation and capacity
reductions, and projects’ having been completed or postponed beyond
2017. ACI-NA’s estimates of eligible development decreased between the
two time periods for all airport categories except medium hubs, which saw
a 5 percent increase. The largest decreases were for large hubs ($2.3
billion, a 6 percent decrease) and small hubs ($2.1 billion, a 27 percent
decrease).

ACI-NA’s estimate of airport planned development costs is considerably
larger than FAA’s because it is based on a broader base of projects and
other factors. For example, ACI-NA’s estimate includes projects that are
not eligible for AIP grants, while FAA’s estimate includes only AIP-eligible
projects 23 (see table 1). ACI’s estimate of the annual cost of planned
airport development for the 2013—2017 period that is not eligible for AIP
grants is $4.6 billion (2012 dollars). We combined this with FAA’s
estimate of the annual cost of planned airport development that is AIP-
eligible for the same time period—$8.5 billion—to estimate that the total
annual costs for airports’ planned development is $13.1 billion. When
comparing just the AIP-eligible portions of the respective estimates, ACI-
NA’s estimate is 6 percent greater than FAA’s ($2.6 billion in total or $0.5
billion annually).

22
  We did not adjust ACI-NA’s estimates to a common dollar year. Doing so would result in
a larger percent decrease from the fiscal years 2011-2015 estimate to the fiscal years
2013-2017 estimate than the difference between the unadjusted estimates.
23
  In addition, there are other differences in the way FAA and ACI-NA estimate airport
planned development costs. First, while FAA’s estimates cover projects for every airport in
the national system, ACI-NA surveyed its member airports in the U.S. (117 of which
responded, consisting mostly of large, medium, and small hub airports) and then
extrapolates a total based on cost-per-boarding calculations for large, medium, and small
hub airports that did not respond. Second, FAA data are based on planned project
information taken from airport master plans and state system plans, minus projects that
already have an identified funding source, while ACI-NA includes all projects, whether
funding has been identified or not. Third, FAA data includes only the portion of a project
that is eligible for AIP, while ACI-NA estimates the total value project cost. Fourth, ACI-NA
and FAA estimated planned development costs for the same 5-year time period, but the
estimates were made at different times—the ACI-NA survey was completed in 2012, while
FAA’s estimate is based on information available through 2011. Lastly, FAA’s estimates
use 2011 dollars, whereas ACI-NA’s estimates use 2012 dollars.

Page 12                                                                         GAO-14-658T
Table 1: Comparison of FAA’s and Airports Council International-North America’s
                      Estimates of Airport Planned Development Costs

                                                                             Estimated costs, fiscal years 2013—2017
                                                                                                 FAA                ACI-NA
                                                              Number of                (2011 dollars          (2012 dollars
                          Airport type                          airports                 in millions)           in millions)
                          Large hub                                     29                   $14,941                $35,449
                          Medium hub                                    36                      5,055                    8,869
                          Small hub                                     74                      3,589                    5,525
                                                                                                                                a
                          Nonhub                                      239                       4,906                   4,906
                                                                                                                                a
                          Commercial Service                          121                         670                    670
                          Nonprimary
                                                                                                                                a
                          General aviation                          2,563                       9,777                   9,777
                                                                                                                                a
                          Reliever                                    268                       2,996                   2,996
                          New airports                                  25                        610                           -
                          Total                                     3,355                    $42,545                $68,192
                      Source: FAA and ACI-NA.
                      a
                          ACI-NA’s estimates for these categories of airports are drawn directly from FAA’s estimate.

Federal Support for
Airport Development
Declined, While
Alternative Revenue
Sources at Airports
Have Grown

                      Page 13                                                                                   GAO-14-658T
Federal Support for Airport Regarding AIP grants, annual appropriations decreased from about $3.5
Development Has billion for fiscal years 2007 through 2011 to about $3.4 billion for fiscal
years 2012 through 2014. 24 In addition, the actual amount of AIP grants
Declined
awarded annually has decreased 9.6 percent since 2007 from $3.3 billion
in fiscal year 2007 to $3 billion in fiscal year 2013. Excluding grants to GA
airports, AIP grants on a per-passenger basis have also decreased, from
$3.80 per passenger in 2007 to $3.40 per passenger in 2012. Since then
Congress transferred $253 million in unobligated funds from AIP to FAA
operations to reduce furloughs for air traffic controllers in legislation
passed in March 2014. 25 Airport association representatives told us that
these funds had been reserved for airport development.
The President’s 2015 Budget calls for a reduction in AIP appropriations to
$2.9 billion. The Wendell H. Ford Aviation Investment and Reform Act for
the 21st Century of 2000 legislates that if AIP appropriations fall below
$3.2 billion and that provision is not changed, AIP entitlement grants will
be reduced by half; the funds from the entitlement grant reductions would
instead flow to AIP discretionary grants 26 giving FAA greater decision-
making over which airport projects receive funding.
With regard to PFCs, the federal PFC cap of $4.50 has not increased
since 2000 and thus has not kept pace with inflation. According to FAA
data, PFCs collections peaked in 2006 at $2.93 billion and then fell during
the recession before rebounding to $2.81 billion in 2013. According to
FAA, as of (April 2014, 388 commercial service airports (including of the
largest 100 airports by passenger boardings) imposed a PFC. According
to FAA, more than 90 percent of PFC collections go to large and medium
hub airports, but large and medium hub airports collecting PFCs must
24
For fiscal year 2009, in addition to the base appropriation of $3.5 billion, AIP received a
supplemental appropriation of $1.1 billion under the American Recovery and
Reinvestment Act of 2009 (Pub. L. No. 111-5 123 Stat. 115, 205) for a total appropriated
amount of $4.6 billion. The appropriated amount for each fiscal year includes amounts for
AIP grants to airports as well as for other components of the AIP program. For example, of
the $3.5 billion appropriated for the AIP program in fiscal year 2010, $3.4 billion was for
AIP grants, $93.4 million was for administrative expenses of the FAA’s Office of Airports,
$22.5 million was for the Airport Technology Research Program, $15 million was for the
Airport Cooperative Research Program, and $6 million was for the Small Community Air
Service Development Program.
25
Pub. L. No. 113-9, § 2, 127 Stat. 443 (2013).
26
49 U.S.C. § 47114.
Page 14 GAO-14-658Treturn a portion of their AIP entitlement grants, which are then redistributed to smaller airports. 27 In addition, we have found that many airports’ future PFC collections are already committed to pay off debt for past projects, leaving them little future PFC collections for new development. For example, at least 50 airports have leveraged their PFCs through 2030 or later, according to FAA data. The President’s 2015 Budget and airports have requested an increase in the PFC cap to $8—which they say takes into account inflation that has occurred since 2000 and eliminating AIP entitlements for large hub airports. 28 Airlines have generally opposed any increase in ticket taxes or fees, including PFCs, arguing that if an increase in taxes or fees is passed onto the consumers through an increase in ticket prices, it could reduce demand for air travel. For example, in December 2013, Congress approved allowing the Transportation Security Administration to raise the security fee currently applied to each ticket from $2.50 to $5.60 and to eliminate the cap on the number of fees that can be collected on a flight itinerary. Airlines opposed that increase based on concerns that it would hurt travel demand. We concluded in 2012 that a $3.00 increase in the security fee to $5.50 would reduce passenger boardings by about 1 percent based on a review of passenger demand literature. 29 We are currently assessing the impact of increases in the amount of the PFC on passenger demand, airport investment, and aviation users and plan to report our findings later this year. While airports have primarily supported the current collection method, some told us they might consider using an alternative method if it allowed them to remove the PFC cap. In 2013, we examined alternative collection mechanisms, such as airport kiosks and internet-enabled devices such as 27 Medium and large hub airports return 50 percent of their AIP entitlement funds if their PFC level is $3.00 or less and 75 percent of their entitlement if their PFC level is above $3.00 (49 U.S.C. § 47114(f)). FAA’s Small Airport fund—for use by small hubs, nonhubs, general aviation, and reliever airports—receives 87.5 percent of the total returned amount, and the other 12.5 percent goes toward AIP discretionary funds (49 U.S.C § 47116). 28 Airport trade associations ACI-NA and the American Association of Airport Executives have made prior proposals to raise the PFC cap to $8.50 with periodic adjustments for inflation. 29 GAO, 2012 Annual Report: Opportunities to Reduce Duplication, Overlap, and Fragmentation, Achieve Savings and Enhance Revenue, GAO-12-342SP (Washington, D.C.: Feb. 28, 2012). Page 15 GAO-14-658T
smartphones that could be used to collect PFCs separately from the
ticket. We found that none of these alternatives was better than the
current method. Specifically, we determined that each of the alternatives
negatively affected the passenger experience and the transparency of
fees relative to the current method. 30

Although support for airport development from AIP and PFCs has
declined in recent years, so have planned development costs. In addition,
we have not yet determined how much funding has recently been
generated by the other major source of revenues for airport
development—municipal bond proceeds, backed primarily by airport
revenues. Therefore, the extent to which the gap between airport funding
and planned airport development costs has changed since we last
reported on this in 2007 is unknown. As discussed above, for the 2013
through 2017 period, the total estimated annual costs for airports’ planned
development projects is about $13.1 billion, $8.5 billion of which is eligible
for AIP grants and PFCs. However, annually only about $6 billion in
support has been available from AIP grants and PFC collections. The
remaining $7 billion in annual planned development will need to be
funded by locally generated revenues or deferred. In 1998, 2003, and
2007, we found a funding gap between the 5-year airport planned
development costs and historical funding. In 2007, the total gap was $1
billion annually. This gap has been most acute for smaller airports that
may have less access to capital markets. 31 We are currently assessing
whether this gap has grown or declined in light of declining federal
funding and planned development and will report our findings to this
Committee later this year.

30
 GAO, Alternative Methods for Collecting Airport Passenger Facility Charges,
GAO-13-262R (Washington, D.C.: Feb. 14, 2013).
31
 GAO, Airport Finance: Observations on Planned Airport Development Costs and
Funding Levels and the Administration’s Proposed Changes in the AIP, GAO-07-885
(Washington, D.C.: June 29, 2007); Airport Finance: Past Funding Levels May Not Be
Sufficient to Cover Airports’ Planned Capital Development, GAO-03-497T (Washington,
D.C.: Feb. 25, 2003); and Airport Financing: Funding Sources for Airport Development,
GAO/RCED-98-71 (Washington, D.C.: Mar. 12, 1998).

Page 16                                                                    GAO-14-658T
Alternative Revenue                       To help fund airport development, some commercial service airports have
Sources at Airports Have                  increasingly relied on non-aviation revenues. According to ACI-NA, non-
                                          aviation revenue has grown, on average, over 4 percent each year since
Grown
                                          2004, compared to a 1.5 percent increase in passenger boardings over
                                          the same period. In 2012, according to FAA data, non-aviation revenue
                                          accounted for approximately 45 percent of airports’ total operating
                                          revenues. Parking and ground transportation accounted for the greatest
                                          portion (41 percent) of passenger-related non-aviation revenue, followed
                                          by terminal concessions (20 percent) and revenue from rental car
                                          facilities (20 percent) (see fig. 5). 32

Figure 5: Total Revenue and Non-Aviation Revenue for All Airports (2012, Dollars in Millions)

                                          Notes: 2012 is the latest full fiscal-year data available in FAA’s CATS database.
                                          Terminal Concessions include Retail & Duty Free, Food & Beverage and Terminal Services.

                                          In addition to traditional commercial activities to generate non-aviation
                                          revenue, some airports have developed unique commercial activities with
                                          stakeholders from local jurisdictions and the private sector to help

                                          32
                                           Airports Council International—North America, 2013 (FY12) Benchmarking Survey, ACI-
                                          NA (Washington, D.C.: Oct. 17, 2013).

                                          Page 17                                                                           GAO-14-658T
develop airport properties into retail, business, and leisure destinations. 33 An increasing range of unique developments on airport property have contributed to non-aviation revenues, including high-end commercial retail and leisure activities, hotels and business centers, medical facilities, and specialized cargo handling and refrigerated storage facilities, among other developments (see fig. 6). For example, Miami International Airport was named one of the world’s top-10 airports for retail shopping, and the $1.7 billion international terminal at Los Angeles International Airport, which is currently under construction, will contain 140,000 square feet of premier dining, retail, and club lounges. By acting more like businesses than public utilities, airports have increasingly become more competitive with one another, providing services, including hotels and conference space, to attract and retain business travelers who might otherwise stay in a downtown hotel off airport property. For example, Dallas/Fort Worth International Airport owns a Grand Hyatt hotel inside Terminal D, Denver International Airport is building an attached Westin Hotel, and Hartsfield- Jackson Atlanta International Airport is considering an airport hotel inside or connected to its domestic terminal. Also, in an effort to generate revenue by leasing cold storage space to freight forwarders and businesses that transport low-volume, high-valued goods, including pharmaceuticals, produce, and other time-sensitive or perishable items, airports in Denver, Miami, and Indianapolis have built—or plan to build— cold storage facilities on airport property. 33 Airport-centric development—development at and around airports, in part, to generate non-aviation revenue and stimulate regional development—has taken place at airports around the world. This form of development has also been referred to as aerotropolis or airport-city. For more information on factors that may support this form of development, see: GAO, National Airspace System: Airport-Centric Development, GAO-13-261 (Washington, D.C.: Mar. 28, 2013). Page 18 GAO-14-658T
Figure 6: Examples of Expanded Services Offered in Some Airport Terminals

                                       In addition, airports can fund airport improvements with private sector
                                       participation. Public-private partnerships, involving airports and
                                       developers, have been used to finance airport development projects
                                       without increasing the amount of debt already incurred by airports. FAA’s
                                       noise land disposal program, for example, allows airports to sell or lease
                                       land that had been used in the past for noise abatement purposes and is
                                       no longer needed for noise abatement. FAA also allows airports with
                                       excess available land to use the land for certain types of commercial
                                       development, pending approval by the FAA. 34 Airport operators must

                                       34
                                         FAA restricts certain types of land use on or near airport properties and also restricts
                                       lease or sale of airport-owned land. Such restrictions are established in grant assurances
                                       that airports accept as a condition of receiving federal land or funds. Airport operators
                                       must obtain FAA’s concurrence to lease airport land or facilities to developers if the
                                       operator has obtained grants from FAA. Local planning officials have also affected
                                       particular land uses near airports through planning policies related to noise, environmental
                                       quality (air, water, wetland, species protection), and zoning restrictions.

                                       Page 19                                                                        GAO-14-658T
obtain FAA’s concurrence prior to leasing airport land or facilities to private developers to help ensure, among other things, that the developer’s plans will be compatible with airport operations and that the airport receives fair market value for the use of its property. The ability to lease airport land has allowed some airport operators to generate revenue through temporary leases of airport property for manufacturing, warehousing, and freight-forwarding operations while also reserving the land for future aviation needs. For example, solar farms have been built on airport land in Indianapolis and Denver; officials at Dallas/Fort Worth International Airport have leased a portion of the airport property for oil extraction; and land at Alliance Airport near Ft. Worth, Texas, has been leased for agricultural uses, such as cattle grazing and a golf course (see fig. 7). In addition, Miami International Airport entered a $512 million public-private partnership to develop 33 acres of airport property. The developer will finance construction and pay rent and a percentage of the revenues to the airport in return for a 50-year lease. Page 20 GAO-14-658T
Figure 7: Examples of Development Efforts on Airport Property Outside of Terminals

                                        Privatization of airports is another option that some public sector airport
                                        owners have considered to obtain private capital for airport improvement
                                        and development, among other things. However, FAA’s Airport

                                        Page 21                                                          GAO-14-658T
Privatization Pilot Program (APPP), which was established in 1996 to reduce barriers to airport privatization has not led to many privatizations. 35 Only one airport—San Juan Luis Muñoz Marín International Airport in Puerto Rico –has been privatized, and currently there is only one active applicant in the program. 36 Nonetheless, airports are using the private sector to finance airport development or manage airports outside of the APPP. For example, the Port Authority of New York and New Jersey has recently received responses for its request for proposals for the private sector to demolish old terminal buildings and construct, partially finance, operate, and maintain a new Central Terminal Building for LaGuardia Airport in New York City in return for a share of terminal revenues. In addition, Gary/Chicago International Airport in Gary, Indiana, outside Chicago has entered into a public-private partnership with a private sector firm to both operate the airport and economically develop off-airport property. We are currently examining airport privatization and the APPP and plan to report our findings later this year. In conclusion, this year commemorates one century since the first commercial airline flight, 37 and in that relatively short time span, commercial aviation has grown at an amazing pace to become a ubiquitous and mature industry in the United States. While commercial aviation still has many exciting prospects for its second century, it also faces many challenges, chief among these are ensuring that airports can continue to accommodate millions of flights and hundreds of millions of passengers every year. Maintaining and upgrading this vital infrastructure will require the combined resources of federal, state, and local governments, as well as private companies’ capital and expertise. Effectively supporting this development involves focusing federal resources on the FAA’s key priorities of maintaining one of the world’s safest aviation system and providing adequate system capacity, while allowing maximum flexibility for local airport sponsors to maximize local 35 GAO, Airport Privatization: Issues Related to the Sale or Lease of U.S. Commercial Airports, GAO/RCED-97-3 (Washington, D.C.: Nov. 7, 1996). 36 Stewart Airport in New York was privatized in 1999 under a 99-year lease to a private sector operator, but in 2007, the Port Authority of New York and New Jersey assumed the lease after the private sector operator ceased to operate airports. 37 On January 1, 1914, the St. Petersburg-Tampa Airboat Line became the world’s first scheduled passenger airline service, operating between St. Petersburg and Tampa, Fla. It was a short-lived endeavor—only 3 months. Page 22 GAO-14-658T
investment and revenue opportunities. In deciding the best course for
                   future federal investment in our national airport system, key
                   considerations for Congress will be to balance the interests of all aviation
                   stakeholders, including airports, airlines, and most importantly
                   passengers and shippers, to help ensure a safe and vibrant aviation
                   system.

                   Chairman LoBiondo, Ranking Member Larsen, and Members of the
                   Subcommittee, this concludes my prepared statement. I would be
                   pleased to respond to any questions that you may have at this time.

                   For further information about this testimony, please contact Gerald L.
GAO Contacts and   Dillingham at (202) 512-2834 or dillinghamg@gao.gov. Contact points for
Staff              our Offices of Congressional Relations and Public Affairs may be found
                   on the last page of this statement. Key contributors to this testimony
Acknowledgments    include Paul Aussendorf (Assistant Director), Amy Abramowitz, Jessica
                   Bryant-Bertail, Jonathan Carver, Ben Emmel, John Healey, David
                   Goldstein, Greg Hanna, David Hooper, Delwen Jones, Jennifer Kamara,
                   Maureen Luna-Long, Faye Morrison, Eleni Orphanides, Justin Reed,
                   Melissa Swearingen, and Pamela Vines.

(540278)
                   Page 23                                                           GAO-14-658T
This is a work of the U.S. government and is not subject to copyright protection in the United States. The published product may be reproduced and distributed in its entirety without further permission from GAO. However, because this work may contain copyrighted images or other material, permission from the copyright holder may be necessary if you wish to reproduce this material separately.
The Government Accountability Office, the audit, evaluation, and
GAO’s Mission         investigative arm of Congress, exists to support Congress in meeting its
                      constitutional responsibilities and to help improve the performance and
                      accountability of the federal government for the American people. GAO
                      examines the use of public funds; evaluates federal programs and
                      policies; and provides analyses, recommendations, and other assistance
                      to help Congress make informed oversight, policy, and funding decisions.
                      GAO’s commitment to good government is reflected in its core values of
                      accountability, integrity, and reliability.

                      The fastest and easiest way to obtain copies of GAO documents at no
Obtaining Copies of   cost is through GAO’s website (http://www.gao.gov). Each weekday
GAO Reports and       afternoon, GAO posts on its website newly released reports, testimony,
                      and correspondence. To have GAO e-mail you a list of newly posted
Testimony             products, go to http://www.gao.gov and select “E-mail Updates.”

Order by Phone        The price of each GAO publication reflects GAO’s actual cost of
                      production and distribution and depends on the number of pages in the
                      publication and whether the publication is printed in color or black and
                      white. Pricing and ordering information is posted on GAO’s website,
                      http://www.gao.gov/ordering.htm.
                      Place orders by calling (202) 512-6000, toll free (866) 801-7077, or
                      TDD (202) 512-2537.
                      Orders may be paid for using American Express, Discover Card,
                      MasterCard, Visa, check, or money order. Call for additional information.
                      Connect with GAO on Facebook, Flickr, Twitter, and YouTube.
Connect with GAO      Subscribe to our RSS Feeds or E-mail Updates. Listen to our Podcasts.
                      Visit GAO on the web at www.gao.gov.
                      Contact:
To Report Fraud,
                      Website: http://www.gao.gov/fraudnet/fraudnet.htm
Waste, and Abuse in   E-mail: fraudnet@gao.gov
Federal Programs      Automated answering system: (800) 424-5454 or (202) 512-7470

                      Katherine Siggerud, Managing Director, siggerudk@gao.gov, (202) 512-
Congressional         4400, U.S. Government Accountability Office, 441 G Street NW, Room
Relations             7125, Washington, DC 20548

                      Chuck Young, Managing Director, youngc1@gao.gov, (202) 512-4800
Public Affairs        U.S. Government Accountability Office, 441 G Street NW, Room 7149
                      Washington, DC 20548

                        Please Print on Recycled Paper.
You can also read


