Analysis of Large-Scale Residential Development on Walking Environments in Surrounding Neighborhoods: A Before-and-After Comparison of Apartment ...
←
→
Page content transcription
If your browser does not render page correctly, please read the page content below
sustainability

Article
Analysis of Large-Scale Residential Development on
Walking Environments in Surrounding
Neighborhoods: A Before-and-After Comparison of
Apartment Complex Developments in Seoul, Korea
Omer Dogan, Jaewon Han and Sugie Lee *
 Department of Urban Planning and Engineering, Hanyang University, 222 Wangsimni-ro, Seongdong-gu,
 Seoul 04763, Korea; omerdogan1088@gmail.com (O.D.); tommorello@hanmail.net (J.H.)
 * Correspondence: sugielee@hanyang.ac.kr

 Received: 18 July 2020; Accepted: 2 September 2020; Published: 7 September 2020

 Abstract: Pedestrian mobility is an indicator of urban sustainability insofar as it affects walkability
 and social cohesion. This research focused on the relationship between large-scale residential
 development and the walking environments of surrounding neighborhoods in Seoul, Korea.
 Large-scale residential developments, such as apartment complexes, might disrupt pedestrian
 walking networks fully or partly, causing the separation of urban spaces and social disconnection.
 This paper conducted before-and-after analysis of apartment complex development on the walking
 environments of surrounding neighborhoods using the Urban Network Analysis (UNA) tool and
 Rhinoceros three-dimensional (3D) software. With UNA measures such as reach, gravity, straightness,
 and betweenness, this study examined three apartment complexes constructed between 2010 and
 2017 in Seoul. Analysis results indicated that large-scale residential development in existing urban
 environments is likely to hinder walking environments in surrounding neighborhoods. This study
 suggests policy implications to improve walking environments in surrounding communities when
 large-scale apartment complexes are developed in existing urban environments.

 Keywords: apartment complex; gated community; urban network analysis; walkability

1. Introduction

Research Background and Objectives
      Streets have always been regarded as critical components of the built environment for urban
vitality [1]. Even though the physical appearance of streets has evolved throughout history, streets
have always been a medium for the circulation of people and goods. Because of this critical role in
sustaining urban life, modern urbanists have compared streets to blood vessels in the metaphorical
anatomy of cities [2]. Extending the metaphor, a city loses its vitality if the circulative role of urban
streets does not work efficiently.
      A variety of factors impact people’s walking activities. The most crucial factors are spatial
characteristics, such as urban form and street networks. Urban physical form has strong influences on
the daily walking activities of residents.
      Since the beginning of the second half of the last century, rapid urbanization has made apartment
complex redevelopment one of the best solutions for housing shortages all over the world [3]. Urban
planners such as Le Corbusier offered the first conceptual ideas of apartment-style redevelopments in
the classic example of Radiant City in the 1930s [4,5].

Sustainability 2020, 12, 7335; doi:10.3390/su12187335                     www.mdpi.com/journal/sustainability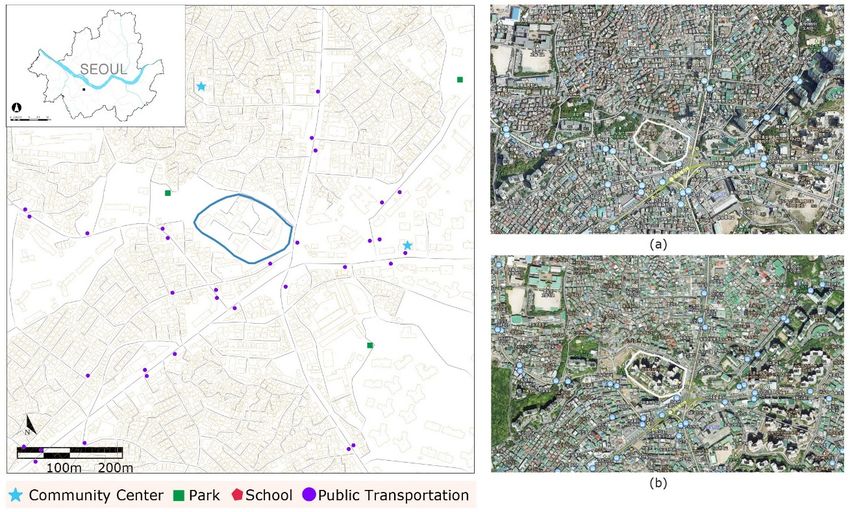
Sustainability 2020, 12, 7335                                                                        2 of 17

     The types and features of apartment complexes have evolved over time, and the characteristics of
apartment complexes vary in different countries. In the late 1950s, large-scale apartment complexes
started to appear alongside the traditional non-gated neighborhoods in Seoul [6].
     According to the Korean Population and Housing Census [7], apartments account for more than
half of total housing in South Korea. Large-scale urban development and redevelopment projects
are most likely to transform existing urban physical environments. The development of large-scale
apartment complexes, highway construction, and other types of large-scale urban development projects
inevitably affect proximate walking environments, as well as the sense of community for residents [8].
In particular, trends in the development of gated communities, such as enclosed apartment complexes,
may have substantial effects on the walking environments of surrounding areas and the formation of
community consciousness in neighborhoods.
     The effects of gated community-style apartments on society have been widely discussed [9,10].
The work of Lynch [11] emphasizes the importance of continuity in street networks as channels for
possible movement. However, little research has been conducted to examine the walking environments
of surrounding communities in terms of micro-scale analysis. Large-scale apartment complexes may
yield unexpected physical barriers to walkability in surrounding neighborhoods.
     Therefore, this study examines the relationships between large-scale apartment complexes and the
walkability of surrounding neighborhoods in existing urban fabrics, and suggests policy implications
to improve urban walkability. This study utilizes urban network analysis (UNA) and Rhinoceros 3D
software to conduct micro-scale urban network analysis before and after the development of apartment
complexes in three case study areas.

2. Literature Review

Built Environment and Accessibility
      Simply defined, walking is the act of getting from one point to another by foot. Walking
enables people to have both social and spatial interactions [12]. These interactions help to build
livable communities by increasing a sense of togetherness among people within common spatial
parameters [13,14].
      Numerous studies have classified walking into two groups according to its purpose: walking
for transportation and walking for recreation [15–17]. The factor of distance has a different impact on
these two types of walking. Some studies suggest that increasing distance to a destination positively
affects walking for recreation in urban areas, and negatively affects walking in all other situations [15].
Walking is associated with an overall environment that includes physical, social, and cultural aspects
for pedestrians [18]. In walking for transportation, a shorter distance to a destination is one of the
critical factors in pedestrians’ route choice.
      The last several decades have seen the proliferation of enclosed apartment complexes in existing
urban fabrics. In most cases, apartment complexes are considered to be a type of gated community.
Grant [19] defines gated communities as “housing development(s) on private roads closed to general
traffic by a gate across the primary (point of) access ... The development sites may be surrounded by
fences, walls, or other natural barriers that further limit public access” (pp. 913–930).
      According to Grant’s definition, most apartment complex sites are in the category of “gated
communities”, even though apartment complexes are not enclosed by walls or controlled by guards.
The term “gated community” is used and understood differently by planners and researchers. A gated
community may refer to a settlement that is walled and truly gated—but sometimes the gate may
be only an ornamental element and actual walls do not even exist. Blakely and Snyder [3] classified
gated communities into three groups based on their characteristics: lifestyle, prestige, and security
zone features. The intentions behind the building of gated communities shape the gate form and the
enclosure type too. In some contexts, segregation by gated communities happens due to ethnicity,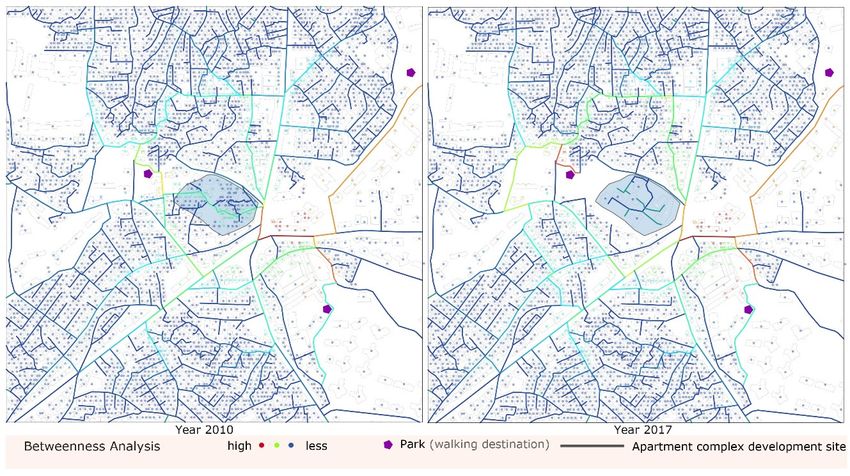
Sustainability 2020, 12, 7335 3 of 17
Sustainability 2020, 12, x FOR PEER REVIEW 3 of 17
religion, orreligion,
ethnicity, ideological issues. Forissues.
or ideological instance,
Formany residents
instance, manycluster
residents in gated
cluster communities in Indonesia,
in gated communities in
South Africa, and many cities in South America for reasons along these
Indonesia, South Africa, and many cities in South America for reasons along these lines [20,21]. lines [20,21].
Many cases
Many cases show
show thatthatresidents’
residents’desire
desiretotolive
liveininanan apartment
apartment complex
complex is usually
is usually triggered
triggered by
by socioeconomic issues [9,22]. In some countries, walls and gates provide
socioeconomic issues [9,22]. In some countries, walls and gates provide visual separation for residents visual separation for
residents
inside a inside
gated acommunity,
gated community, thereby thereby facilitating
facilitating perceptions
perceptions of ofa aprestigious
prestigiouslifestyle
lifestyle within
within
communities [23,24].
communities [23,24]. This
This is is seen
seen inin societies
societies where
where socio-economic
socio-economic segregation
segregation is is high.
high. So-called
So-called
“paradise sites” in
“paradise sites” inIstanbul
Istanbulare areanan example
example of this
of this type;type; in order
in order to create
to create a private
a private centralcentral area,
area, which
which can be converted
can be converted to a park toor
a apark
poolorfor a pool for exclusive
exclusive use by theuse by the community,
community, blocks areblocks
locatedare located
alongside
alongside the borders of the site, while the central area is left empty.
the borders of the site, while the central area is left empty. This morphological setting confirms This morphological settinga
confirms a statement in the work of Landman and Schönteich [25],
statement in the work of Landman and Schönteich [25], that isolated gated communities create that isolated gated communities
create inaccessible
inaccessible islandsislands
or bucketsor buckets
inside inside
the urbanthe urban
fabric andfabricin and
this in
waythisdisrupt
way disrupt the continuity
the continuity of the
of the urban fabric. In short, the intention behind the building of a gated
urban fabric. In short, the intention behind the building of a gated community determines its physical community determines its
physical form. Moreover, the physical form of a gated community
form. Moreover, the physical form of a gated community directly affects the surrounding walkingdirectly affects the surrounding
walking environment
environment for pedestrians.
for pedestrians. Figure 1Figure 1 demonstrates
demonstrates the development
the development of apartment
of apartment complexescomplexes
in the
in the traditional fine-grained urban fabric in Seoul, Korea. These apartment
traditional fine-grained urban fabric in Seoul, Korea. These apartment complexes may have some complexes may have some
negative impacts
negative impacts on on pedestrian
pedestrian walking
walking environments
environments in in the
thesurrounding
surroundingtraditional
traditionalneighborhoods.
neighborhoods.
(b)
(a) (c)
Figure
Figure 1.1. (a)
(a)Development
Development of of an apartment
an apartment complex
complex in Seoul.
in Seoul. (b) Newly
(b) Newly developed
developed apartment
apartment complex
complex and traditional fine-grained neighborhoods [26]. (c) Inside area of an apartment
and traditional fine-grained neighborhoods [26]. (c) Inside area of an apartment complex [24]. complex
[24].
The work of Ozdemir and Dogrusoy [27] studies enclosed gated communities in Turkey.
That The workemphasizes
research of Ozdemir the andabsence
Dogrusoy of a[27] studies enclosed
transitional gated communities
space hierarchy in Turkey.
between urban space That
and
research emphasizes
physical areas of gated thecommunities,
absence of a transitional
which prevents space thehierarchy
creation between urbanareas
of common spacethat
andare
physical
open
areas of gated
to shared communities,
interactions as partwhich
of the prevents the creation
city. Physical segregationof common areascommunities
due to gated that are opennegatively
to shared
interactions as partofofpublic
affects the quality the city. Physical
open spacessegregation due of
in the vicinity to gated
enclosedcommunities negatively
housing sites. affects the
This happens in
quality
part of public
because openbuilt
the new spaces in the vicinity
environment of enclosed
obstructs pedestrianhousing sites. This
accessibility andhappens
encouragesin part because
automobile
the new built[28].
accessibility environment obstructs pedestrian accessibility and encourages automobile accessibility
[28]. In her seminary book, The Death and Life of Great American Cities, Jacobs [1] suggests preconditions
In her
for urban seminary
vitality. Jacobsbook,
arguesThethatDeath
small and
blockLife of inGreat
sizes American
an urban contextCities, Jacobs
increase [1] suggests
alternative routes
preconditions for urban
that are most likely vitality.social
to increase Jacobs argues that
interaction smallurban
among block residents.
sizes in anInurban context
addition, increase
small block
alternative routes that
sizes yield shorter travelare mostfor
routes likely to increase
pedestrians. Thesocial
amount interaction
of walking among urban around
that occurs residents. In
gated
addition, small block sizes yield shorter travel routes for pedestrians. The
communities depends on many factors, which have been mentioned. Across studies [29,30], street amount of walking that
occurs
shape andaround
blockgated communities
size stand out as the depends
prevailingon many
factors.factors,
Here,which
Jacobs’shave
viewbeen mentioned.
is the Across
most prominent
studies
one. She[29,30],
suggests street
thatshape and
smaller block
city sizeimprove
blocks stand out as the prevailing
walkability, factors.
asserting, “MostHere,
blocksJacobs’s
must be view is
short;
the
thatmost prominent
is, streets one. She suggests
and opportunities to turnthat smaller
corners mustcitybeblocks improve
frequent” [1]. walkability, asserting, “Most
blocks must be short; that is, streets and opportunities to turn corners must be frequent” [1].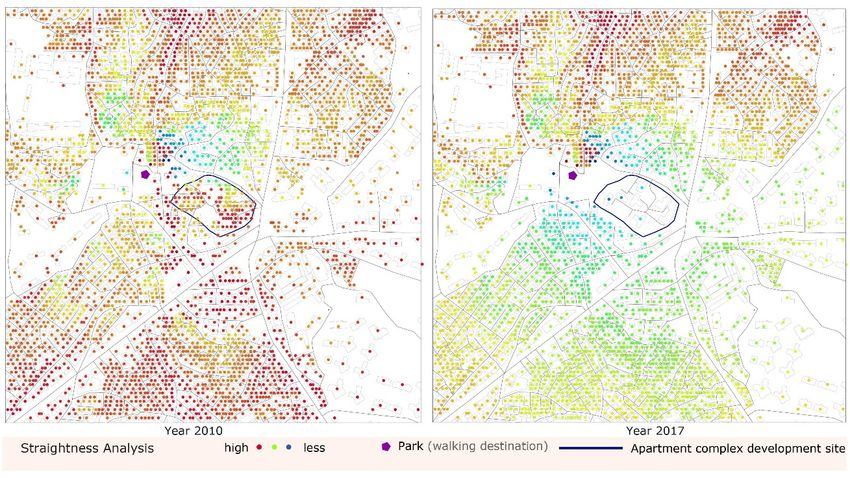
Sustainability 2020, 12, x7335
FOR PEER REVIEW 44of
of 17
As is seen in Figure 2, the coarse-grained morphology of apartment complexes contradicts with
As is seenofinJane
the concept Figure 2, the coarse-grained
Jacobs. Compared to morphology
the previousof apartment complexes
fine-grained contradicts
urban form, with the
through the
concept of Jane Jacobs. Compared to the previous fine-grained urban form, through
development of apartment complexes, the large shape of blocks is more disadvantageous forthe development
of apartment complexes, the large shape of blocks is more disadvantageous for movement.
movement.
Figure
Figure 2.
2. The
The pedestrian
pedestrian walking
walking environment
environment before-and-after
before-and-after apartment
apartment complex
complex development.
development.
Jacobs further
furtherargues
arguesthatthat border
border vacuums
vacuums are important
are important components
components of urbanof urban
vitality.vitality. She
She defines
defines border vacuums
border vacuums as the of
as the division division of communities
communities by large single-use
by large single-use territories orterritories
corridors. or According
corridors.
According to Jacobs,apartment
to Jacobs, large-scale large-scale apartment
complexes complexes
(so-called “gated (so-called “gatedcreate
communities”) communities”) create to
a physical barrier a
physical
pedestrian barrier to pedestrian
activities in the sameactivities
way thatin the same way
transportation that transportation
infrastructure infrastructure
such as roads and railroadssuch do.as
roadsOneandprevious
railroadsstudydo. examines how to decrease the negative effects of border vacuums caused by
One previous
landscape study examines
design proposals [31]. Using how to decrease
a case study of the negative
a subway effects
station of border
in Dubai, vacuumsindicates
the research caused
by
thatlandscape
planting and design proposals
vegetation ought[31].to Using a case study
be considered as good of tools
a subway station
to mitigate in Dubai,
negative the research
effects. Another
indicates
study by Apak that planting
[32] suggestsand vegetation
that graffitiought to be considered
and artwork as good to
are other solutions tools to mitigate
decrease bordernegative
vacuum
effects. Anotherthe
effects around study
walls byofApak [32] suggests
apartment complexes that by
graffiti
making andtheartwork
areas are
moreother solutions
walkable. Thatto decrease
research,
border
however, vacuum effectsexplores
specifically around the walls of apartment
a correlation betweencomplexes
the existence by making theon
of graffiti areas
themore
wallswalkable.
of gated
That research,and
communities however, specifically
segregation. explores
The study shows a correlation
that so-calledbetween
graffitithe existence
appears of graffiti
where on the
walkability is
walls
worse,ofand gatedthatcommunities
so-called “gang and segregation.
graffiti” is a Thesign study
of poor shows that in
security so-called
proximategraffiti appears
areas. Whilewhere
these
walkability
studies suggest is worse,
the useand of that
mature so-called
trees for“gang graffiti”
shading is a sign of
and blocking poor
dust security
or noise andintheproximate areas.
use of artwork
While these walkable
to promote studies suggest
streets,thetheuse of mature
research doestrees for shading
not consider and blocking
mobility issues for dust or noise and
pedestrians duetheto
use of vacuums.
border artwork to promote walkable streets, the research does not consider mobility issues for
pedestrians
Thus, much due to of border
the work vacuums.
to date on gated communities has focused on social segregation and some
Thus,
cosmetic much oftothe
strategies work to
improve date on
walking gated communities
environments has focused
for pedestrians. However,on social
theresegregation and
is little research
some cosmetic
to quantify the strategies to improve
impact of gated walkingon
communities environments for pedestrians.
walking accessibility However,
for pedestrians in there is little
surrounding
research
environments.to quantify the impact
In particular, of gated communities
before-and-after on walking
analysis of gated accessibility
communities stands to for pedestrians
show the specificin
surrounding
impact of gated environments. In particular, on
community development before-and-after
existing urbananalysis
areas. of gated communities stands to
show the specific impact of gated community development on existing urban areas.
3. Methodology
3. Methodology
3.1. Case Study Areas
3.1. Case
The Study Areas
purpose of this study was to analyze changes in walking environments due to the development
of apartment complexes
The purpose (ACs)
of this in urban
study was areas. To thischanges
to analyze end, we compared
in walking situations before and
environments dueafter the
to the
development of discrete apartment complexes by using data from the 2018 Seoul
development of apartment complexes (ACs) in urban areas. To this end, we compared situationsImprovement Project
Progress
before andreport. Since
after the 2000, 250 of
development areas haveapartment
discrete been designated
complexesas “improvement business
by using data from districts”,
the 2018 Seoul
of which 144 have been built. As of June 2018, 111 districts have been completed in
Improvement Project Progress report. Since 2000, 250 areas have been designated as “improvement Seoul.
Among
business the 250
districts”, of projects,
which 144we identified
have 30 areas
been built. in categories
As of June 2018, 111of new town,
districts redevelopment,
have been completed
and reconstruction
in Seoul. projects. For each of the projects, construction began after January 2011 and
was finished before December 2017. Using Daum’s road view technology, we investigated
Among the 250 projects, we identified 30 areas in categories of new town, redevelopment, features
and
reconstruction projects. For each of the projects, construction began after January 2011 and was
finished before December 2017. Using Daum’s road view technology, we investigated features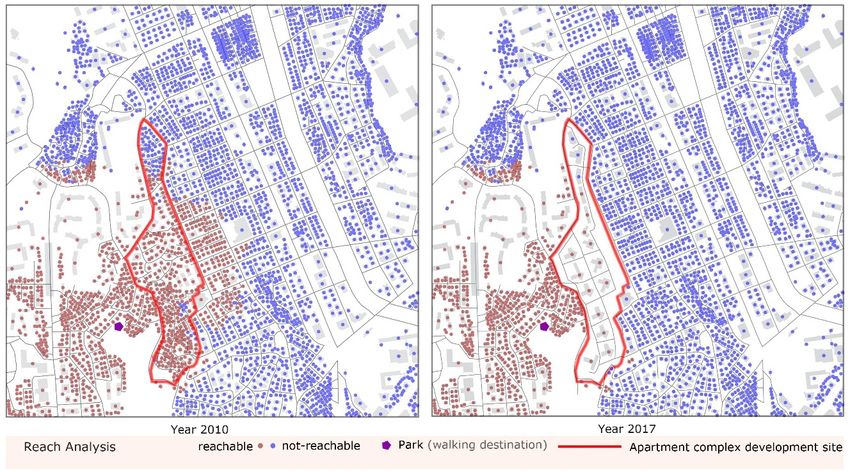
Sustainability 2020,
Sustainability 2020, 12,
12, xx FOR
FOR PEER REVIEW 555 of
of 17
17
Sustainability 2020, 12, 7335 PEER REVIEW of 17
including development
including development size,
size, street
street networks,
networks, enclosure
enclosure types,
types, and
and surrounding
surrounding neighborhoods.
neighborhoods.
Then, we
including focused
Then, we developmenton three representative
size, street
focused on three case
networks, case
representative study
enclosure areas
studytypes, from
areasand
from among the
surrounding most enclosedThen,
among theneighborhoods.
most enclosed sites
sites
(Figures
we 3–5).
focused
(Figures on three representative case study areas from among the most enclosed sites (Figures 3–5).
3–5).
Figure 3.
Figure
Figure 3. Bomun
Bomun Park
BomunPark Apartment
ParkApartment Complex,
ApartmentComplex, Seongbuk-gu,
Complex,Seongbuk-gu,
Seongbuk-gu,Seoul; (a)(a)
Seoul;
Seoul; (a) Satellite image
Satellite
Satellite in 2010
image
image in 2010 andand
in 2010
and (b)
(b)
Satellite
(b) image
Satellite
Satellite in
image
image 2018.
in 2018.
in 2018.
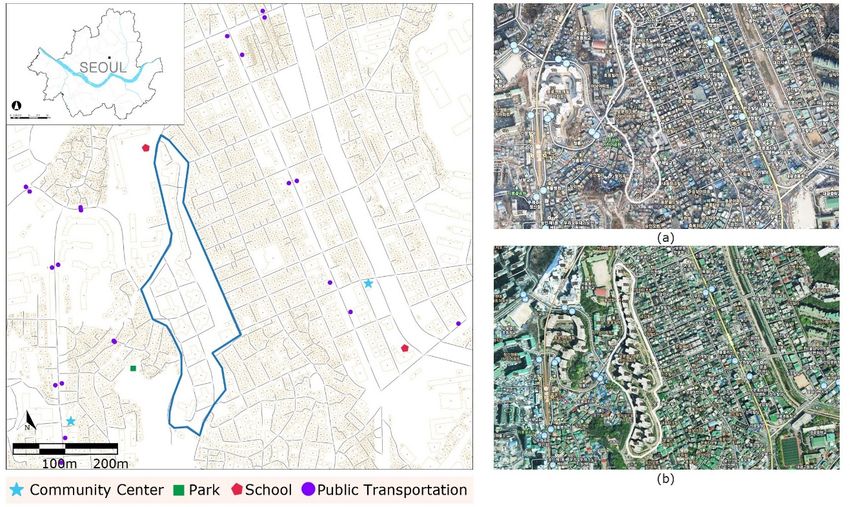
Figure 4.
Figure
Figure 4. Lotte
4. Lotte Castle
Lotte Castle Apartment
Castle Apartment Complex,
Apartment Complex, Dongdaemun-gu,
Complex, Dongdaemun-gu, Seoul;
Dongdaemun-gu, Seoul; (a) Satellite image
(a) Satellite
Satellite image in
image in 2010
in 2010 and
2010 and
and
(b)
(b) Satellite
Satellite image
image in
in 2018.
2018.
(b) Satellite image in 2018.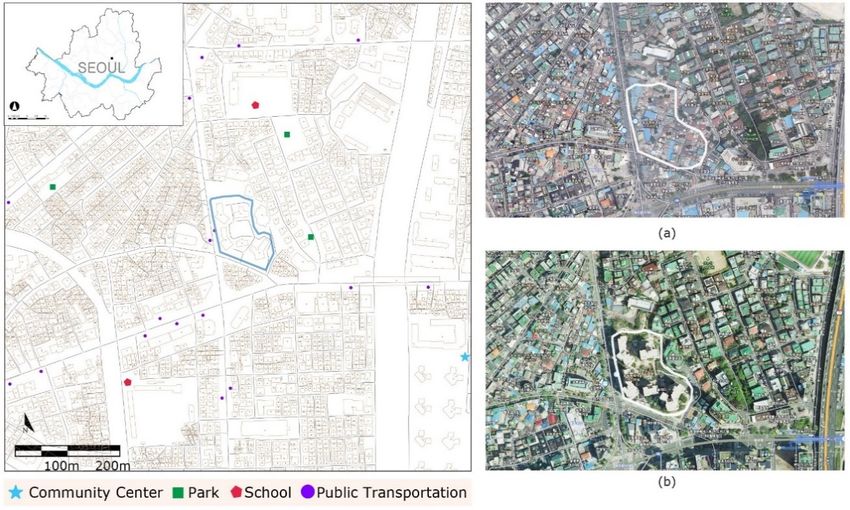
Sustainability 2020, 12, 7335 6 of 17
Sustainability 2020, 12, x FOR PEER REVIEW 6 of 17
SangdoPark
Figure 5. Sangdo ParkApartment
ApartmentComplex,
Complex, Dongjak-gu,
Dongjak-gu, Seoul;
Seoul; (a) (a) Satellite
Satellite image
image in 2010
in 2010 andand
(b)
(b) Satellite
Satellite image
image in 2018.
in 2018.
This study
This study used
used road
road network
networkmaps
mapsofofSeoul
Seoulinin2010
2010and
and2018
2018toto
analyze
analyzethethe
physical changes
physical changes in
pedestrian
in environments,
pedestrian environments, comparing
comparingbusiness districts
business where
districts construction
where began
construction before
began 20102010
before and and
was
completed before 2017 to assess impacts before and after apartment complex development.
was completed before 2017 to assess impacts before and after apartment complex development. Thirty
apartment
Thirty development
apartment sites are
development available
sites for thisfor
are available analysis. Of theOf
this analysis. 30the
apartment complex
30 apartment sites, three
complex sites,
case study
three areas (from
case study amongamong
areas (from the most
thehighly gated communities)
most highly were selected
gated communities) as shown
were selected as in Tablein
shown 1.
Analysis sites include the Bomun Park apartment complex in Seongbuk-gu, the Lotte Castle
Table 1. Analysis sites include the Bomun Park apartment complex in Seongbuk-gu, the Lotte Castle apartment
complex incomplex
apartment Dongdaemun-gu, and the Sangdo
in Dongdaemun-gu, Park
and the apartment
Sangdo Park complex
apartment in complex
Dongjak-gu.in Dongjak-gu.
Table 1.
Table Introduction of
1. Introduction of three
three case
case study
study sites
sites in
in Seoul,
Seoul, South
South Korea.
Korea.
Case
Case Case
Case1: Bomun Park
1: Bomun Park AC
AC Case 2:
Case 2:Lotte
LotteCastle
CastleAC
AC Case
Case3:3:Sangdo
SangdoPark
ParkAC
AC
Location
Location Seongbuk-gu
Seongbuk-gu Dongdaemun-gu
Dongdaemun-gu Dongjak-gu
Dongjak-gu
Project 2 m22 22
Projectarea
area 52.246
52.246mm2 15.380m
15.380 32.001mm
32.001
Project type
Project type Redevelopment
Redevelopment Redevelopment
Redevelopment Redevelopment
Redevelopment
Site perimeter length 1400 m 520 m 550 m
Site perimeter length 1400 m 520 m 550 m
Cities with
with high
highdensity
densitydevelopment
developmentand andwell-connected
well-connectedurban
urban streets
streets have
have anan opportunity
opportunity to
to decrease
decrease transportation
transportation costs.
costs. However,
However, thesegregated
the segregatedurban
urbanfabrics
fabricsduedueto
to the
the development
development of
large-scale apartment
apartmentcomplexes
complexes (ACs) mightmight
(ACs) have negative impacts impacts
have negative on walkability for the surrounding
on walkability for the
neighborhoods.
surrounding This study focuses
neighborhoods. Thison the before-and-after
study focuses on the analysis of the large-scale
before-and-after analysisapartment complex
of the large-scale
development
apartment in termsdevelopment
complex of accessibilities to primary
in terms destinations such
of accessibilities as community
to primary centers,
destinations parks,
such as
schools, and public transportation.
community centers, parks, schools, and public transportation.
3.2. Method
3.2. Method
Walking networks
Walking are important
networks are factors for
important factors for initiating
initiating and
and sticking
sticking with
with walking
walking behaviors.
behaviors.
Various network analysis concepts are used to measure the integration of social and spatial
Various network analysis concepts are used to measure the integration of social and spatial networks.networks.
These concepts
These conceptshave
havebeen
beenused in the
used in designing and planning
the designing of citiesofforcities
and planning several
fordecades.
several In particular,
decades. In
particular, the concepts have been used most commonly in areas of disaster planning, transportation
planning, and facility planning.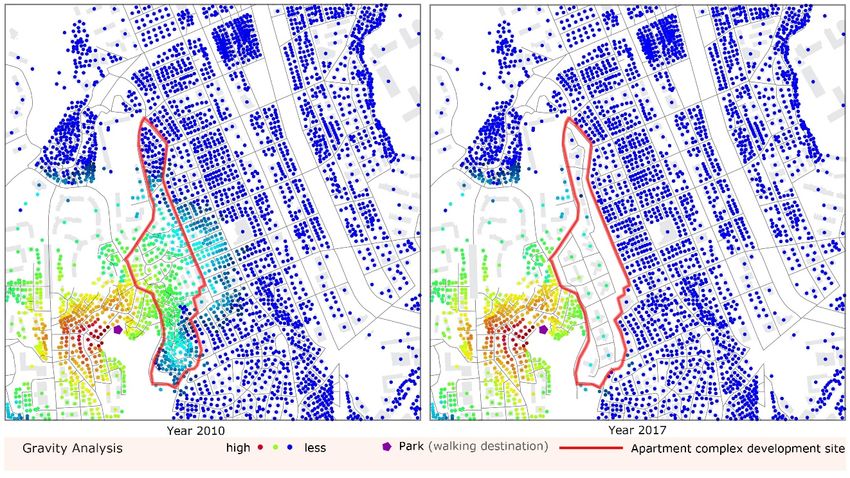
Sustainability 2020, 12, 7335                                                                                              7 of 17

the concepts have been used most commonly in areas of disaster planning, transportation planning,
and facility planning.
     One of the most applied concepts for investigating society-space relationships is the space syntax
method. In establishing the now well-known space syntax methodology, Hillier and Hanson [33]
applied the representation and analytic tools of graphs to street networks. From architectural building
levels to city and country levels, plenty of work has been conducted with this methodology. Hillier and
Hanson chose to represent streets with axial lines instead of street centerlines in their methodology [33].
This approach has led to some criticism, however, because the specification of axial lines is subjective
(that is, there is more than one solution) and poorly applicable to sparsely built-up streets [34].
Space syntax studies (as well as most of the other spatial network studies to date) have represented
networks using two types of elements—nodes and edges. Edges typically represent street segments
and nodes represent the junctions where two or more edges intersect [35].
     Contrary to deficiencies in space syntax and other network analysis methodologies, the urban
network analysis (UNA) framework [36] has a useful modification. Urban network analysis adds
buildings (housing or other infrastructures) to representations, adopting a tripartite system that consists
of three basic elements: edges, nodes, and buildings. In the UNA method, each building connects to the
nearest street segment (edge) with the shortest connection [37]. The standard three-level presentation
of spatial networks in UNA methodology is well suited for mapping urban and regional networks of
various typologies and scales. Table 2 includes key indicators and their formulas with descriptions in
the UNA toolbox.

        Table 2. Overview of accessibility and centrality indicators of the urban network analysis toolbox.

                   Indicators                                 Formula                                Description *
                                                                                           The number of surrounding
                                                                    r                      points (buildings, doorways, bus
                                                               P [i] =
                                                             Reach
                                   Reach                                       W [ j]      stops, etc.) that each building
                                                      j ∈ G−{i}, d[i, j] ≤ r               reaches within the radius specified
                                                                                           in the network.
       Accessibility                                                                       The travel cost required to arrive
        measures                                                                           at each of the destinations.
                                                           Gravity[i]r =                   Accessibility at the origin is
                                  Gravity                    P          W [ j]             proportional to the attractiveness
                                                                             eβd[i,   j]
                                                      j ∈ G−i, d[i, j] ≤ r                 (weight) of destinations and
                                                                                           inversely proportional to the
                                                                                           distances between.
                                                                                           Illustrates the extent to which the
                                                        Straightnessr [i] =                shortest paths from origins to
                                Straightness               P          δ[i, j]              destinations resemble straight
                                                                      d[i, j]
                                                                              W [ j]
                                                   j ∈ G−{i}, d[i, j] ≤ r                  Euclidian paths. The closer to 1,
        Centrality                                                                         the more straight the path is.
        measures
                                                                                           The index divided by the number
                                                        Betweennessr [i] =                 of paths passing through a specific
                                Betweenness                P        n jk [i]               point by the number of shortest
                                                                      n jk W [ j]
                                                    j ∈ G−i, d[i, j] ≤ r                   paths between destinations within
                                                                                           the set radius.
            * This study used the radius of 600 m and the beta value of 0.00217 based on previous studies [37,38].

     This study analyzes correlations between changes in walking networks and the design of apartment
complexes in the typical residential style of Korea. Large-scale apartment complex development may
destroy existing urban street networks, thereby obstructing the vitality of the whole city following
completion. This study aims to examine changes in neighborhood walking environments following
new apartment-style residential developments in existing urban fabrics. We assume that new
apartment-style residential developments are highly likely to disrupt the well-connected small blocks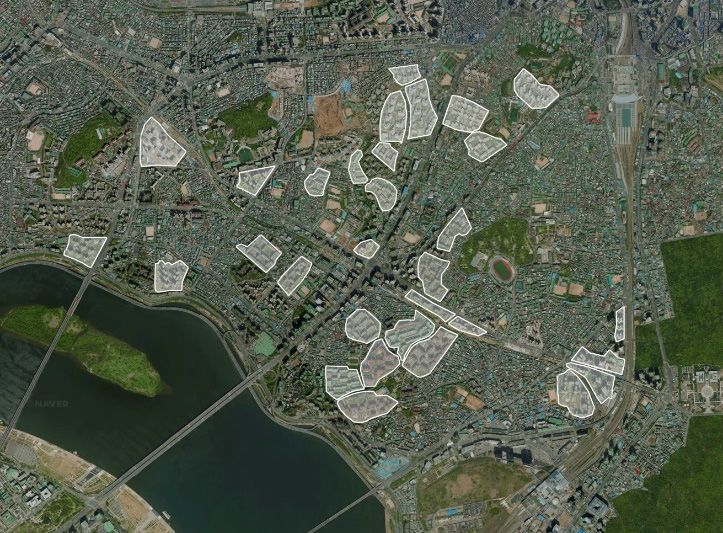
Sustainability 2020, 12, 7335                                                                          8 of 17

of existing urban areas. We use “before-and-after analysis” for the neighborhoods of three apartment
complex developments that were constructed and completed from 2010 to 2017. To analyze the
impacts of the new apartment complexes on surrounding walking environments, this study uses
the urban network analysis (UNA) toolbox, developed by the City Form Lab at the Massachusetts
Institute of Technology (MIT). Urban network analysis (UNA) is a spatial network analysis tool that
analyzes five indicators of accessibility and centrality through network distances between departure
and arrival points.
      Changes in pedestrian environments in and around the apartment complexes were analyzed by
measuring accessibility and centrality before and after apartment complex development. Table 2 shows
the indicators measured in this study including gravity index, reach, straightness, and betweenness.
Among these indicators, gravity index and reach comprise the accessibility index, while betweenness
and straightness are the centrality index.
      First of all, the reach variable is the number of origins in the network radius (based on path
distance, not straight lines) at the destination. Thus, a large reach within the same street network
means that many buildings are concentrated around the destination and that (building) access to the
destination is high. Sevtsuk [37] demonstrates that a higher reach means a higher probability of a store
being located there. In this study, we calculated the reach index using the radius of 600 m.
      Second, the gravity index (a representative indicator of accessibility) is similar to the reach measure.
Gravity index additionally measures factors in the spatial impedance required to travel to each of the
destinations. Gravity index increases as distance increases, with an example of distance being the
spatial resistance to reach a destination from a starting point within the set radius. Gravity measures
factors in the travel costs required to arrive at each of the destinations. In this measurement, the beta
value can be decided based on local and user characteristics. For walkability analysis, we used a beta
value of 0.00217 based on the previous study [38].
      Third, the straightness indicator (showing centrality) is an indicator of how close the network
connection is to a straight line. The straight line distance from each source to each destination is
divided by the network distance (that is, the distance based on the actual route).
      To put it more clearly, straightness illustrates the comparison of the crow flies distance to the
shortest path connection between each origin and destination [39]. When the distances between nodes
get longer, the differences between the network distance and the crow flies distance start diminishing.
The straightness indicator in the UNA toolbox has similarities with mean depth analysis in space
syntax. A higher mean depth is the same as less straightness. In other words, the higher the integration
of a node, the lower its depth [8]. To solve this problem, apartment complexes should not only be open
to the outside environment, but the street network inside a complex must also comply with the street
network outside.
      Analyses performed by the UNA toolbox require three key inputs—a network, along which
movement is analyzed, a trip origin, and a trip destination. Setting up a network and the appropriate
origin and destination weights are typically the first steps in any UNA application [39]. First,
the network and walking origin data used in this study were received from a source known as
the “Road Name Address DB”, which was provided by the Ministry of Public Administration and
Security. We conducted the generation of pedestrian networks based on street centerlines by using
computer-aided design (CAD) software. Second, for walking origins, data about buildings were
converted from shapefile formats (SHP) using ArcGIS geographic information software. Third, for the
destination input, point shape data were created on Rhinoceros 3D (Rhino) software by checking
elementary schools, parks, community centers, and transportation stops on Google Maps.

4. Analysis
     Apartment complexes are very common types of residence in Seoul, Korea. Apartments account
for nearly half of total residential types in cities. According to data from the 2018 Housing Survey,
apartments accounted for 49.2% (42.2% of housing types in the city of Seoul) of all housing types in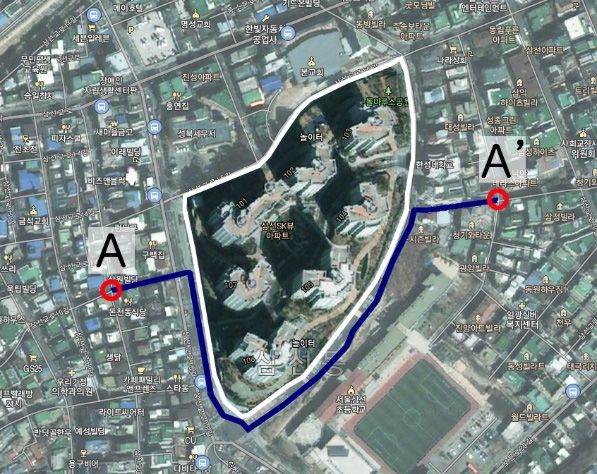
Sustainability 2020, 12, 7335                                                                        9 of 17

Korea [7]. Apartments allow more efficient use of development sites by accommodating a greater
population per unit area than any other type of residence. In addition, many Korean people prefer to
live in apartment complexes because of high levels of privacy and security in comparison to other
types of housing. Despite the many advantages of apartments, however, the construction of large
apartment complexes is criticized for reducing the continuity and accessibility of urban spaces by
strictly restricting the inflow of cars and pedestrians due to partial or fully privatized networks.
      Meanwhile, urban improvement projects are implemented in accordance with procedures based on
“Urban and Residential Environment Improvement Law” in designated areas where urban functions
need to be restored or where housing environments are poor, for the sake of improving and/or
reconstructing buildings that are defective and old. During urban improvement projects, unlike other
development activities, existing land is used without the purchase of new land. Thus, there is no
change in land areas before and after these projects. In addition, urban improvement projects are
implemented to improve and repair the physical and social conditions of residential areas and to
improve areas where old and defective buildings are concentrated [40].
      As such, improvement projects necessarily involve changes in physical environments centered on
buildings, and can be classified according to the nature, purpose, and project promotion procedures
of the improvement project. In the work of Kim [41], such improvement projects are classified as
residential environment improvement projects, housing redevelopment projects, housing reconstruction
projects, urban environment improvement projects, residential environment management projects,
and street housing improvement projects according to the characteristics and forms of the project.
The development of large apartment complexes causes changes in pedestrian accessibility around
spatial sites. More specifically, the enclosed form of apartment complexes deactivates the short
paths of pedestrian networks, thereby negatively affecting accessibility. In order to confirm this
hypothesis, accessibility analysis of pedestrian networks before and after development was conducted
by using UNA on Rhino software. Three inputs were implemented including a network, trip origins,
and trip destinations.
      Accessibility is comprised of indicators gravity and reach, while centrality includes the indicators
of straightness and betweenness. Every accessibility and centrality indicator reflects a spatial property
of a network. Gravity, straightness, and betweenness are used to explain how some places are places
of shorter accessing time (gravity), how some places are accessible via a straight route to other places
(straightness), and how some places are situated between two other pairs of places (betweenness).
      The better a connection with a surrounding network, the higher the measured value. Our results
compare characteristics before and after the development of apartment complexes at three sites. Having
calculated these measurements in the networks before the development of the apartment complexes
and after the development of the apartment complexes, we found significant differences between them.
      This study analyzes the pedestrian accessibility and centrality of public facilities by neighborhood
residents in cases of apartment complexes. Pedestrian accessibility was calculated from the location
and pedestrian route of starting and destination points, and analysis was conducted by simplifying
these factors into points and lines.
      The radius value of the gravity index, betweenness, and straightness (used as an analytical
index) was set to 500 m. Each of the indicators is based on the network distance within the radius set
according to individual buildings (the starting points of walking environments) and public facilities
(the destinations). The beta (β) used in the gravity index was derived by applying a walking distance
(m) criterion of 0.00217, following previous research, to obtain results. The distance strategy coefficient
β is the effect of the reduction of the distance on each shortest path between the starting point and the
destination point. The index was used as a control, and results were obtained by applying a walking
distance (m) value of 0.00217 based on previous studies [42,43].
      Table 3 shows the number of buildings—that is, the origins in accessibility and centrality
indicators. “Inside” represents only the measurements for inside parts of the apartment complexes
in each case study, while “outside” refers to areas excluding the apartment complexes themselves.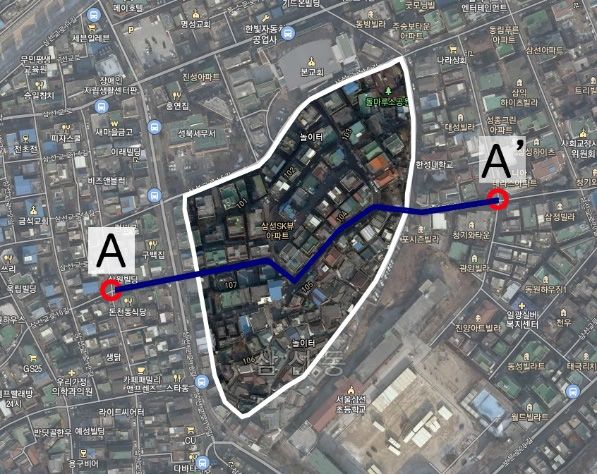
Sustainability 2020, 12, 7335                                                                                                           10 of 17

“Total” measurement refers to the whole apartment complex and surrounding area. Development
of an apartment complex combines existing small-scale parcels and new construction of large-scale
parcels and high-rise main buildings by dismantling and constructing low-rise, stand-alone buildings.
To support this, it was observed that about 10.4%, 5.4%, and 3.96% of buildings are reduced by
the effects of apartment development in the cases of Bomun Park, Lotte Castle, and Sangdo Park,
respectively (Table 3).

                         Table 3. Number of origin points inside and outside the analysis site.

                                        Before Development                           After Development                     Percent Change
      Case Study Sites
                                   Total        Inside          Outside          Total        Inside       Outside      (Inside Origin Points)

  Bomun Park AC (case 1)            3522          367               3155         3170           15          3155               −10.4%
  Lotte Castle AC (case 2)          2944          164               2780         2785           5           2780               −5.4%
  Sangdo Park AC (case 3)           3230          135               3095         3102           7           3095               −3.96%

     Table 4 summarizes the distribution of public facilities (community centers, public parks,
elementary schools, and public transportation stops) around the analysis sites. These public facilities,
identified in every complete neighborhood, are primary destinations for pedestrians. In Korean cities,
community centers and elementary schools are designed to be within walking distance for residents of
any given area.

                                Table 4. Number of destination points around the analysis site.

                                 Community                                    Schools                Public Transport
                                                            Parks                                                          Total Number of
                                  Centers                                  (Elementary)                  Station
                                                                                                                          Destination Points
                                  No.       %      No.          %          No.            %          No.       %
 Bomun Park AC (case 1)            2       7.7%         1      3.9%         2            7.7%        21       80.8%                26
  Lotte Castle AC (case 2)         1       4.2%         3      12.5%        2            8.3%        18       75.0%                24
 Sangdo Park AC (case 3)           2       5.3%         3      7.9%         1            2.6%        32       84.2%                38

      The distance factor for these two destinations (community centers and elementary schools) is
critical for pedestrians, especially for elderly people and children. With regard to the other two
types of public facilities (parks and public transportation stations), accessibility is the main reason for
residents to prefer walking. Alternatives to walking will be chosen if accessibility by walking is poor
for pedestrians. Namely, the longer it takes to reach public facilities including community centers,
parks, elementary schools, and transportation stations by walking, the more automobiles will be used.
      Each building in each of the case study development sites and surrounding areas is the starting
point for moving to the points of destination. The public facilities (community centers, parks, schools,
and transportation stations) are the destination areas for analysis. The results of accessibility and
centrality analyses are shown in Tables 5 and 6. According to these results, there are decreasing trends
due to apartment complex redevelopment in all four measures, with the exception of some special
conditions. The downward trend for these four measures can be explained as follows.
Sustainability 2020, 12, 7335 11 of 17
Table 5. Average results of accessibility and centrality analysis of surrounding facilities before and after development of apartment complex (all areas).
Before Development of Apartment Complexes, 2010 After Development of Apartment Complexes, 2017 Percent Change (2010-2017)
Community Schools Public Transport Community Schools Public Transport Community Schools Public Transport
Parks Parks Parks
Centers (Elementary) Stations Centers (Elementary) Stations Centers (Elementary) Stations
Gravity index 0.285 0.112 0.320 3.082 0.295 0.096 0.320 3.008 3.41% −14.72% −0.01% −2.41%
Bomun Park Reach 0.554 0.215 0.650 6.005 0.558 0.169 0.659 5.681 0.69% −21.33% 1.33% −5.39%
AC (case 1) Betweenness 15.079 7.247 16.660 172.238 14.464 4.593 14.857 149.149 −4.08% −36.62% −12.13% −13.41%
Straightness 0.411 0.109 0.475 4.423 0.409 0.089 0.474 4.196 −0.40% −18.99% −0.02% −5.13%
Gravity index 0.028 0.533 0.420 3.723 0.030 0.531 0.434 3.642 5.71% −0.35% 3.22% −2.18%
Lotte Castle Reach 0.054 1.070 0.876 7.445 0.057 1.059 0.901 7.279 5.71% −1.04% 2.72% −2.23%
AC (case 2) Betweenness 0.854 26.851 22.000 176.615 0.903 25.897 22.535 168.627 5.71% −3.55% 2.37% −4.52%
Straightness 0.040 0.742 0.651 5.600 0.042 0.752 0.672 5.478 5.71% 1.23% 3.12% −2.17%
Gravity index 0.223 0.213 0.057 4.421 0.217 0.142 0.059 4.097 −2.52% −3.30% 3.96% −7.33%
Sangdo Park Reach 0.425 0.438 0.104 8.902 0.405 0.294 0.108 8.220 −4.75% −32.91% 3.96% −7.67%
AC (case 3) Betweenness 13.347 12.693 4.307 222.428 12.593 8.772 4.484 201.113 −5.65% −30.89% 3.96% −9.58%
Straightness 0.285 0.286 0.065 6.388 0.270 0.186 0.068 5.926 −5.15% −34.82% 3.96% −7.24%
Table 6. Average results of accessibility and centrality analysis of surrounding facilities before and after development of apartment complexes (outside).
Before Development of Apartment Complexes, 2010 After Development of Apartment Complexes, 2017 Percent Change (2010–2017)
Community Schools Public Transport Community Schools Public Transport Community Schools Public Transport
Parks Parks Parks
Centers (Elementary) Stations Centers (Elementary) Stations Centers (Elementary) Stations
Gravity index 0.296 0.098 0.320 3.100 0.296 0.096 0.319 3.017 0.00% −2.17% −0.20% −2.67%
Bomun Park Reach 0.560 0.176 0.659 5.908 0.561 0.170 0.658 5.694 0.11% −3.42% −0.14% −3.62%
AC (case 1) Betweenness 16.191 7.040 15.006 175.723 14.532 4.615 14.917 149.836 −10.25% −34.44% −0.59% −14.73%
Straightness 0.411 0.092 0.476 4.364 0.411 0.089 0.474 4.208 0.10% −3.67% −0.38% −3.55%
Gravity index 0.030 0.531 0.434 3.641 0.030 0.531 0.434 3.642 0.00% 0.04% 0.07% 0.02%
Lotte Castle Reach 0.057 1.059 0.902 7.277 0.057 1.059 0.903 7.278 0.00% 0.03% 0.04% 0.01%
AC (case 2) Betweenness 0.904 27.272 23.036 174.562 0.904 25.940 22.575 168.906 0.00% −4.88% −2.00% −3.24%
Straightness 0.042 0.752 0.673 5.478 0.042 0.752 0.673 5.480 0.00% 0.02% 0.04% 0.02%
Gravity index 0.219 0.196 0.059 4.209 0.218 0.143 0.059 4.101 −0.68% −27.38% 0.00% −2.56%
Sangdo Park Reach 0.410 0.411 0.109 8.481 0.406 0.294 0.109 8.227 −1.02% −28.38% 0.00% −3.00%
AC (case 3) Betweenness 13.588 10.816 4.494 214.937 12.622 8.791 4.494 201.551 −7.11% −18.72% 0.00% −6.23%
Straightness 0.274 0.267 0.068 6.111 0.271 0.187 0.068 5.933 −1.05% −30.12% 0.00% −2.92%Sustainability 2020, 12, 7335 12 of 17
A decrease in the measures of gravity and reach means an increased time required to arrive
at destinations. With some exceptional cases, the longer it takes to arrive at a destination, the less
favorable the environment is for walking [43]. Thus, we can say walkability is worsened by apartment
complex development because of the deterioration of accessibility. Second, a decrease in the measure
of straightness does not necessarily mean a decrease in walking intentions on the part of pedestrians.
For transportation purposes, the shortest path (representing the straightness measure) is always
desirable. In some conditions of walking for recreation, however, curving and/or non-linear paths are
more desirable [43].
In brief, the overall results of analysis support our hypothesis that the development of apartment
complexes has negative effects on pedestrian environments. In addition, however, the results also
suggest that other spatial conditions need to be considered in terms of their effects on pedestrian
environments. Table 5 shows the overall results of changes in the accessibility and centrality of all
origins, including both apartment complexes and surrounding areas, to public facilities (community
centers, parks, elementary schools, bus stops, and subway entrances) due to the construction of
apartment complexes.
Even though the gravity index, reach, straightness, and betweenness indicators appear to be
decreasing in most situations, there are some exceptions. For example, average measurements for
school destinations in case 2 and case 3 are increasing, as is the measurement for the destination of the
community center in case 2. In the analysis results in Table 5, however, the number of origins (as a
building unit in this analysis) is not the same in 2010 and 2017. Also included in the measurements are
origins inside the development sites.
In order to determine the effects of redevelopment on the accessibility and centrality of surrounding
areas only, we excluded origins in apartment redevelopment sites and conducted analysis again. Table 6
shows the average accessibility and centrality analysis results for the surrounding areas, excluding the
apartment redevelopment area itself. According to the results, the construction of apartment complexes
generally reduced the gravity index, reach, straightness, and betweenness in the areas of analysis.
Unlike the results in Table 5, the average measurements for the destinations of schools in case
2 and case 3 and the destination of the community center in case 2 do not change, or change very
slightly, in the results in Table 6. The reason for this is that improvements in accessibility and centrality
measurements on these occasions are only for the inside of apartment complexes, while the areas
around the apartment complexes are not significantly improved by development.
One of the most interesting results of this analysis is that even though case 2 (Lotte Castle Apartment
Complex) is the most “gated community” apartment complex plan based on the perimeter-per-gate
value (1 gate to every 550 m boundary), case 2 has the lowest change of decrease in the values of
accessibility and centrality measurements among the three cases. This can be explained because the
pedestrian network in case 2 was not well connected before development of the apartment complex.
Further, in comparison to the other two cases, the smaller area of the apartment complex in case 2
lessens the surrounding effects.
Figures 6–9 illustrate the visual explanation of the change in Reach, Gravity, Straightness, and
Betweenness with 4 samples, chosen from situations in which there are significant changes before
and after apartment complex development. In these visualizations, the red color indicates places
where gravity, straightness, and betweenness are the highest, followed by yellow, green, and light
blue. On the other hand, the dark blue color depicts the lowest values. It is clearly seen, both by the
numerical results in Tables 5 and 6 and by the depiction of gravity, straightness, and betweenness in
Figures 6–9, that apartment complex development negatively affects accessibility.Sustainability 2020, 12, x FOR PEER REVIEW 13 of 17
Sustainability 2020, 12, 7335 13 of 17
Sustainability 2020, 12, x FOR PEER REVIEW 13 of 17
Figure 6. Before-and-after visualization of reach values for the park destination (case 1: Bomun Park
AC).
In Figure 7, gravity analysis of the case 1 (Bomun Park AC) is exhibited. The colors on the right
FigureFigure
side of the 6. Before-and-after
apartment visualization
development
6. Before-and-after ofofchanging
site are
visualization reach values
reach for the
from
values for park
green thetodestination (case
can1:be
blue,destination
park which Bomun 1:Park
interpreted
(case as
Bomun
a signAC).
Park of worsening accessibility to the park.
AC).
In Figure 7, gravity analysis of the case 1 (Bomun Park AC) is exhibited. The colors on the right
side of the apartment development site are changing from green to blue, which can be interpreted as
a sign of worsening accessibility to the park.
Figure 7. Before-and-after
Figure 7. Before-and-aftervisualization
visualization ofofgravity
gravity values
values forpark
for the the destination
park destination (case 1:Park
(case 1: Bomun Bomun
Park AC).
AC).
FigureFigure 8 shows
6 shows the visualization
the visualization of straight
of reach for theaccessibility
destinationtoofthe destination
park in the case of1park in case
(Bomun 3 AC).
Park
Figure
(Sangdo 7. Before-and-after
Park AC).itThe changevisualization
in acolors of gravity
clearly values for the park destination (case 1: Bomun Park
In this visualization, is seen that number of depicts
buildingsthaton
thethe
south partside
right of apartment development
of the apartment complex
site AC).
is experiencing deteriorating direct access to the park.
are becoming unreachable for the nearby park destination after the development of the apartment
complex. Figure
The long form the
8 shows of Bomun Park AC
visualization (case 1)accessibility
of straight stays as a barrier between the
to the destination of neighborhood
park in case 3 and
the destination.
(Sangdo Park AC). The change in colors clearly depicts that the south part of apartment development
In
siteFigure 7, gravity
is experiencing analysis ofdirect
deteriorating the case 1 (Bomun
access Park AC) is exhibited. The colors on the right
to the park.
side of the apartment development site are changing from green to blue, which can be interpreted as a
sign of worsening accessibility to the park.
Figure 8 shows the visualization of straight accessibility to the destination of park in case 3
(Sangdo Park AC). The change in colors clearly depicts that the south part of apartment development
site is experiencing deteriorating direct access to the park.Sustainability 2020, 12, 7335 14 of 17
Sustainability 2020, 12, x FOR PEER REVIEW 14 of 17
Lastly, Figure 9 shows betweenness analysis for the destination of park in case 3 (Sangdo Park
AC). Different than the first 3, visualization was done in this case by coloring the lines, and this depicts
the concentration of connection between origins and destinations. Red and yellow color respectively
exhibit where the street is used the most for the trips between origin and destinations. According to
this visualization, some of the main streets on the south west of the apartment complex are losing
pedestrian weight after the development. In other words, these streets are becoming less commonly
used Sustainability
now. 2020, 12, x FOR PEER REVIEW 14 of 17
Figure 8. Before-and-after visualization of straightness values for one park destination (case 3: Sangdo
Park AC).
Lastly, Figure 9 shows betweenness analysis for the destination of park in case 3 (Sangdo Park
AC). Different than the first 3, visualization was done in this case by coloring the lines, and this
depicts the concentration of connection between origins and destinations. Red and yellow color
respectively exhibit where the street is used the most for the trips between origin and destinations.
According to this visualization, some of the main streets on the south west of the apartment complex
are losing
Figure
Figure pedestrian weight
8. Before-and-after
8. Before-and-after after the development.
visualization straightnessIn
ofofstraightness
visualization otherfor
values
values words,
for one
one these
park
park streets (case
are (case
destination
destination becoming less
3: Sangdo
3: Sangdo
commonly
Park Park used now.
AC).AC).
Lastly, Figure 9 shows betweenness analysis for the destination of park in case 3 (Sangdo Park
AC). Different than the first 3, visualization was done in this case by coloring the lines, and this
depicts the concentration of connection between origins and destinations. Red and yellow color
respectively exhibit where the street is used the most for the trips between origin and destinations.
According to this visualization, some of the main streets on the south west of the apartment complex
are losing pedestrian weight after the development. In other words, these streets are becoming less
commonly used now.
Figure
Figure 9. Before-and-after
9. Before-and-after visualizationof
visualization ofbetweenness
betweenness values
valuesfor the
for park
the destination
park (case(case
destination 3: Sangdo
3: Sangdo
Park
Park AC). AC).
5. Conclusions
This study examines changes in neighborhood walking environments before and after apartment
complex development in existing urban fabrics in Seoul, Korea. We analyzed three apartment complexes
according to accessibility and centrality in terms of changes in walking networks for pedestrians.
Figure 9. Before-and-after visualization of betweenness values for the park destination (case 3: Sangdo
Park AC).Sustainability 2020, 12, 7335 15 of 17
The development of apartment complexes was shown to decrease the walkability of surrounding
areas for the average pedestrian after development of the complex. This finding indicates that organic
links between apartment complexes and surrounding neighborhoods are disconnected. Residents who
live in surrounding areas are more likely to make longer walking trips within the neighborhood as
a result of development. An apartment complex has a closed and private character because many
households share and own parcels within facilities. For outsiders, this restricts accessibility to the
inside of the apartment complex, while heightening convenience for apartment complex residents.
Consequently, the safety and convenience of walking for elementary school students and elderly
people (who are highly dependent on walking) is hindered in surrounding areas [44]. This increase in
private apartment complexes stands to worsen organic linkages in urban space.
While the development of an apartment complex provides high-quality living conditions and safety
for residents, this study confirms that large-scale apartment complexes are likely to undermine walking
conditions for pedestrians in surrounding areas. This finding indicates that urban redevelopment and
readjustment policies should consider the negative impacts of apartment complex development on
surrounding neighborhoods. To greater or lesser extents, the form of new streets inside an apartment
complex may positively affect accessibility, such as in case 2 herein. The nuance of this finding indicates
that the development of a large-scale apartment complex will not necessarily deteriorate walkability for
pedestrians if the inner street networks of the complex are well connected to the outside neighborhoods.
Based on this study alone, findings are insufficient for conclusions on the effects on walking
behaviors due only to changes in physical walking networks following the construction of apartment
complexes. In particular, distance is not the only factor that impacts people’s selection of walking paths.
Other factors such as aesthetics, shade, safety, and familiarity may play significant roles in pedestrians’
walking path choices. Therefore, it is expected that this limitation will be overcome in future research
by adding more data related to other factors to measure changes in physical walking environments due
to the construction of large-scale apartment complexes. Furthermore, future studies should address
the impacts of large-scale apartment complexes on other planning issues such as housing segregation,
income inequality, vernacular architecture, and historic preservation.
Author Contributions: O.D., Conceptualization, data curation, analysis, and writing; J.H., data curation, analysis,
writing and editing; S.L., conceptualization, writing, editing, and supervising. All authors have read and agreed
to the published version of the manuscript.
Funding: This research received no external funding.
Conflicts of Interest: The authors declare no conflict of interest.
References
1. Jacobs, J. The Death and Life of Great American Cities; Random House: New York, NY, USA, 1961. [CrossRef]
2. Stavrides, S. Inhabited common spaces. In Common Space: The City as Commons; Zed Books: London, UK,
2016; p. 130. [CrossRef]
3. Blakely, E.J.; Snyder, M.G. Fortress America: Gated communities in the United States; Brookings Institution Press:
Washington, DC, USA, 1997. [CrossRef]
4. Montavon, M.; Steemers, K.; Cheng, V.; Compagnon, R. La Ville Radieuse by Le Corbusier, once again a case
study. In Proceedings of the PLEA2006—The 23rd Conference on Passive and Low Energy Architecture,
Geneva, Switzerland, 6–8 September 2006.
5. Corbusier, L. The Radiant City; Faber and Faber Limited: London, UK, 1967. [CrossRef]
6. Gelézeau, V. On the Republic of Apartments. East Asian Sci. Technol. Soc. Int. J. 2009, 3, 137–145. [CrossRef]
7. Statistics Korea, Population and Housing Survey. 2018. Available online: https://www.kostat.go.kr/
portal/korea/kor_nw/1/2/2/index.board?bmode=read&bSeq=&aSeq=377115&pageNo=1&rowNum=10&
navCount=10&currPg=&searchInfo=&sTarget=title&sTxt= (accessed on 29 August 2019).
8. Bhiwapurkar, P. Space Syntax and Walkability Analysis in Support of Urban Design Decisions; ARCC Conference
Repository: Cincinnati, OH, USA, 2018.You can also read