A Random Forest Method to Forecast Downbursts Based on Dual-Polarization Radar Signatures - MDPI
←
→
Page content transcription
If your browser does not render page correctly, please read the page content below
remote sensing
Article
A Random Forest Method to Forecast Downbursts
Based on Dual-Polarization Radar Signatures
Bruno L. Medina 1, * , Lawrence D. Carey 1 , Corey G. Amiot 1 , Retha M. Mecikalski 1 ,
William P. Roeder 2 , Todd M. McNamara 2 and Richard J. Blakeslee 3
 1    Department of Atmospheric Science, The University of Alabama in Huntsville, Huntsville, AL 35899, USA;
      lawrence.carey@uah.edu (L.D.C.); ca0019@uah.edu (C.G.A.); retha.mecikalski@nsstc.uah.edu (R.M.M.)
 2    45th Weather Squadron, Patrick Air Force Base, FL 32925, USA; william.roeder@us.af.mil (W.P.R.);
      todd.mcnamara@us.af.mil (T.M.M.)
 3    NASA Marshall Space Flight Center, Huntsville, AL 35805, USA; rich.blakeslee@nasa.gov
 *    Correspondence: blm0032@uah.edu; Tel.: +1-256-824-4031

 Received: 13 March 2019; Accepted: 3 April 2019; Published: 6 April 2019

 Abstract: The United States Air Force’s 45th Weather Squadron provides wind warnings, including
 those for downbursts, at the Cape Canaveral Air Force Station and Kennedy Space Center
 (CCAFS/KSC). This study aims to provide a Random Forest model that classifies thunderstorms’
 downburst and null events using a 35-knot wind threshold to separate these two categories.
 The downburst occurrence was assessed using a dense network of wind observations around
 CCAFS/KSC. Eight dual-polarization radar signatures that are hypothesized to have physical
 implications for downbursts at the surface were automatically calculated for 209 storms and ingested
 into the Random Forest model. The Random Forest model predicted null events more correctly than
 downburst events, with a True Skill Statistic of 0.40. Strong downburst events were better classified
 than those with weaker wind magnitudes. The most important radar signatures were found to be the
 maximum vertically integrated ice and the peak reflectivity. The Random Forest model presented
 a more reliable performance than an automated prediction method based on thresholds of single
 radar signatures. Based on these results, the Random Forest method is suggested for continued
 operational development and testing.

 Keywords: downbursts; dual-polarization radar; Random Forest; statistical learning

1. Introduction
     A downburst is characterized by the occurrence of divergent intense winds at or near the
surface, which are produced by a thunderstorm’s downdraft [1,2]. This phenomenon can produce
substantial surface damage, often similar to that of tornadoes [3]. A number of observational [4–9]
and modeling [10–14] studies have been conducted to reveal the structure, dynamics, microphysics,
and environmental conditions associated with a variety of convective downbursts. Precipitation
microphysical processes such as precipitation loading [10], melting hailstones [6,12,15], and evaporation
of raindrops [10,14,16] are important for downburst generation. Based on this understanding,
automated Doppler radar algorithms for downburst detection have been developed in prior
studies [17,18]. Recently, [19] used radar and environmental variables as input to different machine
learning techniques to predict surface straight-line convective winds.
     In addition to Doppler radar and environmental observations of downbursts, dual-polarization
meteorological radar characteristics for downbursts have been described in recent decades.
For example, the differential reflectivity (Zdr )-hole [6] is caused by melting hail within a downdraft
and is characterized by a region of near-zero dB Zdr and high reflectivity (Zh ) that is surrounded by

Remote Sens. 2019, 11, 826; doi:10.3390/rs11070826                          www.mdpi.com/journal/remotesensing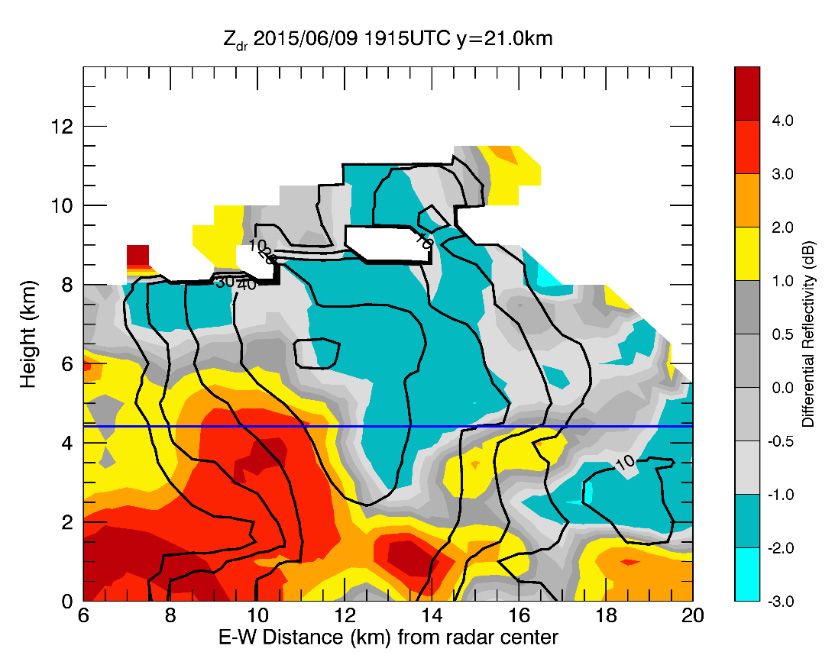
Remote Sens. 2019, 11, 826                                                                           2 of 17

larger Zdr and smaller Zh values. The mixed-phase hydrometeor region caused by hail melting [20,21]
and loading [22] induces a localized reduction in the co-polar correlation coefficient (ρhv ). In another
study [8], a hydrometeor classification algorithm based on dual-polarization radar variables was
utilized to identify a graupel region that transitioned to a rain and hail mixture, descending to the
surface prior to the downburst.
      The prognosis of intense winds has a substantial importance for operations at the Cape Canaveral
Air Force Station and the National Aeronautics and Space Administration (NASA) Kennedy Space
Center (CCAFS/KSC) in Florida. The United States Air Force’s 45th Weather Squadron (45WS)
provides weather warnings for CCAFS/KSC. One of the 45WS operational tasks is to provide forecasts
of winds greater or equal to 35 kt with 30 min of lead time desired, and forecasts of winds greater or
equal to 50 kt with 60 min of lead time desired, in order to protect personnel, infrastructure, space
launch vehicles, and space mission payloads [23–27]. Currently, the 45WS probability of detection
(POD) for convective thunderstorms capable of producing such winds is considered high, but the
probability of false alarm (POFA, same as false alarm ratio [28]) is also high. It is desired to maintain
a high POD as well as high skill scores for other performance metrics such as the True Skill Statistic
(TSS) while simultaneously reducing POFA for 45WS wind warnings [27].
      Using dual-polarization radar signatures that have physical implications for high surface wind
production, this study aims to increase the efficiency in distinguishing convection with the potential to
produce downburst winds greater than or equal to 35 kt and convection that does not produce such
winds. The downburst verification dataset is obtained from a high-density network of observation
towers around CCAFS/KSC, as will be discussed in Section 2.1, which allows for more robust
quantitative observations compared to wind reports from human observers [29]. Radar signatures
used in this study, as described in Section 2.4, are hypothesized to be related to physical processes
that lead to a further development of downbursts at the surface. These radar signatures are input
into a Random Forest model in order to train the model and obtain a prediction of either a wind
event greater or equal to 35 kt or a null event (i.e., wind event less than 35 kt) for each storm in the
dataset. The model also provides a measure of each radar signature’s importance, thus identifying
the signatures that showed the strongest performance in the Random Forest (more in Section 2.6).
The predictability of each radar signature is also tested using a more simple and intuitive approach by
applying thresholds to each signature individually. It is important to note that the spatial extent of each
wind event is not addressed in this study and hence no distinction was made between microbursts and
macrobursts [2]. To our knowledge, this study is pioneering in the application of dual-polarization
radar variables as input into a statistical learning technique to predict downbursts that are validated
using a dense network of wind observation towers.
      This manuscript is organized as follows: Section 2 presents the materials and methods used in
this study. Section 3 shows the Random Forest model results, the signatures that were most relevant to
the model, and results from the threshold-based method for each individual radar signature. Section 4
contains a discussion of results and a comparison to other studies, and Section 5 presents conclusions
and future work.

2. Materials and Methods

2.1. Cape WINDS Towers and Soundings
     Weather observation towers around the CCAFS/KSC complex are used by the 45WS to monitor
weather conditions. The Cape Weather Information Network Display System (Cape WINDS) is
a network of 29 towers that measures, among other variables, temperature, dew point temperature,
peak wind velocity, and mean wind direction. The average station density is one tower per 29 km2 [30]
and their location around the CCAFS/KSC complex is shown in Figure 1. Most towers contain multiple
sensors located at different heights above ground level [30]. In this study, the peak wind velocity in
a 5-min period was used to determine if the 35 kt wind threshold was recorded on any tower, and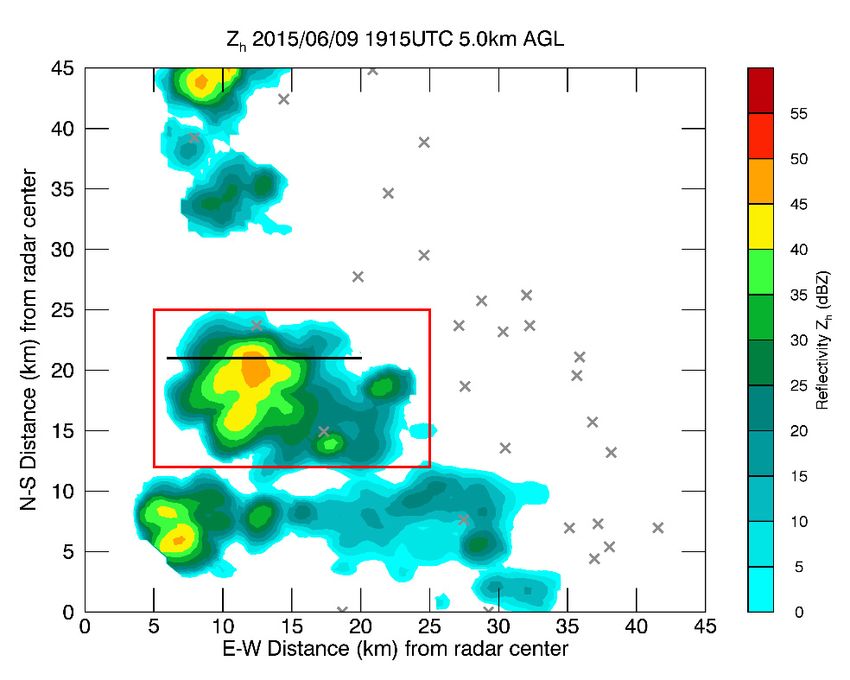
Remote Sens. 2019, 11, x FOR PEER REVIEW 3 of 18
Remote Sens. 2019, 11, 826 3 of 17
Data from KXMR soundings launched at the CCAFS, typically at 00:00, 10:00, and 15:00 UTC
every day, were available for this study. This dataset was primarily used to extract specific isotherm
theheights,
mean windsuchdirection
as 0°C, −10°C,
duringand
the −40°C, which were
5-min period was usedusedtoinhelp
the implementation of somecell
identify the convective radar
that
parameters,
produced as discussedAinwind
the downburst. Section 2.4. For a given
observation storm,
recorded by the
the considered
Cape WINDS isotherm heights
network was were fromto
assumed
theat
occur sounding
a mediannearest to 2.5
time of the min
majority
afterof thestart
the storm’s lifereporting
of the cycle. period.
Figure 1. Cape WINDS tower locations around CCAFS/KSC (red), the 45WS-WSR radar location
Figure 1. Cape WINDS tower locations around CCAFS/KSC (red), the 45WS-WSR radar location
(blue), and the approximated 67 km range from the 45WS-WSR radar (shaded blue).
(blue), and the approximated 67 km range from the 45WS-WSR radar (shaded blue).
Data from KXMR soundings launched at the CCAFS, typically at 00:00, 10:00, and 15:00 UTC
2.2. C-Band Radar and Processing
every day, were available for this study. This dataset was primarily used to extract specific isotherm
heights,AsuchRadtec ◦ C, −Doppler
as 0Titan 10◦ C, and −40◦officially
Radar, C, whichnamed Weather
were used Surveillance
in the Radar (herein
implementation of some 45WS-
radar
WSR), is aasC-band
parameters, discussed dual-polarization
in Section 2.4.radar
For aoperated
given storm,by thethe45WS to provide
considered weather
isotherm support
heights wereto from
the
CCAFS/KSC complex. It operates with a 0.95°
the sounding nearest to the majority of the storm’s life cycle. beamwidth, 5.33 cm wavelength, 24 samples per pulse,
and peak transmitted power of 250 kW [31]. The radar is located about 42 km southwest from the
2.2.CCAFS/KSC
C-Band Radar launch towers, which leads to a horizontal beam width of approximately 600 m and
and Processing
peak vertical gap between radar beams of roughly 700 m over the CCAFS/KSC complex [31] (Figure
A Radtec Titan Doppler Radar, officially named Weather Surveillance Radar (herein 45WS-WSR),
1). Thirteen elevation angles ranging from 0.2° to 28.3° comprise a volume scan, which takes 2.65 min
is atoC-band
completedual-polarization
[32]. Quality control, radar
suchoperated by the
as differential 45WS to correction,
attenuation provide weather
was appliedsupport
to thetorawthe
CCAFS/KSC complex. It operates with a 0.95 ◦ beamwidth, 5.33 cm wavelength, 24 samples per
data prior to their acquisition for this study.
pulse, andThepeak transmitted
raw radar data were power of 250
gridded to kW [31]. The
a Cartesian radar is located
coordinate about
system with 42 km
a 500 southwest
m grid from
resolution,
the 1CCAFS/KSC
km constant launch
radius of towers, which
influence, andleads to a horizontal
a Cressman weighting beam width [33]
function of approximately
using the Python 600ARM
m and
peakRadar Toolkit [34]. The gridding was performed on linear Zh and Zdr, which were then converted1).
vertical gap between radar beams of roughly 700 m over the CCAFS/KSC complex [31] (Figure
Thirteen elevation angles ranging from ◦ to 28.3◦ comprise a volume scan, which takes 2.65 min to
0.2were
back to logarithmic Zh and Zdr. The data gridded out to 100 km north, south, east, and west from
complete [32]. Quality
the 45WS-WSR and 17 control,
km in such as differential
the vertical direction. attenuation correction,
These gridding waswere
attributes applied to thebased
selected raw data
on
thetoradar
prior theirbeam width and
acquisition vertical
for this study.spacing between radar beams over CCAFS/KSC, and through an
empirical
The rawanalysis
radar data using weredifferent
griddedgridding techniques
to a Cartesian performed
coordinate by [31].
system with a 500 m grid resolution,
The radar
1 km constant variables
radius used in this
of influence, andstudy were Zhweighting
a Cressman and Zdr. An evident[33]
function reduction
using in
thethe ρhv values
Python ARM
are Toolkit
Radar typically[34].
observed from thiswas
The gridding radar, possibly on
performed because
linearofZhthe andlowZdrnumber
, whichofwere
samples
thenper pulse
converted
backwithin 45WS-WSR
to logarithmic Zhoperations.
and Zdr . The Values
dataof ρhv were
were griddedoften
outbelow
to 100 0.80
kminnorth,
mixed-phase precipitation
south, east, and westand from
below 0.60 in very heterogeneous mixtures of precipitation [31]. For these
the 45WS-WSR and 17 km in the vertical direction. These gridding attributes were selected based on reasons, ρ hv data were not
the used
radarinbeam
this study.
width and vertical spacing between radar beams over CCAFS/KSC, and through an
empirical analysis using different gridding techniques performed by [31].
The radar variables used in this study were Zh and Zdr . An evident reduction in the ρhv values
are typically observed from this radar, possibly because of the low number of samples per pulse within
45WS-WSR operations. Values of ρhv were often below 0.80 in mixed-phase precipitation and below
0.60 in very heterogeneous mixtures of precipitation [31]. For these reasons, ρhv data were not used in
this study.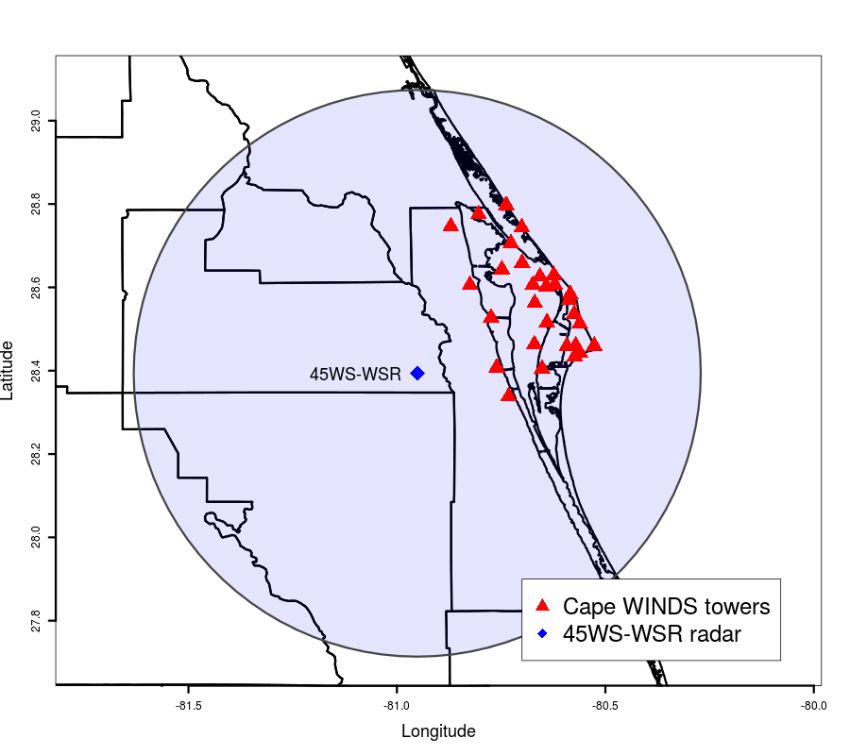
Remote Sens.
Remote Sens. 2019,
2019, 11,
11, 826
x FOR PEER REVIEW 44 of
of 17
18
2.3. Wind and Null Events
2.3. Wind and Null Events
The 2015 and 2016 warm seasons (May through September) were the period used in this study.
The to
In order 2015 and 2016
identify warm seasons
the convective cells(May throughwinds
that caused September)
≥ 35 kt,were the period
hereafter ‘windused in this
events’, thestudy.
Cape
In order towers
WINDS to identify
were the convective
first analyzedcells that caused
to identify winds ≥of35wind
observations kt, hereafter ‘wind
greater than events’,
that the Cape
threshold. It is
WINDS
important towers
to notewere
thatfirst analyzed
the 45WS to identify
considers observations
the wind value of 35 of kt
wind
as agreater than thatfor
hard threshold threshold.
its warnings,It is
important
even with to thenote that the
sensors’ 45WS considers
accuracy of .58 kt thefor wind valueofof0–39
the range 35 ktkt.
asTherefore,
a hard threshold
we arefor alsoits using
warnings,
this
even
hard with the sensors’
threshold accuracy
in this study. Theoftiming
58 kt for the wind
of the rangeobservation
of 0–39 kt. Therefore, we are also
was then compared tousing this
the radar
hard
data threshold
timing. The in this
timestudy. The timing
of a radar volume of the
scan wind
wasobservation
consideredwas to bethen
thecompared
median value to the within
radar data
the
timing.
volume The time
scan’s 2.65ofmina radar volume
duration scan
(i.e., was considered
approximately 1 min to and
be the20 median
s after thevalue within
volume scan theinitiation
volume
scan’s
time). 2.65
Next,min
eachduration (i.e., approximately
wind observation 1 min and
was associated to a20single
s afterradar
the volume
volumescan scan. initiation
The wind time). Next,
direction
each windto
was used observation
help determine was associated to a single
which convective cellradar
was volume
associatedscan.withTheanwind direction
observed was used
downburst. to
The
help determine
convective which
cell had convective
to be located atcell was associated
a maximum distance withof an
10 observed
km from the downburst.
Cape WINDS The convective
tower that
cell had tothe
observed bewind
located ≥ 35atkta at
maximum
the moment distance of 10 km from
the downburst the Cape
occurred. WINDS
If these tower that
requirements were observed
all met,
cell was
the wind ≥ 35manually tracked the
kt at the moment backward
downburst in time, whichIf had
occurred. thesetorequirements
last at least were 30 min. A box
all met, thewas
cell
subjectively
was manually defined
tracked around
backward the cell
in throughout
time, whichits lifetocycle,
had ignoring
last at least 30itsmin.
history
A box after thesubjectively
was downburst
time. If the
defined cell’sthe
around 40 cell
dBZthroughout
reflectivityits contour wasignoring
life cycle, merged its with another
history cell
after theatdownburst
any height time.level,Ifboth
the
storms
cell’s 40were
dBZ considered
reflectivity as one. These
contour cells were
was merged withtracked
another until
celltheir initiation
at any or until
height level, thestorms
both radar range
were
distance of as
considered 67one.
km These
(Figurecells1) because
were trackedvertical gaps
until in initiation
their the gridded datathe
or until become
radar significant
range distance at this
of
distance
67 [31]. An
km (Figure 1) example of a wind
because vertical event
gaps in is
theshown
griddedin Figure 2, with asignificant
data become red box representing
at this distancethe cell’s
[31].
spatial
An exampledefinition,
of a wind which
event is resulted
shown in from
Figuremanual
2, with storm
a red box tracking. Highthe
representing winds associated
cell’s spatial with
definition,
hurricanes,
which andfrom
resulted consistent
manualhigh stormbiased
tracking.values in winds
High a single instrument
associated with not verified in
hurricanes, andneighboring
consistent
sensors,
high were
biased discarded.
values in a single instrument not verified in neighboring sensors, were discarded.
Convective cells that did not produce such high winds (i.e.,Remote Sens. 2019, 11, 826 5 of 17
2.4. Dual-Polarization Radar Signatures
Once the radar data were gridded and the convective cells were identified and tracked, a large
number of radar parameters (i.e., signatures) were calculated for every wind and null case. This
method can be referred to as ‘semi-automated analysis’, since storms were manually tracked and radar
signatures were automatically and objectively calculated for all storms. About 50 signatures were
initially considered, all with a physical process hypothesized to be directly or indirectly related to
a future occurrence of a downburst, as reviewed in Section 1. A considerable fraction of parameters
were representing the same process, with variations in the radar threshold being the only difference.
As an example, a signature that uses both Zh and Zdr data for identification of precipitation ice was
tested using different thresholds of Zh . Then, in an attempt to reduce the amount of redundant
information among the numerous signatures, a correlation analysis was performed. For large
correlations (i.e., 0.70 or higher) between two radar signatures, only one signature was kept for
further study, which was the signature that had the lowest correlation values with all other radar
signatures examined. After this first reduction process, a Principal Component Analysis (PCA) [35]
was performed to identify the variables that explained the most variance. The signatures with relatively
large correlation (i.e., 0.60 or higher) with the first PCA level—which explains the most variance in the
dataset—were selected as the final radar signatures. The number of radar signatures was ultimately
reduced to eight, all based on radar variables Zh and/or Zdr . The parameters are listed in Table 1 and
described in detail below.
Table 1. Radar signature numbers, physical descriptions, and units.
Signature Number Description Units
vertical extent of the 1 dB Zdr contour in a Zdr column in the presence of Zh
S#1 m
≥ 30 dBZ at temperatures colder than 0◦ C
vertical extent of co-located values of Zh ≥ 30 dBZ and Zdr ~0 dB at
S#2 m
temperatures colder than 0◦ C
S#3 maximum vertically integrated ice (VII) within a storm kg m−2
S#4 height of the peak Zh in the storm m
S#5 peak Zh at temperatures colder than 0◦ C dBZ
S#6 peak Zh at any temperature within a storm dBZ
S#7 maximum vertically integrated liquid (VIL) within a storm kg m−2
S#8 maximum density of VIL (DVIL) within a storm g m−3
Signature #1 implies that storm’s updraft lifts a significant amount of liquid hydrometeors, such as
raindrops, above the 0 ◦ C level, creating a column of Zdr ≥ 1 dB at sufficient reflectivity (Zh ≥ 30 dBZ).
A Zdr column’s height is associated with updraft strength and storm intensity [36–38]. The freezing
of these hydrometeors at sub-freezing environmental temperatures eventually produces ice particles,
which may contribute to downburst formation. After identifying the 0 ◦ C isotherm height using
the KXMR sounding data, it was verified if a single gridded column had continuous Zdr values ≥
1 dB from this height upward. The maximum column top height was recorded as the storm’s Zdr
column height. A 30 dBZ Zh filter was applied to avoid erroneous updraft identification at the edges
of storms where positive Zdr values are also common. It is hypothesized that a higher maximum Zdr
column height would lead to a greater potential of precipitation ice production and hence downburst
occurrence at the surface through melting and loading of these hydrometeors.
The lifted liquid hydrometeors eventually freeze in the Zdr column’s upper boundary, serving as
embryos that can produce precipitation ice, such as graupel and hail [39]. The increase in precipitation
ice amount above the 0 ◦ C level is represented by both Signatures #2 and #3. Signature #2, also called
the precipitation ice signature [31], is a maximum height of the measured −1 dB ≤ Zdr ≤ +1 dB that
is co-located with Zh ≥ 30 dBZ [38,40]. Signature #3 is the maximum vertically integrated ice (VII),
which is a reflectivity-integrated signature to estimate the amount of precipitation ice between the
−10 ◦ C and −40 ◦ C isotherms in units of kg m−2 [41,42]. It is hypothesized that a higher vertical
extent of precipitation ice and a larger amount of reflectivity-integrated ice would indicate sufficientRemote Sens. 2019, 11, 826 6 of 17
precipitation ice growth in both size and quantity, as well as an increase in hydrometeor loading and
negative buoyancy. The VII expression is shown in the Equation (1).
Remote Sens. 2019, 11, x FOR PEER REVIEW 4 h(− Z 40C) 4 6 of 18
5.28 × 10⁻¹⁸ 7
3
7 7
VII = πρi N0 zh dh (1)
720as well as an increase
precipitation ice growth in both size and quantity, in hydrometeor loading and
h(−10C)
negative buoyancy. The VII expression is shown in the equation 1.
4 h(-40C)
-18 7
where ρi is the density of ice and N0 is the 3intercept 5.28×10parameter, assumed 4 to be equal to 917 kg m−3 and
6 − 4
VII = πρi N0 7 6
z3h 7 dh
−
(1)
4 × 10 m , respectively, zh is the linear reflectivity (in mm 720 m ), and h is the height of the specified
h(-10C)
isotherms
wherein ρi meters [41,42].
is the density of ice and N0 is the intercept parameter, assumed to be equal to 917 kg m-3 and
Signatures #4 and #5 zare
4×10 m , respectively,
6 -4 h isindirectly related to (in
the linear reflectivity themm
ice6 calculation.
m-3), and h isA higher
the heightaltitude of the peak
of the specified
isotherms #4)
Zh (Signature in meters [41,42].
and the ◦
peak Zh value above the 0 C isotherm (Signature #5) are associated with
the number Signatures #4 and #5 are indirectly
and concentration related to the
of hydrometeors ice calculation.
at high levels, which A higher
arealtitude
usuallyofassociated
the peak Zh with
(Signature #4) and the peak Zh value above the 0°C isotherm (Signature #5) are associated with the
precipitation ice loading that may produce negative buoyancy [23].
number and concentration of hydrometeors at high levels, which are usually associated with
Signatures #6–#8 are reflectivity-based parameters that consider the entire storm in their
precipitation ice loading that may produce negative buoyancy [23].
calculations. The number and concentration of all hydrometeor types are considered at all height levels
Signatures #6–#8 are reflectivity-based parameters that consider the entire storm in their
for these signatures.
calculations. The A largerand
number value for these three
concentration of allsignatures
hydrometeor is likely related
types are to larger
considered hydrometeor
at all height
loading and increased likelihood of downburst generation. Signature #6
levels for these signatures. A larger value for these three signatures is likely relatedh to is the peak Z in larger
the storm,
whichhydrometeor
can be at any height level, even below the of◦
0 C level. Similarly to Signature
loading and increased likelihood downburst generation. Signature #3, the
#6 is theVIL
peaksignature
Zh
(Signature #7) is which
in the storm, an integration
can be at anyof zheight
h through
level, the
even storm’s
below depth,
the 0°C as
level.shown
Similarlyin equation
to Signature 2 in
#3, units
the of
−2 [43].
kg mVIL signature (Signature #7) is an integration of zh through the storm’s depth, as shown in equation
Z
2 in units of kg m-2 [43]. 4
VIL = 3.44 × 10⁻⁶ zh 7 dh (2)
VIL = 3.44 × 10 z dh (2)
Signature #8 is Density of VIL (DVIL) in units of g m−3 , which is simply VIL/echotop, with echotop
being defined as the
Signature #8 storm’s
is Densitymaximum
of VIL (DVIL)18 dBZ Zh height
in units of g m-3in km [44].
, which is simply VIL/echotop, with echotop
Figure 3 highlights
being defined most ofmaximum
as the storm’s the aforementioned
18 dBZ Zh heightradar signatures
in km [44]. for a wind event that occurred
Figure 3 highlights most of the aforementioned radar signatures
on 09 June 2015. It consists of a Zdr vertical cross-section plot at the location for a wind event that occurred
marked with a black
on 09 June 2015. It consists of a Z dr vertical cross-section plot at the location marked with a black line
line in Figure 2. A Zdr column (Signature #1) can be seen as warm colors about 10 km east from the
radarincenter
Figureextending
2. A Zdr column (Signature #1)
approximately 1.5can
km be above
seen asthewarm colors
0◦ C about 10
isotherm km east
height, from the
which radar as
is marked
center extending approximately 1.5 km above the 0°C isotherm height, which is marked as a blue
a blue horizontal line. The precipitation ice signature (Signature #2) can be seen as Zdr ~ 0 dB (denoted
horizontal line. The precipitation ice signature (Signature #2) can be seen as Zdr ~ 0 dB (denoted by
by gray colors) co-located with Z ≥ 30 dBZ, shown as black contours. This signature reaches its
gray colors) co-located with Zhh ≥ 30 dBZ, shown as black contours. This signature reaches its
maximum
maximum height at 8.5
height kmkm
at 8.5 AGLAGL about
about11 11kmkmeast
east from radar.Other
from radar. Othersignatures,
signatures,
suchsuch as peak
as peak Zh and
Zh and
its height above
its height ground
above ground level, can
level, canalso
alsobebeinferred
inferred from thisplot.
from this plot.
Figure 3. Vertical
Figure cross-section
3. Vertical ofofZZdrdr (shaded)
cross-section andZhZ(black
(shaded) and h (black contour
contour every
every 10 from
10 dBZ, dBZ,10from
dBZ10 dBZ to
to 50
50 dBZ) at the location shown as ◦
dBZ) at the location shown black line in Figure 2. The horizontal blue line indicates the 0 °C 0 C
black line in Figure 2. The horizontal blue line indicates the
isotherm height.
isotherm height.Remote Sens. 2019, 11, 826 7 of 17
2.5. Random Forest
This study uses a Random Forest model for training and forecasting of wind events. Random
Forest is a tree-based method that combines multiple Decision Trees [45–48]. Decision Trees consist
of a series of splitting rules that stratifies observations into nodes, using predictors that best split
the observations. In our study, the radar signatures’ maximum values through a tracked storm’s life
cycle are used as inputs for the model, and classification trees are used to discriminate wind and null
events. Random Forests build hundreds of Decision Trees, each taking a different storm sample (about
two-thirds) from the total storm data set. Each Decision Tree built is a separate model, and the resulting
prediction among all trees is averaged to reduce variance, which is high for a single decision tree
because trees are not highly correlated. Also, Random Forest uses only a small sample of predictors as
split candidates in every tree node. Using a limited number of predictors as split candidates usually
yields even smaller errors than considering all predictors (the so-called bagged trees), and averaging
the resulting trees leads to an even larger reduction in variance.
In order to implement the Random Forest model, the R package Random Forest was used [49],
where 500 trees were built using the entire set of storms as the training dataset. Two predictors were
used as split candidates, consistent with the Random Forest default settings of using approximately
the square root of the total number of predictors available [46]. No separate testing dataset was
defined because it is possible to obtain the model’s error through the set of storms not used for tree’s
construction, called out-of-bag (OOB) storms. As previously mentioned, each tree uses approximately
two-thirds of the storm sample, which are randomly chosen. Storms not used to fit a given tree are
called out-of-bag observations. As a result, each storm was out-of-bag for approximately one-third
of trees. All trees’ predictions for a given OOB storm are counted and the majority vote among all of
these trees is considered as the Random Forest single prediction for that storm. For example, a vote
equal to 0.6 for a given storm means that 60% of trees predicted that storm to be a wind event, while
the other 40% predicted it to be a null event. The majority vote is considered as the Random Forest
prediction (i.e., the wind/null classification is made based on whichever classification receives a vote
greater than 0.5). This way, every storm has a wind/null prediction based on a model that used the
entire storm dataset for training, without the need for a testing dataset. It is shown in Section 2.5 that
this methodology is relevant and equivalent to an approach that applies a model using a separate
training and testing datasets.
A classification prediction is obtained for each storm and a summary of all storm predictions
can be displayed in a simple contingency table or confusion matrix, from which performance metrics
can be calculated [50]. The most intuitive metric for wind event predictability is the Probability of
Detection (POD), which is the number of correct wind event forecasts divided by the total number
of wind event observations. The Probability of False Alarm (POFA, same as false alarm ratio) is also
used in this study, which is the number of incorrect wind forecasts divided by the total number of
wind forecasts. The False Alarm Rate (F) is the number of incorrect wind forecasts divided by the total
number of null observations. F is important to define because it is an analog to the POD, since it is
a fraction of incorrectness of null events, while POD is fraction of correctness for the wind events. For
that reason, the TSS is the main metric used in this study to evaluate the predictability of a model, since
its formula can be simplified to the difference between POD and F. Thus, TSS is a simple and relevant
measure of model performance because it balances the wind and null events’ predictability equally
within the model, independent of the size of each dataset. A secondary metric used in this study for
Random Forest predictability is the OOB estimate of error rate, which is the number of incorrect wind
and null predictions divided by the total number of events. This is equivalent to 1-PC, where PC is the
Proportion Correct, or the sum of the number of correct wind and null predictions divided by the total
number of events. This metric differs from TSS, since each event, wind or null, is equally considered in
its computation. Because of this, if the size of a particular class (wind or null) is greater than the other,
this class would be weighted more heavily in the OOB estimate of error rate (or 1-PC) calculation.Remote Sens. 2019, 11, 826 8 of 17
2.6. Mean Decrease Accuracy and Mean Decrease Gini
Since Random Forest is a method that builds hundreds of trees for its model development, it is
not easy to determine the most important signatures that contributed most greatly to an increase in the
model performance. However, two methods that account for the signatures’ importance quantitatively
for all trees are available when running the model [46]. The Mean Decrease Accuracy (MDA) is
obtained by recording the OOB observation error for a given tree, and then the same is done after
permuting each signature from the tree. The difference between the two results is calculated, and
differences for all trees are obtained, averaged, and normalized by the standard deviation of the
differences. A large MDA value indicates that there was a significant decrease in model accuracy once
the signature was removed, indicating an important signature.
The Mean Decrease Gini (MDG) is the second method to obtain the signatures’ importance. The
Gini index is a measure of node purity, being small for a node with a dominant class (wind or null
classes are predominant for the OOB events that occurred at that given tree node). MDG is the sum of
the decrease in the Gini index by splits over a given signature for a tree, averaged over all trees. Similar
to the MDA, a large MDG value indicates an important predictor. Both variable importance methods
were calculated in order to evaluate the most important signatures for the Random Forest model.
2.7. Single Signature Predictability
A simple method to determine the predictability of each individual radar signature was performed
in order to compare with the Random Forest model results. The predictability of each signature in
Table 1 was tested by applying different thresholds for each signature and testing them for all wind
and null events. It was verified if a given threshold was observed before the downburst time for wind
events and at any time during the life cycle of null events. Through these methods, statistics were
obtained in a contingency table and performance metrics were calculated. The performance metrics
calculated were the same as presented in Section 2.5, with TSS being the primary metric used for
comparison of results between the single signatures and the Random Forest.
3. Results
3.1. Random Forest
Using the methods described in Section 2.3, a total of 84 wind events and 125 null events were
identified from the 2015 and 2016 warm seasons. Table 2 presents the Random Forest’s out-of-bag
confusion matrix, or contingency table, showing the number of correct and incorrect predictions
for all wind and null events. For wind events, the random forest model predicted 49 out of the
84 events correctly, leading to a POD of 58%. For null events, the model correctly determined 102 out
of 125 events. This means that 82% of null events were correctly depicted, or an F of 18% (note that
this is not the same as POFA). The Random Forest prediction of null events is noticeably better than
the prediction of wind events. In total, 58 out of all 209 events were incorrectly predicted, or an OOB
estimate of error rate of 28%. The POFA for the model is 32%. The resultant TSS for the Random Forest
model is 0.40, which is in the range of TSS values that are considered marginal for operational utility
by the 45WS (i.e., 0.3 to 0.5) [24].
The OOB votes for each storm can also be accessed from the Random Forest model. Votes are
the fraction of trees that predicted a given storm as a wind event, considering all trees that have not
used that storm for training. In a classification Random Forest, a storm with a vote greater than 0.5
is considered a wind event. In this way, votes may be interpreted as a qualitative ‘probability’ for
a storm to become a wind event. Figure 4 shows every storm’s maximum wind magnitude measured
by the Cape WINDS network in terms of its Random Forest vote. The vertical line depicts the wind
event threshold of 35 kt, separating wind events to the right and null events to the left of the chart.
The horizontal line at a vote equal to 0.5 determines the Random Forest’s wind and null classification
prediction above and below the line, respectively. The upper-right and the lower-left portions of theRemote Sens. 2019, 11, x FOR PEER REVIEW 9 of 18
Remote Sens. 2019, 11, 826 9 of 17
The OOB votes for each storm can also be accessed from the Random Forest model. Votes are
the fraction of trees that predicted a given storm as a wind event, considering all trees that have not
used
plot that storm
represent thefor training.
random In a classification
forest’s Random
correct predictions in Forest,
the same a storm
mannerwithas aTable
vote 2. greater than 0.5 is
The upper-left
considered
and a windsections
the lower-right event. In this way,
of Figure votes may
4 represent the be
falseinterpreted
alarms andasmisses
a qualitative ‘probability’
of the model, for a
respectively,
storm to become a wind event. Figure 4 shows every storm’s maximum wind
or the Random Forests’ incorrect predictions. In the lower-left quadrant, it can be seen that the correctmagnitude measured
by the Cape
negative events WINDS network and
are numerous in terms
spreadof out
its Random
over most Forest
of thevote. The vertical
quadrant area. Fewlinenull
depicts the were
events wind
event threshold
incorrectly of 35bykt,the
identified separating
Random Forestwind events
as windtoevents,
the rightas and null
can be events
seen in thetoupper-left
the left ofquadrant.
the chart.
AThe horizontal
significant line atofastorms
number vote equal to 0.5 determines
produced peak winds the Random
around 35 kt,Forest’s
which iswind
nearandthe null
windclassification
magnitude
prediction
threshold above
that and below
separated windthe line,from
events respectively. TheThe
null events. upper-right and the
Random Forest lower-left
model portions
struggled of the
to predict
plot represent the random forest’s correct predictions in the same manner
those borderline events as either wind or null, as evident by the wide range of vote values. If we as Table 2. The upper-left
and theevents
examine lower-right sectionspeak
that produced of Figure
winds 4between
represent
35 kttheand false alarms
40 kt, 38 outand
of 66misses
(58%) wereof the model,
correctly
respectively,
identified or theevents.
as wind Random Forests’
Storms incorrect
with predictions.
a maximum In the lower-left
wind magnitude greaterquadrant,
than 40 itktcanwerebe less
seen
that the correct negative events are numerous and spread out over most
numerous, but the Random Forest model classified them more correctly than events with peak winds of the quadrant area. Few
null events
between 35 ktwere
and incorrectly
40 kt. Eighteen identified
stormsby hadthewinds
Random Forest
greater thanas40wind
kt andevents, as can be
the Random seenmodel
Forest in the
upper-left
correctly quadrant.
classified Athese
11 of significant
as wind number
events,of orstorms produced
61%. Based on thesepeak windsit around
results, seems that 35 kt,
the which
POD ofis
near events
wind the wind magnitude
increased withthreshold
increasing that separatedstrength.
downburst wind eventsThisfrom null events.
corroborates withThe Randomfor
a tendency Forest
an
model struggled
increase of RandomtoForest predict those
votes withborderline
an increase events as either
in wind wind even
magnitude, or null,
withasthe
evident
presenceby the wide
of some
range of
outlier vote to
events values. If we examine events that produced peak winds between 35 kt and 40 kt, 38 out
this tendency.
of 66 (58%) were correctly identified as wind events. Storms with a maximum wind magnitude
greater than 40 kt were less Table 2. Random
numerous, forest
but out-of-bagForest
the Random confusion matrix.
model classified them more correctly
than events with peak winds between 35 kt and 40 kt. Eighteen Observation
storms had winds greater than 40 kt
and the Random Forest model correctly classified 11 of these as wind events, or 61%. Based on these
Null Wind
results, it seems that the POD of wind events increased with increasing downburst strength. This
corroborates with a tendency for an increase b = 23 Forest
Wind of Random a = 49votes with an increase in wind
Prediction
Null d = 102 c = 35
magnitude, even with the presence of some outlier events to this tendency.
Total 125 84
Figure 4. Random Forest vote for all events as a function of the observed maximum wind magnitude
inFigure
kt. The
4. vertical
Randomline depicts
Forest vote the wind
for all event
events asthreshold
a functionofof35
thekt.observed
The horizontal
maximum linewind
at a vote of 0.5
magnitude
specifies thevertical
in kt. The minimum linevote value
depicts thenecessary for the
wind event Random
threshold of Forest to predict
35 kt. The a storm
horizontal lineasata wind
a voteevent.
of 0.5
As such, the
specifies theupper
minimum(lower) left
vote quadrant
value can be
necessary forinterpreted
the Random as Forest
encompassing the
to predict incorrectly
a storm (correctly)
as a wind event.
forecasted null
As such, the events.
upper Similarly,
(lower) the upper
left quadrant (lower)
can right quadrant
be interpreted can be interpreted
as encompassing as including
the incorrectly the
(correctly)
correctly (incorrectly) forecasted wind events. More details can be found in the main text.
forecasted null events. Similarly, the upper (lower) right quadrant can be interpreted as including the
correctly (incorrectly) forecasted wind events. More details can be found in the main text.
The Mean Decrease Accuracy (MDA) and the Mean Decrease Gini (MDG) values for each signature
are shown in Table 3. A large MDA and MDG value indicates a high importance of the radar signature
The Mean Decrease Accuracy (MDA) and the Mean Decrease Gini (MDG) values for each
for the Random Forest. The two most important signatures were VII and peak Zh over the entire cell.
signature are shown in Table 3. A large MDA and MDG value indicates a high importance of the
VII is the signature with the highest MDG and second-highest MDA, while peak Zh over the entireRemote Sens. 2019, 11, 826 10 of 17
convective cell is the signature with the highest MDA and second-highest MDG. The two signatures
with the lowest MDA and MDG are the height of precipitation ice and the height of peak Zh , with the
latter yielding a negative MDA.
Table 3. Random Forest’s Mean Decrease Accuracy and Mean Decrease Gini for all radar signatures.
Signature Mean Decrease Accuracy Mean Decrease Gini
S#1: Height of Zdr column 10.73 12.55
S#2: Height of precipitation ice 5.39 10.34
S#3: VII 12.98 13.86
S#4: Height of peak Zh above 0◦ C −1.17 10.11
S#5: Peak Zh above 0◦ C 10.34 13.26
S#6: Peak Zh 14.58 13.56
S#7: VIL 8.18 12.85
S#8: DVIL 9.26 13.34
3.2. Single Signatures
The individual predictability for each of the eight signatures were computed by defining
thresholds for each signature and verifying if a signature value greater than that threshold occurred
at least once before a wind event’s downburst time and at any time during a null event’s life cycle.
This procedure was applied to all 209 storms, which is the same dataset used in the Random Forest
simulation. From these predictions of the wind and null events, a number of performance metrics
were obtained to evaluate each signature’s predictability over a range of physically realistic thresholds.
The main metric used for comparisons with the Random Forest simulations was TSS. The calculation
of 1-PC was also performed because it is equivalent to the Random Forest’s OOB estimate of error rate.
Lastly, the well-known POD and POFA were calculated as well.
Figure 5 shows the performance metrics for different thresholds for all eight radar signatures. As
expected, POD and POFA generally decrease as the signatures’ thresholds increase. The maximum
TSS observed for each signature was between 0.35 and 0.40 for six out of the eight signatures. The
highest TSS among all signatures and thresholds tested is 0.43, which was observed for a threshold of
52 dBZ for the peak storm Zh at any height (Signature #6, Figure 5f). This specific signature’s threshold
presented POD, POFA, and 1-PC values equal to 0.83, 0.42, and 0.31, respectively. The signature that
presented the smallest maximum TSS was the height of peak Zh (Signature #4, Figure 5d), which was
0.29 at a threshold of 1250 m above the 0 ◦ C isotherm height.
In general, the curves for 1-PC in Figure 5 have an approximate negative correlation to the TSS
curves, since a lower 1-PC value means a better prediction, while for TSS a larger value indicates
a better prediction. For signatures S#1 and S#8, the minimum 1-PC is found at the same signature
threshold as the maximum TSS. For the Zdr column signature (S#1), the maximum TSS and minimum
1-PC occurs for a threshold of 2750 m (TSS of 0.36 and 1-PC of 0.27), but this threshold presented an
undesirable POD smaller than 50% (POD of 0.43). The Signature #8 DVIL has a maximum TSS of 0.39
and a minimum 1-PC of 0.26 for a threshold of 1.9 kg m−2 , but its POD is also lower than 50% (POD
of 0.49).
VII signature (S#3) presents maximum TSS and minimum 1-PC for the same threshold of 4 kg
m−2 , in which TSS is 0.40 and 1-PC is 0.29. However, other thresholds of 4.5 and 5.5 kg m−2 have
the exact same minimum 1-PC, but these thresholds have lower TSS, POD, and POFA (Figure 5c).
For the other five signatures (S#2, S#4–S#7), the minimum 1-PC occurs at higher thresholds than the
maximum TSS, which resulted in lower TSS, POD and POFA for the thresholds with the minimum
1-PC. In addition, VIL (S#7) presented more than one threshold with the same minimum 1-PC value,
with 16 and 17 kg m−2 having 1-PC equal to 0.27.Remote Sens. 2019, 11, 826 11 of 17
Remote Sens. 2019, 11, x FOR PEER REVIEW 11 of 18
Figure 5. POD, POFA, TSS, and 1-PC for the single signatures prediction for different thresholds
Figure 5. POD, POFA, TSS, and 1-PC for the single signatures prediction for different thresholds
applied. The optimal value for POD and TSS is 1, and for POFA and 1-PC is 0. Radar signatures are:
applied. The optimal value for POD and TSS is 1, and for POFA and 1-PC is 0. Radar signatures are:
(a) Zdr column maximum height; (b) Precipitation ice signature maximum height; (c) VII; (d) Height of
(a) Zdr column maximum height; (b) Precipitation ice signature maximum height; (c) VII; (d) Height
peak Zh above the 0◦ C isotherm level; (e) Peak Zh above the 0◦ C isotherm level; (f) Peak Zh within the
of peak Zh above the 0°C isotherm level; (e) Peak Zh above the 0°C isotherm level; (f) Peak Zh within
storm; (g) VIL; (h) DVIL.
the storm; (g) VIL; (h) DVIL.
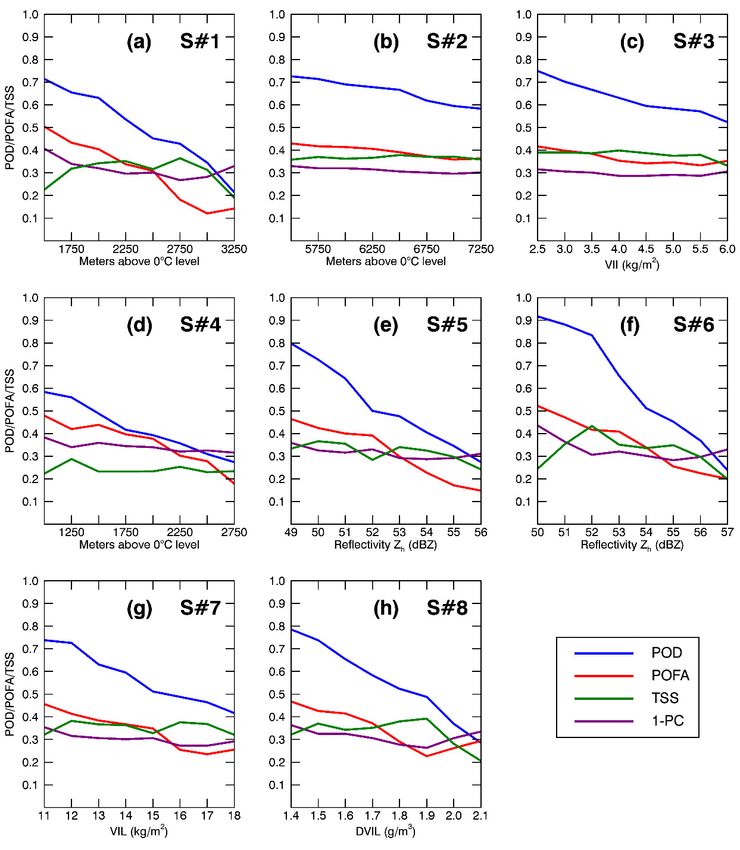
The maximum TSS for each signature is shown in Figure 6, which is organized in terms of POD,
In general, the curves for 1-PC in Figure 5 have an approximate negative correlation to the TSS
POFA, and TSS. TSS increases toward the top left of the plot and is negative (i.e., worse than a random
curves, since a lower 1-PC value means a better prediction, while for TSS a larger value indicates a
forecast) to the right of POFA equal to 0.6. As previously mentioned, two signatures had maximum
better prediction. For signatures S#1 and S#8, the minimum 1-PC is found at the same signature
TSS for thresholds with POD of less than 0.5. The other six signatures presented a maximum TSS for
threshold as the maximum TSS. For the Zdr column signature (S#1), the maximum TSS and minimum
thresholds with POD of greater than 0.5, but with a relatively high POFA around 0.4.
1-PC occurs for a threshold of 2750 m (TSS of 0.36 and 1-PC of 0.27), but this threshold presented an
undesirable POD smaller than 50% (POD of 0.43). The Signature #8 DVIL has a maximum TSS of 0.39
and a minimum 1-PC of 0.26 for a threshold of 1.9 kg m−2, but its POD is also lower than 50% (POD
of 0.49).
VII signature (S#3) presents maximum TSS and minimum 1-PC for the same threshold of 4 kg
m-2, in which TSS is 0.40 and 1-PC is 0.29. However, other thresholds of 4.5 and 5.5 kg m−2 have the
exact same minimum 1-PC, but these thresholds have lower TSS, POD, and POFA (Figure 5c). Forwith 16 and 17 kg m-2 having 1-PC equal to 0.27.
The maximum TSS for each signature is shown in Figure 6, which is organized in terms of POD,
POFA, and TSS. TSS increases toward the top left of the plot and is negative (i.e., worse than a random
forecast) to the right of POFA equal to 0.6. As previously mentioned, two signatures had maximum
TSS for thresholds with POD of less than 0.5. The other six signatures presented a maximum TSS
Remote Sens. 2019, 11, 826
for
12 of 17
thresholds with POD of greater than 0.5, but with a relatively high POFA around 0.4.
Figure 6. TSS for the radar signatures’ threshold with maximum TSS (contours), presented in terms
Figure 6. TSS for the radar signatures’ threshold with maximum TSS (contours), presented in terms
of POD and POFA. Radar signatures are S#1: Zdr column maximum height; S#2: Precipitation ice
of POD and POFA. Radar signatures are S#1: Zdr column maximum height; S#2: Precipitation ice
signature maximum height; S#3: VII; S#4: Height of peak Zh above the 0◦ C isotherm level; S#5: Peak
signature maximum height; S#3: VII; S#4: Height of peak Zh above the 0°C isotherm level; S#5: Peak
Zh above the 0◦ C isotherm level; S#6: Peak Zh within the storm; S#7: VIL; S#8: DVIL.
Zh above the 0°C isotherm level; S#6: Peak Zh within the storm; S#7: VIL; S#8: DVIL.
4. Discussion
4. Discussion
Random Forest OOB prediction for wind and null events presents better performance metrics
than Random
most of the Forest OOB
single prediction
signatures’ for wind and
predictions, null events
as described presents3.2.
in Section better performance
Random metrics
Forest correctly
than most of the single signatures’ predictions, as described in Section 3.2. Random
depicted 58% of wind events and 82% of null events, leading to an overall correct prediction of 72% for Forest correctly
depicted
all events.58%
In thisof wind
study,events
the mainandperformance
82% of null metric
events,used
leading to an overall analysis
for predictability correct prediction
is the TSS,of 72%
which
for all events. In this study, the main performance metric used for predictability
weighs each storm category (winds and nulls) equally. In the TSS equation, half of its formulation analysis is the TSS,
which from
comes weighsthe each
windstorm
events’category (winds(a/(a+c);
predictability and nulls) equally.
see Table In thethe
2), while TSS equation,
other half of the
half considers its
formulation comes from the wind events’ predictability (a/(a+c); see Table
null events’ predictability (b/(b+d)). In this way, the TSS equation is independent of how much larger2), while the other half
aconsiders the nullisevents’
given category compared predictability
to the other. (b/(b+d)).
The otherIn this way, the TSS
performance metric equation
used inisthis
independent
study is the of
how much
Random largerOOB
Forest’s a given category
estimate is compared
of error rate, or 1-PCto the
for other.
single The other predictions.
signature performanceThese metric used in
equations
this study is the Random Forest’s OOB estimate of error rate, or 1-PC for single
are represented by the sum of all storms incorrectly predicted divided by the total number of events. signature predictions.
Thesemeans
This equations are represented
that every by the considered
storm is equally sum of all storms incorrectly
independently of predicted
whether itdivided
is a wind by or
thea total
null
number of events. This means that every storm is equally considered independently
event. In this study, since the null dataset comprises almost 60% of our entire dataset, the TSS weights of whether it is
a wind or a null event. In this study, since the null dataset comprises
wind events more heavily in its calculation compared to the OOB estimate of error rate. almost 60% of our entire dataset,
the TSS
Theweights
Randomwind events
Forest’s TSSmore heavily
of 0.40 in its
is larger thancalculation
most of thecompared to the OOB
single signatures’ estimate
best TSS. The of error
only
rate.
single signature threshold that had a larger TSS than the Random Forest OOB estimate is the maximum
Zh overThethe
Random Forest’s
entire storm TSS of 0.40
(Signature is larger
#6) using the than
52 dBZ most of the single
threshold. signatures’threshold
This signature’s best TSS.presented
The only
asingle signature
TSS equal to 0.43 threshold
due to itsthat had a high
relatively largerwind
TSS event
than predictability
the Random Forest (POD of OOB
0.83).estimate
However, is the
its
maximum Z h over the entire storm (Signature #6) using the 52 dBZ threshold. This signature’s
null event predictability is worse than the Random Forest model, since it only predicted 60% of these
events correctly. Therefore, the F and the POFA were 0.40 and 0.42, respectively. Thresholds smaller
than 52 dBZ showed higher F, while thresholds greater than 52 dBZ presented smaller POD, with
both patterns leading to smaller TSS as shown in Figure 5f. In contrast to this single radar signature,
the Random Forest model results show much better prediction for null events but a poorer wind
event prediction, leading to a slightly lower TSS. The single parameter approach is simpler to apply
operationally but it does not contrast null events to the wind events as well as the multi-parameter
Random Forest model. Also, a 1 dB variation from this signature threshold leads to a lower TSS than
Random Forest results, which is within the Zh measurement error. Hence, the Random Forest model isRemote Sens. 2019, 11, 826 13 of 17
preferred due to it being a more robust model in comparison to the simpler single signature approach.
However, the user should consider taking into account whether the wind detection is preferred over
incorrect null event detection, or if a low F is more important for operational applications.
A VII threshold of 4 kg m−2 presented the exact same TSS as that of the Random Forest
multi-parameter model results. However, this signature’s POD and POFA are slightly larger (0.63
and 0.35) than those of the Random Forest. Similar to the Signature #6 case, a small variation of only
0.5 kg m−2 in the VII threshold produces poorer TSS than the Random Forest model. The other six
signatures present lower TSS values than the Random Forest, which indicates a worse balance between
wind detection and F. As shown in Figure 6, these signatures have high POFA (greater than 0.39) or
low POD (lower than 0.49).
The Random Forest OOB estimate of error rate is 28%, which is the percentage of total events
(winds and nulls) incorrectly predicted. As stated previously, this metric takes into account null events’
performance more than wind events’ simply because of null events comprising a larger percentage
of the total dataset than wind events. The Random Forest model depicted null events with greater
skill than wind events; therefore, this metric generally presents better results than single signature
predictions. As shown in Figure 5, single signatures present their minimum 1-PC at higher thresholds
than their maximum TSS. This is due to the low F these thresholds present, which is related to the fact
that the null events’ predictability has greater importance for this performance metric. The signature
threshold associated with this minimum 1-PC also presents lower POD, since 1-PC weighs wind event
predictability less than TSS does. This is the primary reason why Random Forest OOB estimate of
error rate has better results (i.e., a lower value) than five single signatures’ best 1-PC threshold. The
five signatures with a 1-PC poorer than the Random Forest model are S#2-S#6. The three signatures
that presented better 1-PC values than the Random Forest model yielded their strongest 1-PC value at
a threshold that also presented a POD lower than 50%, which is undesirable.
The MDA and MDG calculated for all radar signatures (Table 2) indicated that VII and peak
Zh were the most important signatures for the Random Forest model. Most of the other signatures
also presented positive values, indicating they contributed to an improved discrimination between
wind and null classes. The height of the peak Zh (Signature #4) was the only signature that presented
a negative MDA. To examine potential effects this signature may have on the performance of the
Random Forest model, an additional Random Forest run was performed using only seven of the
original signatures, removing Signature #4. Resultant predictions showed slightly worse performance
metrics than the original model run, with POD, POFA, and TSS equal to 0.57, 0.34, and 0.37, respectively,
and positive MDA and MDG for all signatures. This implies that removing signatures is not required
and even causes a reduction in Random Forest model performance.
An earlier study [31] explored downbursts at CCAFS/KSC using the same Cape WINDS tower
data and some of the same storms used in this study, but with a smaller dataset. They used similar
signatures and analyzed performance metrics from signature thresholds by visual, subjective analysis,
in contrast to this study, which used a semi-automated objective analysis (i.e., storms were manually
tracked and radar signatures were calculated automatically). The prior study [31] assessed five
dual-polarization radar signatures, three of which are coincident with this study: height of the Zdr
column, height of the precipitation ice signature, and peak Zh . The results from the Random Forest
and objective single signature analyses herein are compared with the results from the subjective single
signature analyses in [31] in the following paragraphs.
The Zdr column signature visually identified in [31] presents better results than the semi-
automated single signature method and Random Forest model herein. For any given threshold,
ref. [31] shows larger POD and TSS and smaller POFA than the semi-automated single signature
approach. For example, for 2000 m above the 0 ◦ C level, [31]’s POD, POFA, and TSS values are 0.84,
0.21, and 0.63 respectively, while for the semi-automated single signature analysis, these performance
metrics are 0.63, 0.40, and 0.34, respectively. In [31], the Zdr column threshold with highest TSS is
2500 m, while for the semi-automated single signature the threshold with the highest TSS is 2750 m.You can also read