Conversion of natural forests to farmlands and its associated woody species diversity and carbon stocks in a span of 33 years (1984 to 2016): in ...
←
→
Page content transcription
If your browser does not render page correctly, please read the page content below
F1000Research 2021, 10:227 Last updated: 09 AUG 2021

RESEARCH ARTICLE

Conversion of natural forests to farmlands and its associated
woody species diversity and carbon stocks in a span of 33
years (1984 to 2016): in the case of southwestern Ethiopia
[version 1; peer review: 1 not approved]
Tamiru Kefalew             1,   Mulugeta Betemariyam                  1,   Motuma Tolera2
1Forestry, Madda Walabu University, Bale Robe, Oromia, 247, Ethiopia
2Hawassa University, Wondo Genet College of Forestry and Natural Resources, Shashemene, 128, Ethiopia

v1   First published: 22 Mar 2021, 10:227                                     Open Peer Review
     https://doi.org/10.12688/f1000research.28336.1
     Latest published: 22 Mar 2021, 10:227
     https://doi.org/10.12688/f1000research.28336.1                           Reviewer Status

                                                                                                     Invited Reviewers
Abstract
Background: Gura-Ferda forest is one of the Afromontane rainforests                                           1
in the southwestern region of Ethiopia. However, since 1984, large
parts of this forest have become increasingly disturbed and                   version 1
fragmented due to forest conversion into forest farm interface and            22 Mar 2021                   report
farmlands. The study was conducted to assess changes of woody
species diversity and carbon stock in association with the conversion
                                                                               1. Arshad Ali    , Nanjing Forestry University,
of natural forest to forest farm interface and farmlands.
Methods: Data were collected from natural forest, forest farm                    Nanjing, China
interface and farmland which are historically forest lands before 1984.
                                                                              Any reports and responses or comments on the
A total of 90 nested plots (20m×20m for natural forest and forest farm
interface; 50m*100m for farmland)) were established for inventory of          article can be found at the end of the article.
woody species. Three 1m×1m subplots were established to collect
litter and soil samples. A total of 180 soil samples were collected. The
total carbon stocks were estimated by summing carbon stock in the
biomass and soil (0-60 cm depth).
Results: Results showed that Shannon-Wiener diversity (H’) in forest
farm interface (H’ = 1.57) is relatively lower than that of natural forest
(H’ = 3.33) but higher than farmland (H’ = 1.42). The total carbon stocks
of natural forest were approximately 1.21 and 2.54 times higher than
that of forest farm interface and farmland.
Conclusion: Our study revealed that the changes of Natural Forest to
Forest Farm Interface and Farmland have effects on the diversity of
woody species and carbon stocks.

Keywords
Forest Farm Interface, Biomass Carbon, Soil Organic Carbon, Litter

                                                                                                                       Page 1 of 14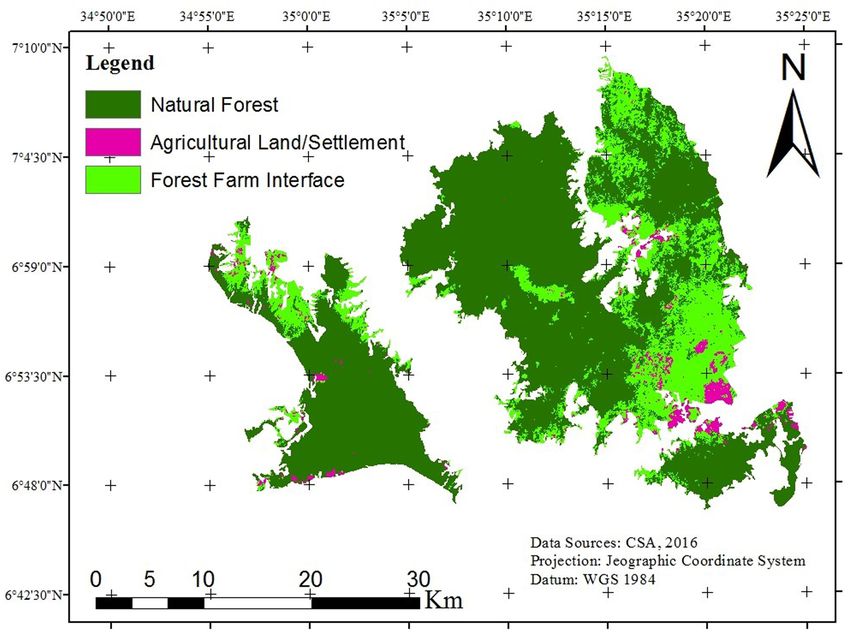
F1000Research 2021, 10:227 Last updated: 09 AUG 2021

               This article is included in the Climate Action
               gateway.

               This article is included in the Agriculture, Food
               and Nutrition gateway.

Corresponding author: Mulugeta Betemariyam (fgelila86@gmail.com)
Author roles: Kefalew T: Conceptualization, Data Curation, Methodology, Writing – Original Draft Preparation; Betemariyam M: Formal
Analysis, Investigation, Methodology, Software, Visualization, Writing – Original Draft Preparation, Writing – Review & Editing; Tolera M:
Formal Analysis, Funding Acquisition, Supervision
Competing interests: No competing interests were disclosed.
Grant information: This study was funded by Centre for International Forestry Research (CIFOR) and Ministry of Higher Education and
Technology Transfer in Ethiopia
The funders had no role in study design, data collection and analysis, decision to publish, or preparation of the manuscript.
Copyright: © 2021 Kefalew T et al. This is an open access article distributed under the terms of the Creative Commons Attribution
License, which permits unrestricted use, distribution, and reproduction in any medium, provided the original work is properly cited.
How to cite this article: Kefalew T, Betemariyam M and Tolera M. Conversion of natural forests to farmlands and its associated
woody species diversity and carbon stocks in a span of 33 years (1984 to 2016): in the case of southwestern Ethiopia [version 1;
peer review: 1 not approved] F1000Research 2021, 10:227 https://doi.org/10.12688/f1000research.28336.1
First published: 22 Mar 2021, 10:227 https://doi.org/10.12688/f1000research.28336.1

                                                                                                                                 Page 2 of 14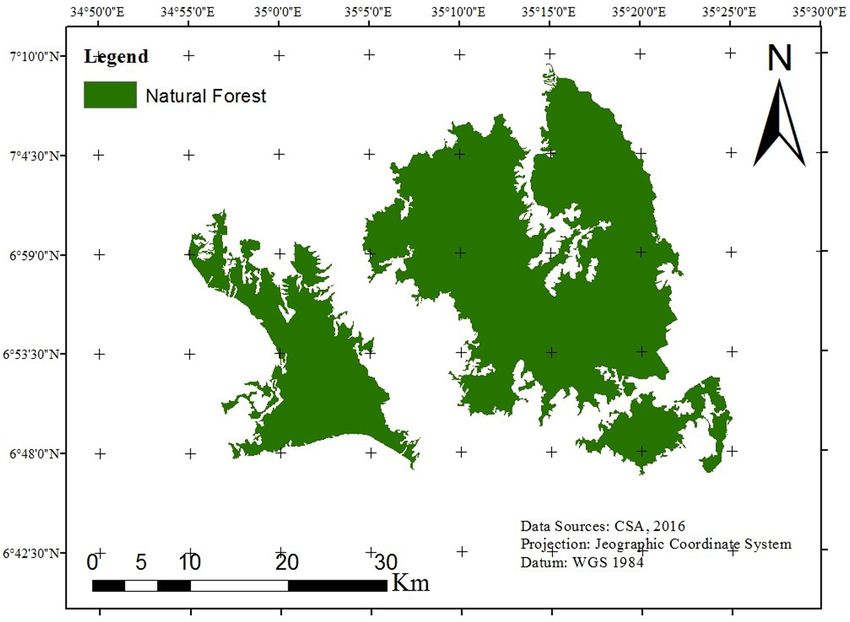
F1000Research 2021, 10:227 Last updated: 09 AUG 2021
Introduction have been implemented in different parts of the country to
Forests and forest management have changed greatly over the reverse deforestation and forest degradation in the country.
past two decades. In 1990, the world had 4.13 billion hectares However, the success stories were below expectations and the
(ha) of forests (31.6% of total land area of Earth). However, problems are still immense. This resulted from the lack of
according to the Food and Agriculture Organization of the United effective management practices and quantification of the avail-
Nations, by 2015 this area has decreased to 3.99 billion ha able forest resources. This insufficiency of scientific quantitative
(30.6% of total land area of Earth) (FAO, 2015). This caused a data brought lack of responsiveness for sound management
net loss of 129 million ha of forests (natural and planted) from of natural resources in the country.
1990 to 2015. However, the net annual rate of loss has reduced
from 0.18% in the 1990 to 0.08% in 2015. The net annual Gura-Ferda forest is one of the Afromontane rainforests in the
natural forest loss between 1990 to 2000 was 8.5 million ha per southwestern region of Ethiopia and grows at altitudes from
year; however, from 2010 to 2015, natural forest decreased 700 to 2,300 meter above sea level. This forest area is one of
by a net of 6.6 million ha per year (8.8 million ha of loss the areas in Ethiopia where traditional beliefs and ecological
and 2.2 million ha of gain). This resulted in a reduction of knowledge have assisted the conservation of forests up to now.
697 million mega tons per year or about 2.5 gigaton (GT) During the past decades, especially since 1984, large parts of
of carbon dioxide (CO2) for the past 25 years (FAO, 2015). this forest have progressively been disturbed and fragmented
The world forest assessment in 2015 also indicated that due to forest conversion to settlements, agriculture, and indus-
world’s forests store an estimated 296 GT of carbon in both trial plantation (Schmitt et al., 2010). Nowadays, pressure
aboveground and belowground biomass (FAO, 2015). produced by immigration and investors is increasing forest
disturbance. However, there is no quantitative information on
Ethiopia has a wide range of ecological conditions ranging the change of species diversity and carbon stocks resulting from
from the arid lowland in the East to high altitudes in the central the conversion of natural forests to forest farm interface and
high lands (Hurni, 1998). This wide range of ecological condi- farmlands. The overall objective of this study was, therefore, to
tions coupled with the corresponding heterogeneous flora and analyze the woody species diversity and carbon stock change in
fauna has made the country one of the internationally recog- association with the change of natural forests to forest farm
nized major centers for biodiversity (Scholte, 2012). However, interface and farmlands. The study hypothesized that, the
through time to time, there has been a dramatic decline in conversion of natural forests to forest farm interface and
forested area in the country. Accordingly, from 1990 to farmlands affect the woody species diversity, biomass and soil
2000 and from 2000 to 2010, forest losses were estimated at organic carbon (SOC) stocks.
8.3 million ha and 5.2 million ha respectively (Eshetu, 2014).
These days major parts of the remaining natural forests Methods
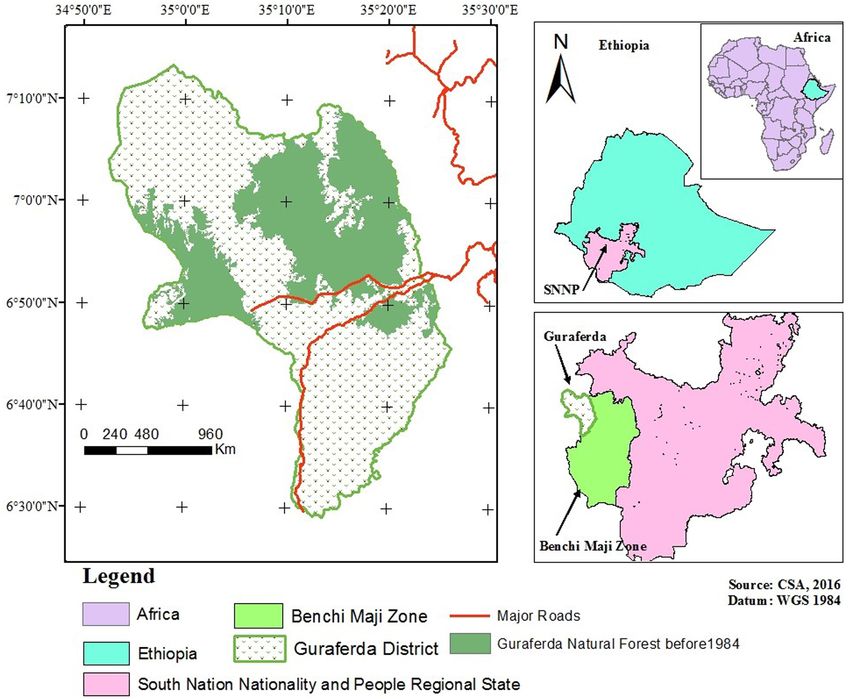
which harbor high biodiversity are located on steep slopes at Description of the study area
high altitude and in the remote southern and southwestern The study was conducted at Gura-Ferda district of
parts of the country. These few remaining high forests are also southwestern Ethiopia which is located at 603 km southwest
threatened by anthropogenic activities and converted to agri- of the capital city Addis Ababa (Figure 1). Geographically, it
cultural and other land use systems (Abere, 2011). Similarly, is positioned between 6°29’12” N and 7°13’22” N latitude and
other remaining natural forests have also been threatened by 34°52’23” E and 35°23’59” E longitude. The area coverage of
pressure from investors and changed to industrial plantation this district is estimated to be 2565.42 km2. The annual aver-
like coffee and tea (Abere, 2011; Moges et al., 2010). This reduc- age rainfall over the period of 1983–2012 was 1639.8 mm,
tion and conversion of natural forest to other land use systems with a maximum of 1946.3 mm and a minimum of 1289.8mm.
in many parts of Ethiopia has led to the decline in number and The area receives a maximum rainfall in October and mini-
distribution of many plant species, shortage of raw materials mum rainfall in February. The average annual temperature is
for wood processing industries and disturbance of ecosystem 23.4°C with a range from 16.1°C-30.6°C. The dominant soil type
services (Lemenih & Kassa, 2014). Subsequently, it has resulted of the study area is nitisols with soil textural class loam to clay
the expansion of forest farm interface in and around the forest (Dewitte et al., 2013).
ecosystem.
“For this study forest farm interface is defined as a As the past data of the Gura-Ferda district specified, since
complex geographic and temporal mosaic landscape 1984, there was a degradation of natural forest in the area
of integrated management and production practices (Table 1). The notable drivers of this forest area decrement
that combine agriculture, forest and livestock land were resettlement, crop investment and fuel wood. Accord-
uses and formed from shifting of forest land uses by ing to the office of Gura-Ferda district, in 1984, the populations
smallholder farmers and /or investors. The interface of the district were 149. However, in 2016 they were increased
is not a discrete line separating farms and forests.” to 45,028 (GFDAO, 2016). Moreover, during 2003/4 legal
(CIFOR, 2017) resettlement, massive deforestation of natural forest were
accompanied for house construction of immigrates (Abere,
For the past five decades, the government of Ethiopia has 2011; Gessese, 2018). Next to resettlement, the taken up of for-
attempted to reforest degraded forests. Hundreds of aid projects est by investors is other key drivers for the degradation and
Page 3 of 14
F1000Research 2021, 10:227 Last updated: 09 AUG 2021

Figure 1. The nested map of Ethiopia showing the map of study region and zonal map of the study district.

Table 1. Converted area from natural forest to forest farm        and rubber tree plantation. These investors had been used
interface and farmland within the span of 33 years (1984          shrub land, natural forest, and grass lands for investment.
and 2016).
                                                                  Methodology
 Land Use Class          1984    Area (%)   2016    Area (%)
                                                                  Data source
                                                                  For the purpose of this research both primary and secondary
 Natural Forest          90872   100        67049   73.78         data were employed. Primary data were obtained through field
                                                                  survey of the study area. Secondary data used were satellite
 Forest Farm Interface   -       -          21155   23.28
                                                                  images and publications such as articles, data from district land
 Farmland/Settlement     -       -          2668    2.94          administration offices and censuses results. Multi-sensor and
                                                                  multi-temporal Landsat images were downloaded from United
 Total                   90872   100        90872   100
                                                                  States Geological Survey (USGS) (https://earthexplorer.usgs.gov)
Source (Authors Data)
                                                                  (Table 2). Accordingly, satellite images of 1984 and 2016 were
                                                                  used for this study. Images of the year 1984 were taken because
                                                                  it was the time when the government organized a resettlement
deforestation of natural forests in the area. According to        program at the study area. Similarly, images from the year
(GFDAO, 2016), there were more than 30 investors who were         2016 was selected because it was the time when recent agricul-
involved in different agricultural investment especially coffee   tural systems were expanded and government was focused on

                                                                                                                         Page 4 of 14
F1000Research 2021, 10:227 Last updated: 09 AUG 2021

commercial investments in the area. Since it is a time of                              and production practices which is typically used by
free atmospheric cloud, satellite images in the months of                              smallholder farmers/investors and found between
December to January were used.                                                         natural forest and farmlands (find full definition in the
                                                                                       introduction).
Stratification of study area                                                       •	Farmland (FL): an area which has been converted
Before the resettlement program of 1984, all areas used for                           to intensive mono cropping with few/no scattered
the sampling unit in this study time were covered by forest.                          trees due to high disturbance and adjacent to FFI.
However, nowadays, it is observed that the area has three dis-
crete categories. These are: natural forest, forest farm interface          Sampling techniques
and farmland (Figure 2; Figure 3).                                          Field level data was collected from NF, FFI and FL which
    •	Natural forest (NF): a landform consisting of trees,                 are adjacent to each other and historically forest land before
       shrubs and other vegetation that originally emerged                  1984. With the help of a compass and Geographic Positioning
       on its own without the influence or direct intervention              System (GPS), three transects with a total of 30 plots (10 plots
       of man and found adjacent to FFI.                                    on each transect) were established for each land use sys-
                                                                            tem. Transect lines and samples plots were laid by a gap of
    •	Forest-farm interface (FFI): a neither agriculture                   200m from each other (Figure 4). The sample plot size was
       nor forest mosaic landscape of integrated management                 determined based on expected density of woody species in

                 Table 2. Time series satellite images of the study area.

                  Acquisition      Path/Row       Cloud         Sensor      Spatial            LU/LCC related events
                     date                         cover (%)     type        resolution (m)

                  28/12/1984       170/055        0.0           TM          30x30              Government Organized
                                                                                               Resettlement Program

                  26/12/2016       171/055        0.0           OLI/TIRS    30x30**            Recent Agricultural Expansion
                                                                                               and focusing of government
                                                                                               on commercial investments
                 ** Panchromatic sharpened to 15m to favor visual interpretation

Figure 2. map of Natural Forest of Gura-Ferda district in 1984 (Source: Authors).

                                                                                                                                     Page 5 of 14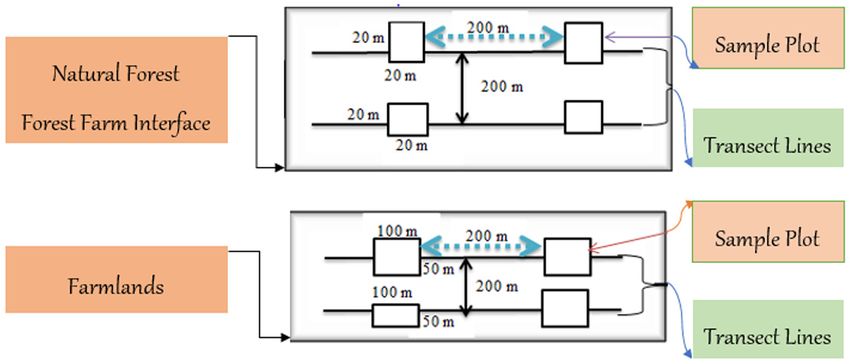
F1000Research 2021, 10:227 Last updated: 09 AUG 2021

Figure 3. map of Natural Forest, Forest Farm Interface and Farmlands of Gura-Ferda district in 2016 (Source: Authors).

Figure 4. Sampling design of woody species in in the studied land use systems of Gura-Ferda district.

each land use system (Tadesse et al., 2014; Tolera et al., 2008).     plots, the diameter and height of all woody species ≥ 5cm
Accordingly, for both NF and FFI a nested plot design of              DBH were measured. As per density and distribution of woody
400m2 with 25m2 and 1m2 size was used to collect vegeta-              species is lower, plot size of 50 m x 100 m was used for FL
tion data (tree, sapling and seedling respectively). In each of the   (UNFCCC, 2015).
quadrat (1m*1m), a number of all seedlings that have eight
≤ 50 cm and diameter at breast height (DBH) ≤ 2.5cm were              DBH of sampled dead wood was measured following the
recorded. Individuals attaining height > 50cm and DBH ≤ 2.5 cm        techniques used by Pearson et al. (2005) and UNFCCC (2015).
were considered as sapling and counted. In the 400m2 sample           A complete list of woody species was made for each plot

                                                                                                                           Page 6 of 14
F1000Research 2021, 10:227 Last updated: 09 AUG 2021
throughout the whole area and documented by local name. Spe- NF (Table 3). Biomass of standing dead wood which has
cies identification for common species was done in the field branches was also estimated using this allometric equation.
via different plant identification keys. However, for the less This equation was selected since it was established for estimat-
common species plant sample specimens were pressed and ing the biomass of woody species in tropical natural forests.
identified at the National Herbarium of Ethiopia, Addis Ababa Moreover, this equation used diameter at breast height and
University. Litter samples were collected from 1 m x 1 m sub- wood density which was the most important biomass predictor
plot within the main plot. The collected fresh litter was weighed variables. The biomass of woody species in FFI and FL was
right on the site. Then the evenly mixed samples were taken estimated using allometric equation developed by Kuyah et al.
to the laboratory and oven dried at 65ºC for 24 hours to (2012a); Kuyah et al. (2012b) since it was developed for land
determine dry to fresh weight ratio. Soil samples were col- use systems having more or less similar climatic properties as
lected from the sub-plots used for litter sampling. Two sets of those in the current study area. Woody density was taken from
soil samples were taken, one set for the determination of the document of Ethiopia’s fForest reference level submis-
organic carbon fraction (%C), and one set for the determination sion to the United Nation Framework Convention on Climate
of soil bulk density. A total of 90 soil samples (layers of 0–30 Change (UNFCCC) (EFRLS, 2016).
and 30–60 cm) were collected for %C analysis using soil auger.
In addition, similar size of undisturbed soil samples were Aboveground biomass of standing dead wood which has no
collected separately for determination of soil bulk density. leaves was estimated following the procedure used by Pearson
et al. (2005). The biomass of felled dead wood was estimated
Data analysis using allometric equation developed by Grais & Casarim
Diversity analysis. Shannon-Wiener index (H`) was used to (2013). The total biomass of the dead wood was estimated by
determine diversity of woody species of the study area. H` was summing up of the standing, logged and felled dead wood.
determined through the analysis of two components of species Finally, estimated biomass of woody tree species in NF, FFI and
diversity. These are the species richness (the number of spe- FL were converted to carbon (C) stock using carbon fraction
cies in the sample plots) and evenness of species (abundance value of 0.5, 0.48, and 0.48 respectively (IPCC, 2006; Kuyah
distribution among species). et al., 2012a). The loss on ignition method was used to esti-
mate percentage of organic matter in the litter. The amount of
H ′ = ∑ i =1 Pi ln Pi
S
(1) C in the litter was estimated through multiplying of litter
organic matter by 0.50 (Pearson et al., 2007).
Where pi, is the proportion of individuals found in the ith species
Soil organic carbon stock estimation. Soil analyses were
Beta diversity (β) which measures the change in the diver- undertaken at Wondo Genet College of Forestry and Natural
sity of species among a set of land uses is determined using the Resources soil laboratory. The soil samples for bulk density were
formula provided by Whittaker (1972). oven-dried at 105 °C for 48 hours. Bulk density was estimated
b+c by the core method (Blake & Hartge, 1986). The soil samples
β= (2) for %C were air –dried and analyzed using Walkley-Black
2a + b + c
method (Schnitzer, 1982). A SOC stock (Mg C ha-1) was cal-
Where a, is the number of shared species in two land uses, and culated by multiplying of %C, bulk density (g/cm3) and soil
b and c are the numbers of species unique to each land use. depth (cm)).
Biomass carbon stock estimation Total carbon stocks. Total C stock (Mg C ha-1) was calculated
Allometric equation developed by Chave et al. (2014) was used by summing up of biomass C stocks (above-and-below) and
for estimating the aboveground biomass of woody species in SOC stocks.
Table 3. Allometric equations used to estimate the biomass carbon stocks of natural forest,
forest farm interface and farmlands in Gura-Ferda district, southwestern Ethiopia.
Land Use Equation R2 D (cm) % C Source
Natural Forest Woody AGB = ρ × d × H × 0.0559
2
- ≥5 50 (Chave et al., 2014)
species BGB = 0.20 × AGB - ≥5 50 (IPCC, 2006)
Forest Farm Woody AGB = 0.225 × d2.341 × ρ0.73 0.98 ≥5 48 (Kuyah et al., 2012a)
Interface species BGB = 0.28 × AGB - ≥5 48 (Kuyah et al., 2012b)
Farmlands Woody AGB = 0.225 × d2.341 × ρ0.73 0.80 ≥5 48 (Kuyah et al., 2012a)
species BGB = 0.28 × AGB - ≥5 48 (Kuyah et al., 2012b)
Page 7 of 14F1000Research 2021, 10:227 Last updated: 09 AUG 2021
Statistical analysis Table 5. Pair wise comparison of Sorensen’s
C stock of the three land uses were compared using one-way similarity coefficient and beta diversity index in
ANOVA and two-way ANOVA. All data were checked for species composition among Natural Forest, Forest
normality prior to doing the analysis of variance using Kol- Farm Interface and Farm Land in Gura-Ferda
mogorov-Smirnov test. The data were analyzed using Statistical District, southwestern Ethiopia.
Package for Social Science (SPSS version 20). All tests were
conducted at 95% confidence level. Land Uses Natural Forest Farm Farmland
Forest Interface
Results Natural Forest 1 0.51 (0.49) 0.33 (0.67)
Woody Species Diversity
A total of 59, 24 and 19 woody species belonging to 34 families Forest Farm 0.51 (0.49) 1 0.37 (0.63)
Interface
were recorded and identified in the sample plots of Gura-Ferda
NF, FFI, and FL respectively (Table 4). Among these woody Farmland 0.33 (0.67) 0.37 (0.63) 1
species, Moraceae, Rubiaceae and Sapotaceae were the richest
family all represented by six species (8.82%) of total floristic
composition. The remaining families represented less than 3% The mean aboveground biomass (tree/shrub, dead wood and
of species each. litter) C stocks of FFI (99.63± 9.72 Mg C ha-1) are signifi-
cantly lower than the adjacent NF (134.40± 10.09 Mg C ha-1),
The overall mean H’, species richness and evenness of NF but higher than that of FL (16.80± 1.18 Mg C ha-1). The mean
were 3.33, 59 and 0.82 respectively. FFI enriched with 24 aboveground biomass C stocks of NF were approximately
woody species has an overall mean H’ of 1.57. The results 2.24 and 8.47 times higher than FFI and FL. The mean overall
of H’ and evenness indices indicated a difference in species dead wood C stock of the study area was 2.3 ± 1.51 Mg C ha-1
diversity and evenness among the land uses. NF is relatively for NF and 9 ± 2.56 Mg C ha-1 for FFI (Table 6). The mean litter
the most diversified one followed by FFI. Relatively, highest biomass for aboveground biomass was 1.29 ±0.14 Mg C ha-1
evenness was exhibited by NF followed by FFI (Table 4). for natural forest and 0.88 ±0.06 Mg C ha-1 for forest farm
interface.
Sorensen’s similarity coefficient indicated the highest floristic
similarity was found between NF and FFI (0.51) followed by A belowground biomass C stock in the NF was significantly
FFI and FL (0.37). The magnitude of beta diversity indicates higher (p< 0.001) than the belowground biomass C stocks of
the change in woody species composition between adjacent FFI and FL (Table 6). The mean belowground biomass C stocks
land uses along the land use changes. The highest change in in the NF, FFI and FL were 26.16±2.02 Mg C ha-1, 17.95±1.94
woody species diversity was observed between the changes from Mg C ha-1 and 3.36±0.23 Mg C ha-1 respectively. The total bio-
NF to FL (0.67) followed by FFI to FL (0.63) (Table 5). Cordia mass C stocks in NF was by 7.73% and 38.84% higher than
africana, Croton macrostachyus and Lepidotrichlea volkensi FFI and FL. Cash generating coffee ≥2.5 DBH shared 0.5% and
were some of common woody species in all land uses. 2.3% of the total biomass C stocks in NF and FFI respectively.
The contribution of litter for total biomass C in both NF and
Carbon stocks FFI was 1%.
The basal area of woody species in NF (54.31±2.95 m2ha-1)
was 2.3 and 4.1 times higher than FFI (26.66±2.28 m2ha-1) Within each land use, SOC stock was significantly higher
and FL (6.12±0.37 m2ha-1) respectively. The density of woody (pF1000Research 2021, 10:227 Last updated: 09 AUG 2021
Table 6. (Mean ± SD) of above and belowground biomass carbon
stocks of Natural Forest, Forest Farm Interface and Farm Land (Mg C
ha-1) in Guraferda District, southwestern Ethiopia.
Biomass component Natural Forest Forest Farm Farm Land
Interface
AGBC (Mg C ha-1) 134.40± 10.09 99.63± 9.72 16.80± 1.18
BGBC (Mg C ha-1) 26.16±2.02 17.95±1.94 3.36±0.23
TBC (Mg C ha-1) 160.57±12.01c 117.58±11.88b 20.16±1.36a
Different letters show significant (pF1000Research 2021, 10:227 Last updated: 09 AUG 2021
the NF within 1984–2016-year interval. As reported by Gessese This result is in line with the result of Solomon et al. (2018)
(2018), and GFDAO (2016) the main problem related to land which stated that tree density, diversity and diameter have an
use land cover change at Gura-Ferda district was agricultural effect on biomass C.
investment, fuel wood collection, wood for house construc-
tion and farm implementation, wildfire, resettlement, land cer- Case studies have showed as different land use systems
tification, poor governance within the district, and subsistence stocked different amounts of C in their biomass component.
agricultural land expansion. Accordingly, the biomass C stocks recorded in the NF of the
current study area is substantially lower than the biomass C
According to a Gura-Ferda district land administration report, stocks of Adaba-Dodola community forest, southeastern Ethio-
large areas of extra land were recorded for each farmer. The pia (Bazezew et al., 2015). The biomass C stocks of NF of the
farmers had expanded their farmland into nearby forest, current study area was approximately three times lower than the
shrub/bush land and grass land and used those land uses for com- biomass C stocks reported for woody plants of Mount Zequalla
mercial crop production. Therefore, this increment of unregis- Monastery in Ethiopia (Girma et al., 2014). Similarly, the
tered or unplanned farms and FL resulted from above mentioned biomass C stocks of FFI in this study was higher than that of
drivers are the main causes for the loss of woody species the coffee based agroforestry system in Gera, Jimma Zone,
diversity in the study area. South-West Ethiopia (Mohammed & Bekele, 2014). The dif-
ference in biomass C stocks might be due to various factors
The main reason for the lower woody species diversity in such as difference in diversity of trees (woody and non woody)
FFI in relation to NF in the study area is due to the application of larger sizes, the used allometric equation, soil condition and
of intensive thinning of different woody species in the system climate factors. For instance, in the coffee based agroforestry
in order to reduce shading effect. (Gole, 2003) also reported system studied by Mohammed & Bekele (2014), trees above-
that, managing forest for coffee production has resulted in ground biomass was determined using Brown et al. (1989)
significant changes in species diversity, composition and veg- allometric equations. But, for this study, the generic equa-
etation structure in coffee forests of southwestern Ethiopia. tion developed by Chave et al. (2014) and Kuyah et al. (2012a)
The number of woody species recorded in Gura-Ferda NF is were used for woody tree species. The biomass C stocks of the
comparable to the Komba-Daga moist evergreen forest in FFI of the current study area was relatively equivalent with
southwestern Ethiopia (62 woody species) (Geneme et al., the total biomass C stocks of fruit coffee system of indig-
2015). For instance, the number of woody species recorded in enous agroforestry systems of the south-eastern Rift Valley
the Gura-Ferda NF of the current study area is substantially escarpment, Ethiopia (Negash & Starr, 2015).
higher than those reported for Agama tropical Afromontane
forest of Ethiopia (39 woody species) (Addi et al., 2016). The average mean above ground biomass C stock of the FFI was
However, the number of woody species in the current stud- higher than the mean biomass C stocks of organic polyculture
ied NF is lower than the woody species recorded for Wondo coffee, non-organic polyculture coffee and organic Inga species
Genet Afromontane forest in the central highlands of Ethiopia in Chiapas, Mexico (Soto-Pinto & Aguirre-Dávila, 2014). The
(72 woody species) (Kebede et al., 2013). variability among these systems in this respect might be because
of differences in species composition, site characteristics,
Our results also indicated that, the woody species richness in management practices, land holding sizes, ancillary factors (e.g.
FFI of the current study is comparatively lower than woody of soil condition, climate, system age, land-use history), and adopted
species in agroforestry system of south-central and southern allometric model for biomass estimation (Montagnini & Nair,
highlands of Ethiopia (Asfaw, 2003; Seta & Demissew, 2017). 2004).
Since maximizing coffee production is the main goal, most of
the native trees have been cleared by cultivators and few shade Concentrations of SOC decreased with an increment of depth in
plant species are retained in highly populated coffee shrubs. all NF, FFI and FL. The highest SOC stock in the NF might be
attributed to the lower organic carbon turnover rate as a result
Carbon stocks of minimum soil disturbance in the system, and more litter
The study showed how C stocks in biomass and soils were fall inputs from different wood tree species. While in the FFI,
varied across different land use systems. NF had higher bio- common intensive management practices like cleaning, weed-
mass C stocks compared to FFI and that of the FL. Rajput et al. ing, burning and relocation of biomass might influence accumu-
(2017) and Solomon et al. (2018) reported higher biomass C lation of litter carbon. It was in agreement with results by Aticho
in forest land use system as compared to other land cover types (2013) who claimed the diminishing trend of SOC content with
in northwestern Himalaya and northern Ethiopia, respectively. depth in his study in Kafa, Southwest Ethiopia. Yimer et al.
From the studied land use systems of this area, most of the (2015) also observed a declining trend in SOC concentration
C was stocked in NF. FFI and FL biomass C stocks were 7.73% with depth in the Central Rift Valley area of Ethiopia.
and 38.84% lower than the C stocks in the NF. The accumula-
tion of high C stock in NF was attributed by the presence of The total SOC stocks at soil depth for the three land use sys-
diversified woody species in the NF in comparison with FFI and tems in this study were within the range of SOC stocks reported
FL. Additionally, the NF has found to accumulate larger for other similar systems in Ethiopia (Gebeyehu et al., 2017).
aboveground biomass in the litter compared with that of FFI. The upper layer (0–30 cm depth) SOC stock of FFI in this study
Page 10 of 14F1000Research 2021, 10:227 Last updated: 09 AUG 2021
area was higher than the mean SOC (65.2 Mg C ha-1) of Nitisol the community and a potential to reduce pressure on adjacent
soil under agroforestry systems in Ethiopia (Gebeyehu et al., NF.
2017). The result of SOC in 0–30 systems cm depth in FFI was
also higher than the 0–30 cm depth SOC recorded in Gununo Data availability
watershed agroforestry practices (Bajigo et al., 2015), and Underlying data
0–30 cm depth SOC (60.8 Mg C ha-1) of Indonesia homegarden Zenodo: Conversion of Natural Forests to Farmlands and Its
agroforestry system (Roshetko et al., 2002). Associated Woody Species Diversity and Carbon Stocks in a
Span of 33 Years (1984 To 2016): In the Case of Southwestern
The results indicate that 5.78 % and 21.82% of SOC stocks Ethiopia, http://doi.org/10.5281/zenodo.4601418 (Betemariyam
(0–60 cm) were lost in conversion of the NF to the FFI and et al., 2021).
FL respectively within 33 years. Another meta-analysis of
Wei et al. (2014) found that SOC decreased by 44.5% follow- This project contains the following underlying data:
ing conversion from a NF to a crop field. Yimer et al. (2007) • Average DBH and Height per Plot.xlsx
also found that SOC decreased by 30.9% after 15 years of
deforestation in the Bale Mountains of Ethiopia. • Processed data of SOC.xlsx
• Processed data of TBC.xlsx
Conclusion
FFI in the southwestern part of Ethiopia plays an important • Processed Data of Woody Species Diversity.xlsx
role in maintaining more woody species and sinks of C. The
higher contribution of NF to climate change mitigation is mainly Data are available under the terms of the Creative Commons
due to the higher diversity and density of larger woody spe- Attribution 4.0 International license (CC-BY 4.0).
cies in the system as compared to the adjacent FFI and FL. Trees
in particular play substantial roles for enhancing biomass C
stocks in forests and any other land use systems. However, the Acknowledgements
increment of FL found adjacent to the NF and FFI showed a We acknowledge the logistic and technical support we got
lower role of biodiversity conservation and C stock. This shows from Wondo Genet College of Forestry and Natural Resources
that sustainability of the system is questionable. If the NF is Soil Laboratory, Hawassa University. We sincerely thank the
not sustainably managed and certification of land is not car- farmers of the study area for their kindness and enthusiasm to
ried out in the area, there will be expansion of FFI and FL talk to us and for allowing us to take measurements on their
which will cause further deforestation and forest degradation. farms. Our gratitude goes to experts at National Herbarium of
Therefore, it needs to recognize FFI as part of climate change Ethiopia, Addis Ababa University, for their generous support
mitigation strategies, as it can also provide much benefit to on species identification that makes our research very fruitful.
References
Abere D: Impact of Resettlement on Woody Plant Species and Local in a Span of 33 Years (1984 To 2016): In the Case of Southwestern Ethiopia
Livelihood: The Case of Guraferda Woreda in Bench Maji Zone, South [Data set]. Zenodo. 2021.
Western, Ethiopia. Addis Ababa University School of Graduate Studies http://www.doi.org/10.5281/zenodo.4601418
Environmental Science Program, 2011. Blake GR, Hartge KH: Particle Density. In Methods of Soil Analysis: Part 1—
Reference Source Physical and Mineralogical Methods. Soil Science Society of America, American
Addi A, Soromessa T, Kelbessa E, et al.: Floristic composition and plant Society of Agronomy. 1986; 363–382.
community types of Agama Forest, an “Afromontane Forest” in Southwest Publisher Full Text
Ethiopia. J Ecol Nat Environ. 2016; 8(5): 55–69.
Brown S, Gillespie A, Lugo AE: Biomass Estimation Methods for Tropical
Publisher Full Text
Forests with Applications to Forest Inventory Data. For Sci. 1989; 35(4):
Asfaw Z: Tree species diversity, topsoil conditions and arbuscular 881–902.
mycorrhizal association in the sidama traditional agroforestry land Reference Source
use, Southern Ethiopia. Swedish University of Agricultural Sciences. 2003.
Chave J, Réjou-Méchain M, Búrquez A, et al.: Improved allometric models to
Reference Source
estimate the aboveground biomass of tropical trees. Glob Chang Biol. 2014;
Aticho A: Evaluating Organic Carbon Storage Capacity of Forest Soil: Case 20(10): 3177–3190.
Study in Kafa Zone Bita District, Southwestern Ethiopia. J Agric Environ Sci. PubMed Abstract | Publisher Full Text
2013; 13(1): 95–100.
Center for International Forestry Research (CIFOR): The West Africa Forest-
Reference Source
Farm Interface Project (WAFFI). 2017.
Bajigo A, Tadesse M, Moges Y, et al.: Estimation of Carbon Stored in Reference Source
Agroforestry Practices in Gununo Watershed, Wolayitta Zone, Ethiopia.
Dewitte O, Jones A, Spaargaren O, et al.: Harmonisation of the soil map of
J Ecosys Ecograph. 2015; 5(1): 157.
africa at the continental scale. Geoderma. 2013; 211–212: 138–153.
Publisher Full Text
Publisher Full Text
Bazezew MN, Soromessa T, Bayable E: Carbon stock in Adaba-Dodola
community forest of Danaba District, West-Arsi zone of Oromia Region, EFRLS: Level Of Submission to the UNFCC. (Issue January). 2016.
Ethiopia: An implication for climate change mitigation. J Ecol Nat Environ. Eshetu AA: Forest resource management systems in Ethiopia: Historical
2015; 7(1): 14–22. perspective. Int J Biodivers Conserv. 2014; 6(2): 121–131.
Publisher Full Text Publisher Full Text
Betemariyam M, Kefalew T, Tolera M: Conversion of Natural Forests to FAO: Global Forest Resources Assessment 2015. In Desk Reference. 2015.
Farmlands and Its Associated Woody Species Diversity and Carbon Stocks Reference Source
Page 11 of 14F1000Research 2021, 10:227 Last updated: 09 AUG 2021
Gebeyehu G, Soromessa T, Teketay D: Organic Carbon Stocks, Dynamics and Sequestration of Forest Carbon. In U.S. Department of Agriculture, Forest
Restoration in Relation to Soils of Agroecosystems in Ethiopia: A Review. Service, Northern Research Station. 2007.
Int J Environ. 2017; 6(1): 1–22. Reference Source
Publisher Full Text Pearson T, Walker S, Brown S: Sourcebook for Land uSe Land-uSe change and
Geneme KK, Hundera K, Dalle G: Species Diversity and Structural Analysis foreStry ProjectS. Winrock International and the BioCarbon Fund of the World
of Komba-Daga Moist Evergreen Forest, Kaffa Zone, Southwest Ethiopia. Bank. 2005.
Research & Reviews: A Journal of Life Sciences. 2015; 5(3): 14–23. Reference Source
Reference Source Rajput BS, Bhardwaj DR, Pala NA: Factors influencing biomass and carbon
Gessese BH: Drivers of Land Use/Land Cover Change in the Guraferda storage potential of different land use systems along an elevational
District of Bench-Maji Zone, Southwestern Ethiopia. Res Rev J Ecol Environ Sci. gradient in temperate northwestern Himalaya. Agroforestry Systems. 2017;
2018; 6(1): 52–62. 91(3): 479–486.
Reference Source Publisher Full Text
GFDAO: Gura-Ferda District Natural Resources Final Report. Benji Maji Zone, Roshetko JM, Delaney M, Hairiah K, et al.: Carbon stocks in Indonesian
Southwestern Ethiopia. 2016. homegarden systems: Can smallholder systems be targeted for increased
carbon storage? American Journal of Alternative Agriculture. 2002; 17(3): 138–
Girma A, Soromessa T, Bekele T: Forest Carbon Stocks in Woody Plants of
148.
Mount Zequalla Monastery and It’s Variation along Altitudinal Gradient:
Publisher Full Text
Implication of Managing Forests for Climate Change Mitigation. Sci Technol
Arts Res J. 2014; 3(2): 132. Schmitt CB, Senbeta F, Denich M, et al.: Wild coffee management and plant
Publisher Full Text diversity in the montane rainforest of southwestern Ethiopia. African
Journal of Ecology. 2010; 48(1): 78–86.
Gole TW: Vegetation of the Yayu forest in SW Ethiopia: impacts of human
Publisher Full Text
use and implicatiions for in situ conservation of wild Coffea arabica L.
Populations. Göttingen: Cuvillier. 2003; 10: 176. Schnitzer M: Organic Matter Characterization.Chemical and Microbiological
Reference Source Properties-Agronomy Monograph No. 9 (2nd Edition). 1982.
Scholte P: Atlas of the Potential Vegetation of Ethiopia. Ib Friis, Sebsebe
Grais A, Casarim F: LEAF Technical Training on Carbon Assessment:
Demissew & Paulo van Breugel. Copenhagen: The Royal Danish Academy
Overview What we will cover …. Ecosystem Services Unit, Winrock
of Sciences and Letters in Biologiske Skrifter 58. 2010. 307 pp. including 29
International. 2013.
colour map plates (1:2 000 000). ISSN 0366 3612, ISBN 97887 7304 347 9.
Reference Source
400 DKK (approx. £46) paperback. Edinburgh Journal of Botany. 2012; 69(1):
Hurni H: Agroecological Belts of Ethiopia Explanatory notes on three maps 207–209.
at a scale of 1:1,000,000 in association with The Ministry of Agriculture, Publisher Full Text
Ethiopia. 1998.
Seta T, Demissew S: Diversity and standing carbon stocks of Agroforestry
Reference Source
trees in Wenago District , Ethiopia. International Journal of Agroforestry and
IPCC: 2006 IPCC Guidelines for National Greenhouse Inventories - A primer, Silviculture. 2017; 4(1): 246–256.
Prepared by the National Greenhouse Gas Inventories Programme, Solomon N, Pabi O, Annang T, et al.: The effects of land cover change on
Eggleston HS, Miwa K, Srivastava N and Tanabe K. Iges. 2006; 20. carbon stock dynamics in a dry Afromontane forest in northern Ethiopia.
Reference Source Carbon Balance Manag. 2018; 13(1): 14.
Kebede M, Kanninen M, Yirdaw E, et al.: Vegetation structural characteristics PubMed Abstract | Publisher Full Text | Free Full Text
and topographic factors in the remnant moist Afromontane forest Soto-Pinto L, Aguirre-Dávila CM: Carbon Stocks in Organic Coffee Systems in
of Wondo Genet, south central Ethiopia. J For Res. 2013; 24(3): 419–430. Chiapas, Mexico. Journal of Agricultural Science. 2014; 7(1): 117.
Publisher Full Text Publisher Full Text
Kuyah S, Dietz J, Muthuri C, et al.: Allometric equations for estimating Tadesse G, Zavaleta E, Shennan C: Effects of land-use changes on woody
biomass in agricultural landscapes: I. Aboveground biomass. Agric Ecosyst species distribution and above-ground carbon storage of forest-coffee
Environ. 2012a; 158(August): 216–224. systems. Agriculture, Ecosystems and Environment. 2014; 197: 21–30.
Publisher Full Text Publisher Full Text
Kuyah S, Dietz J, Muthuri C, et al.: Allometric equations for estimating Tolera M, Asfaw Z, Lemenih M, et al.: Woody species diversity in a changing
biomass in agricultural landscapes: II. Belowground biomass. Agric Ecosyst landscape in the south-central highlands of Ethiopia. Agriculture, Ecosystems
Environ. 2012b; 158: 225–234. and Environment. 2008; 128(1–2): 52–58.
Publisher Full Text Publisher Full Text
Lemenih M, Kassa H: Re-greening Ethiopia: History, challenges and lessons. UNFCCC: Measurements for Estimation of Carbon Stocks in Afforestation
Forests. 2014; 5(8): 1896–1909. and Reforestation Project Activities under the Clean Development
Publisher Full Text Mechanism: A Field Manual. 2015.
Reference Source
Moges Y, Eshetu Z, Nune S: Ethiopian Forest Resources : October. 2010; 16.
Wei X, Shao M, Gale W, et al.: Global pattern of soil carbon losses due to the
Mohammed A, Bekele L: Changes in Carbon Stocks and Sequestration conversion of forests to agricultural land. Sci Rep. 2014; 4: 4062.
Potential under Native Forest and Adjacent Land use Systems at Gera, PubMed Abstract | Publisher Full Text | Free Full Text
South- Western Ethiopia. Global Journal of Science Frontier Research. 2014;
Whittaker RH: Evolution and Measurement of Species Diversity. TAXON. 1972;
14(10): 2249–4626.
21(2–3): 213–251.
Reference Source
Publisher Full Text
Montagnini F, Nair PKR: Carbon sequestration: An underexploited Yimer F, Alemu G, Abdelkadir A: Soil property variations in relation to
environmental benefit of agroforestry systems. Springer, Dordrecht. 2004; exclosure and open grazing land use types in the Central Rift Valley area of
281–295. Ethiopia. Environmental Systems Research. 2015; 4(1): 17.
Publisher Full Text Publisher Full Text
Negash M, Starr M: Biomass and soil carbon stocks of indigenous Yimer F, Ledin S, Abdelkadir A: Changes in soil organic carbon and total
agroforestry systems on the south-eastern Rift Valley escarpment, nitrogen contents in three adjacent land use types in the Bale Mountains,
Ethiopia. Plant and Soil. 2015; 393(1–2): 95–107. south-eastern highlands of Ethiopia. Forest Ecology and Management. 2007;
Publisher Full Text 242(2–3): 337–342.
Pearson TRH, Brown SL, Birdsey RA: Measurement Guidelines for the Publisher Full Text
Page 12 of 14F1000Research 2021, 10:227 Last updated: 09 AUG 2021
Open Peer Review
Current Peer Review Status:
Version 1
Reviewer Report 04 June 2021
https://doi.org/10.5256/f1000research.31345.r83476
© 2021 Ali A. This is an open access peer review report distributed under the terms of the Creative Commons
Attribution License, which permits unrestricted use, distribution, and reproduction in any medium, provided the
original work is properly cited.
Arshad Ali
Department of Forest Resources Management, College of Forestry, Nanjing Forestry University,
Nanjing, China
I read your paper carefully, and found it an interesting idea to compare three land use types such
as NF, FFI and FL. I found a very interesting hypothesis at the end of introduction, but
unfortunately your experimental design and statistical analyses do not allow to test this
hypothesis in a clear way.
For example, you selected plots with different sizes and hence it is hard to compare with ANOVA
only or any other simple statistics. I suggest testing the direct and indirect effects of plot size, and
land use types (i.e., three categories) on species diversity, structure and biomass using structural
equation models or multiple linear mixed effect models. Otherwise, it is hard to understand
results and hence hard to get right conclusions.
Why did you used different biomass equations for NF, FFI and FL? Is this not affecting the biomass
estimation amongst three types?
Is the work clearly and accurately presented and does it cite the current literature?
Partly
Is the study design appropriate and is the work technically sound?
No
Are sufficient details of methods and analysis provided to allow replication by others?
No
If applicable, is the statistical analysis and its interpretation appropriate?
No
Are all the source data underlying the results available to ensure full reproducibility?
Page 13 of 14F1000Research 2021, 10:227 Last updated: 09 AUG 2021
Partly
Are the conclusions drawn adequately supported by the results?
Partly
Competing Interests: No competing interests were disclosed.
Reviewer Expertise: My broad-scale research interests are in the area of forest or plant ecology,
particularly related to multiple abiotic and biotic controls on ecosystem functions and processes.
I confirm that I have read this submission and believe that I have an appropriate level of
expertise to state that I do not consider it to be of an acceptable scientific standard, for
reasons outlined above.
The benefits of publishing with F1000Research:
• Your article is published within days, with no editorial bias
• You can publish traditional articles, null/negative results, case reports, data notes and more
• The peer review process is transparent and collaborative
• Your article is indexed in PubMed after passing peer review
• Dedicated customer support at every stage
For pre-submission enquiries, contact research@f1000.com
Page 14 of 14You can also read