Determining Community-level Carnivore Response to Landscape Factors in Bukit Barisan Selatan National Park, Sumatra, Indonesia
←
→
Page content transcription
If your browser does not render page correctly, please read the page content below
Volume 5 (3): 68-88 (2021) (http://www.wildlife-biodiversity.com/) Research Article

Determining Community-level Carnivore Response to
Landscape Factors in Bukit Barisan Selatan National Park,
Sumatra, Indonesia

Eve T Bohnett1*, Kossi Fandjinou2, Bilal Ahmad3, Siraj Mammo4, Dave Hulse5, Thomas
Hoctor6
1
Florida Institute for Built Environment Resilience, Department of Landscape Architecture,
University of Florida, Gainesville, USA
2
 School of Soil and Water Conservation, Beijing Forestry University, Beijing, China.
3
 Institute of Agriculture Sciences and Forestry, University of Swat, Swat, Pakistan.
4
 Biology Department, Ambo University, Ambo, Ethiopia.
5
Florida Institute of Built Environment Resilience, Department of Landscape Architecture,
University of Florida, Gainesville, USA
6
 Department of Landscape Architecture, University of Florida, Gainesville, USA
*Email: evebohnett@yahoo.com
Received: 10 November 2020 / Revised: 13 March 2021 / Accepted: 13 March 2021 / Published online: 27 September 2021. Ministry of
Sciences, Research, and Technology, Arak University, Iran.
How to cite: Bohnett, E.T., Fandjinou, K., Ahmad, B., Mammo, S., Hulse, D., Hoctor, T. (2021). Determining Community-level Carnivore
Response to Landscape Factors in Bukit Barisan Selatan National Park, Sumatra, Indonesia,5 (3), 68-88. doi: 10.22120/jwb.2021.139653.1198

Abstract
Researchers are challenged to understand the distribution of biodiversity on the landscape or
determine if community-level assemblages respond to landscape variability. Canonical ordinations
and multispecies occupancy modeling are often utilized and differ in their analytical scale and
technique. Community-level data for carnivores (n=18) from camera trapping data (n=60) were
tested for their collective response to covariates (distance to villages, roads, plantations, streams,
and also topographic variables for elevation and slope) in Bukit Barsan Selatan National Park.
Redundancy analysis (RDA) results confirmed that the carnivore community responded to the
anthropogenic covariates, with carnivore detections being higher in areas at a high distance from
roads and plantations medium distance villages. Then, multispecies occupancy models (MSOM), a
comparatively finer temporal scale analysis that incorporated imperfect detections, were compared
to RDA. We fit four models (full, anthropogenic, natural, and null) that were mainly inconclusive.
In some MSOM models, the carnivore community did respond to environmental covariates,
although the coefficients did not show a consistent response between seasons or years. These
results indicate that RDA was able to detect broad-scale covariate effects that were not able to be
68 | Journal of Wildlife and Biodiversity 5 (3): 68-88 (2021)

modeled by MSOM and that these scaling and imperfect detection issues should be considered
when attempting to understand landscape community diversity.

Keywords: Biodiversity, carnivores, community ecology, multi-species occupancy, redundancy
analysis
Introduction
Land-use change and anthropogenic disturbances have been shown to have severe effects on
biodiversity, for example, losses of alpha diversity (species richness) through forest conversion
(Gibson et al., 2011) or agricultural expansion (Laurance et al., 2014). The urgency of protecting
the world's megafauna has become apparent from global analyses, showing Indonesia to be within
the top 10 countries globally for megafauna decline (Ripple et al., 2016, 2017). Due to the
conversion of natural forests to agriculture, logging, hunting, and trapping, significant alpha
diversity losses have occurred in Indonesia (Rodrigues et al., 2014). However, there is an
insufficient capacity to predict alpha and beta biodiversity components on the landscape
undergoing anthropogenic conversions and then enact interventions that deal with local-scale
biodiversity conservation (Wearn et al., 2019). Researchers and conservation planners are
challenged to prioritize areas on the landscape to benefit the conservation of the ecosystem
components, as it is challenging to gauge community-level richness within a matrix of landscape
variability (Zipkin et al., 2009).
Various guilds react to gradients of land use land cover (Goijman et al., 2015; Wearn et al., 2019)
or a landscape matrix of human disturbances (Easter et al., 2019; Rezaei et al., 2021). Other
studies have classified species into guilds based on relatedness in terms of habitat preferences or
diet, where inferences were more specific to a subset of species (Pacifici et al., 2014). Previous
camera trapping studies have classified mammal communities into various functional effects
groups like trophic guilds or conservation status to look at habitat responses. For example, camera
trapping data were used to show dramatic declines of community richness for many guilds in oil
palm plantations, compared to logged forests or old-growth areas (Wearn et al., 2017).
Species occurrence and abundance data, along with corresponding environmental covariates, are
the basis from which inferences on community-level modeling efforts are built, seeking to answer
fundamental questions central to community ecology (Ovaskainen et al., 2016). Species
occurrence data are usually analyzed separately and pooled in community-level analysis to
understand how environmental factors affect species richness across landscape gradients (Zipkin
et al., 2009).
Understanding community-level biodiversity through multivariate methods has been the most
widely applied methodology in understanding the structure of ecological community composition
related to environmental factors (Borcard et al., 2011). Ordinations have long been a central
exploratory methodology in using dimensionality reduction to produce factors or principal
components used for identifying the most significant variables within the covariate hyperspace.
For example, principal components analysis can reduce an n-matrix of sites within an
environmental covariate space to identify one or two principal components composed of a
proportion of each variable and more heavily composed of more significant variables
69 | Journal of Wildlife and Biodiversity 5(3): 68-88 (2021)

differentiating the sites from one another (Rao, 1964). Other methods, like redundancy analyses
(RDA), can examine the multispecies community table along environmental gradients, perform
multiple regression on the multivariate response, and reduce dimensions using eigenanalysis
approaches to determine significant community-level responses to landscape variability (Dray et
al., 2012; Rao, 1964). Researchers have suggested combining classical statistical models for
community compositional data, like constrained ordinations or other multivariate analyses with
emerging methods for spatial pattern analyses (Dray et al., 2012), or with hierarchical community
models (Yamaura et al., 2019), for comprehensive approaches in understanding covariate effects
on a community.
Another inferential methodology for understanding community structure within a heterogeneous
landscape is the multispecies occupancy model (MSOM) (Dorazio & Royle, 2005). These
hierarchical models combine presence-absence data tables for each species, use community-level
parameters, and include a detectability model to account for imperfect detection (MacKenzie et
al., 2002). Furthermore, MSOM provides a robust inference for multiple species' occupancy,
including rarer species, resulting in estimates for species richness estimates and any community-
level co-variability.
MSOM has informed appropriate multispecies conservation management actions from site-level
species richness estimates. The conservation implications of multispecies occupancy models have
assisted in designing management programs (Zipkin et al., 2010), such as assessing patrol
enforcement management regimes (Farr et al., 2019) and other anthropogenic disturbances like
poaching (Moore et al., 2018). Inferences from MSOM for mammals have been able to show a
response to anthropogenic disturbances like habitat fragmentation and land conversion (Boron et
al., 2019; Cavada et al., 2019; Dechner et al., 2018; Rovero et al., 2014), or other natural features
like distance to water (Cavada et al., 2019).
This study discusses the analytical scale implications in the modeling workflow, as RDA and
MSOM are analyzing different temporal scales. RDA methods are referred to as a "global-scale"
analytical structure because they seek to understand the broad structure of the community-level
data, utilizing data tables of species observations collated across years of survey effort, where
there are no assumptions there are finite windows of time to restrict the analysis. MSOM is
referred to here as a "local-scale" analysis because they are collected throughout a finite window
of time to meet the assumptions of population closure, which indicates there is no species
immigration or emigration from the site, resulting in repeated surveys within this time window
data, and also scaled into hours, days, weeks, or months depending on the survey or analysis
schema. This study seeks to investigate exploratory data analysis and the RDA as a broader
temporal scale analysis to understand covariate effects and assess MSOM response to the same
covariates at more localized temporal scales. These methods are compared and contrasted for their
ability to detect a response in the carnivore community, as we discuss this inherent temporal
scaling difference between the analytical methods and their ability and inability to incorporate
imperfect detection.
This research asked principal questions at the intersection of landscape ecology and community
ecology. What were the primary landscape responses that can be modeled for carnivore
communities, utilizing available environmental and anthropogenic covariate data in BBSNP and
comparing these multispecies analysis methodologies? Carnivore communities in BBSNP,
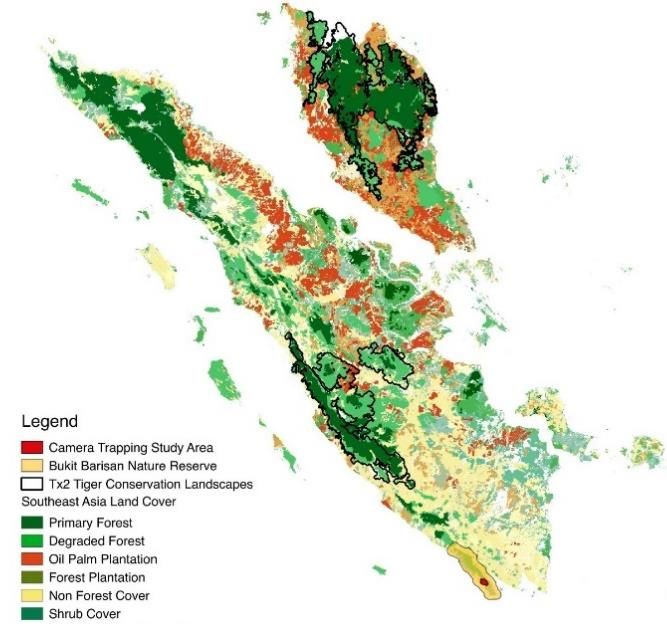
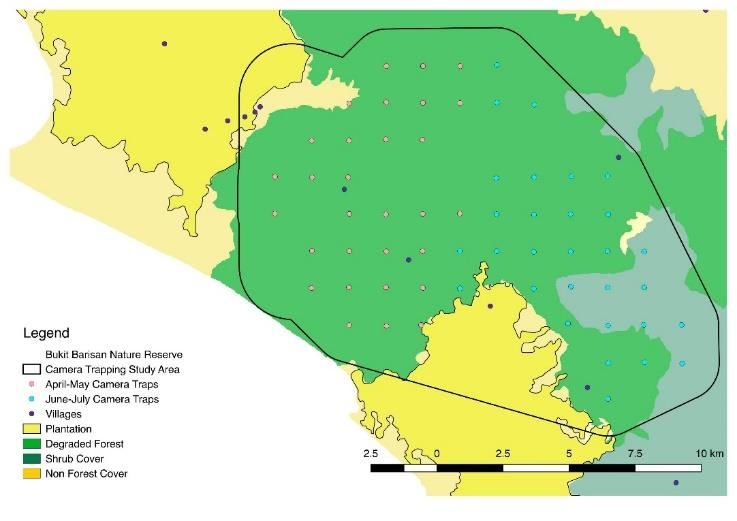
70 | Journal of Wildlife and Biodiversity 5 (3): 68-88 (2021)

Sumatra, Indonesia, have a diverse species pool with the presence of many rare and elusive
species of wild felids that are a part of a wider carnivore community, continually being threatened
by anthropogenic factors, and we seek to further qualify that threat through these discussed
modeling approaches.

Material and methods
Study area
To further understand terrestrial mammal distributions in general, Tropical Ecology Assessment
and Monitoring (TEAM) Network implemented assessments over seven years (2010-2016), in
Bukit Barisan Selatan National Park (BBSNP), Lampung province, Sumatra, Indonesia (-5°49' S
104°31'E) (Fig 1).

 .

 Figure 1. Map of land uses and tiger conservation zones around Sumatra, with a subset of the study area
 within Bukit Barisan Selatan National Park (yellow polygon) with camera stations' locations (red circle).
 Camera stations were colored to designate blocks: block 1 (pink) and block 2 (blue)
BBSNP is a 3568 km2 with coastal forest, mangrove forest, and lowland rainforest with a
mountain range reaching a 1964m elevation(Pusparini et al., 2018). The monsoon season occurs
seasonally between November to May. The park is known for the many unique and endangered
species, like the Sumatran elephant, Sumatran rhinoceros, and Sumatran tiger. Aside from this
study, several research studies have analyzed the carnivores in BBSNP in Sumatra, assessing the
distribution and habitat use of felid species ( McCarthy et al., 2015), or specifically Sumatran
tigers (Allen et al., 2020; Jaya et al., n.d.; O'Brien et al., 2003; Pusparini et al., 2018). Threats to
the park's rainforest's integrity include agricultural encroachment and the development of
enclaves where squatters have claimed the forest for their uses (O'Brien & Kinnaird, 1996).
Camera Trapping Design
These surveys used camera traps (n = 60) arranged in a systematic grid with cameras placed at the
center of each 2km2 grid site (Fig 1). During the seven years the study site was operational, there
was a rotational design where cameras were moved in April-May and June-July to different sets
71 | Journal of Wildlife and Biodiversity 5(3): 68-88 (2021)

of locations according to the yearly data collection protocol. The entire camera trapping grid ran
each April - August every year over 544 calendar days, producing 2393 camera trapping nights.
The dataset contained 39-59 camera sites with variations year to year, surveyed 85-163 days per
year, for an average of 25-32 days per camera (Table 1). All cameras were set for 24 hours, and
detections were collated into days, weeks, or months as per the modeling temporal scale.

Table 1. Camera station variability in camera number and survey days
 Year Total (April -July) Block1 (April-May) Block2 (June-July)
 # Survey Days # Survey #Cameras Survey
 2010 59
 Cameras 104 29
 Cameras 36
 Days 30 37
 Days
 2011 55 85 27 34 28 35
 2012 50 96 25 36 25 53
 2013 39 108 20 35 19 36
 2014 43 111 23 73 20 70
 2015 39 100 25 36 14 35
 2016 51 163 27 60 24 81

Study fauna
The studied fauna included all mammalian carnivores detected during the seven years of the
camera trapping survey. There were 18 carnivores with 135 detection days between 2010-2016
(Table 2).

Table 2. Eighteen Carnivores Detected from TEAM Network Cameras 2010-2016
Family Genus Species Common name IUCN Detections
Mustelidae Aonyx cinerea Asian small-clawed otter VU 1
Viverridae Arctictis binturong Binturong VU 1
Viverridae Arctogalidia trivirgata Small toothed palm civet LC 1
Canidae Canis lupus familiaris Domestic dog LC 1
Canidae Cuon alpinus Dhole EN 4
Viverridae Cynogale bennettii Otter Civet EN 1
Ursidae Helarctos malayanus Sun bear VU 25
Viverridae Hemigalus derbyanus Banded palm civet NT 29
Herpestidae Herpestes brachyurus Short-tailed mongoose NT 1
Viverridae Lutra lutra Eurasian otter NT 1
Felidae Neofelis diardi Clouded leopard VU 5
Viverridae Paguma larvata Masked palm civet LC 9
Felidae Panthera tigris Tiger EN 25
Viverridae Paradoxurus hermaphroditus Asian palm civet LC 1
Felidae Pardofelis marmorata Marbled cat NT 6
Felidae Pardofelis temminckii Golden Cat NT 6
Felidae Prionailurus bengalensis Leopard Cat LC 10
Prionodontidae Prionodon linsang Banded linsang LC 5

This particular study region has diverse species of special status carnivores. For example, three
endangered species were detected: tiger (Panthera tigris), dhole (Cuon alpinus), and otter civet
(Cynogale bennettii). The most abundant carnivores in the survey by the number of detections
were the banded palm civet (Hemigalus derbyanus) (n=29), and also IUCN vulnerable sun bear
(Helarctos malayanus) (n=25), and IUCN endangered tiger (n=25). Furthermore, many species
were only detected one time during all seven years of the survey: binturong (Arctictis binturong),
72 | Journal of Wildlife and Biodiversity 5 (3): 68-88 (2021)

domestic dogs (Canis familiaris), short-tailed mongoose (Herpestes brachyurus), Asian small-
clawed otter (Aonyx cinerea), otter civet, Asian palm civet (Paradoxurus hermaphroditus), and
small-toothed palm civet (Arctogalidia trivirgata). There were several species presumed extant
by IUCN and not detected during the surveys (Table 3). These undetected species were not
included in modeling analysis.

Table 3. Eight Carnivore Species Presumed Extant by IUCN and Not Detected by Camera Trap Surveys.
These species were not included in any of the modeling efforts

 Family Genus Species Common name
 Felidae Catopuma temminckii Asiatic Golden Cat
 Herpestidae Herpestes semitorquatus Collard Mongoose
 Mustelidae Lutra sumatrana Hairy Nosed Otter
 Mustelidae Lutrogale perspicillata Smooth-coated otter
 Mustelidae Martes flavigula Yellow-throated marten
 Mustelidae Mustela nudipes Malayan weasel
 Viverridae Viverra tangalunga Malayan civet
 Felidae Prionailurus planiceps Flat-headed cat

Environmental Covariates
Environmental covariates were generated from freely available geospatial data. Elevation and
slope were derived from Shuttle Radar Topography Mission (SRTM) raster data. Distance to
roads, streams, plantations, and villages was derived from shapefile open street map data and
generating a Euclidean distance raster. Any continuous covariates were scaled (-1,1). Program
ArcGIS was used for covariate derivations.

Statistical Analysis and Modeling Framework
Exploratory Data Techniques
To understand the distribution of camera traps in the hyperspace of covariate information, first, a
PCA was used. Environmental covariates were checked for multivariate normality using the
MVN package(Korkmaz et al., 2019). The scree plot identified two significant principal
components using an eigenvalue of 1 as the cutoff. Multivariate analysis was checked for spatial
autocorrelation using a distance-based Moran's Eigenvector Maps, which found no statistically
significant spatial structures in the data, so scaling factors were not included.
For RDA, carnivore community data were Hellinger transformed and modeled in response to
environmental covariates (elevation, slope, and distance to villages, roads, streams, and
plantations) that were binned into three equal bins and included as factors in the RDA.
Additionally, detection days for the camera trap mammal detections were summed across orders
(Cetartiodactyl, Eulipotyphla, Perissodactyla, Pholidota, primates, Proboscidea, Rodentia,
Scandentia) and included for additional exploration of the data. A global test of the RDA was run
for 1000 permutations to determine model significance (α=0.05). Then, forward selection was
used to identify the explanatory variables with the highest R2 for subsequent model refitting. The
VEGAN package in program R version 3.6.1 was used to generate PCA and RDA results and
plots(Oksanen et al., 2019).
73 | Journal of Wildlife and Biodiversity 5(3): 68-88 (2021)

Multi-Species Occupancy Model (MSOM)
Community-level occupancy models involve predicting species community composition as a
function of environmental covariates while accounting for imperfect detection ( Dorazio et al.,
2006; Dorazio and Royle, 2005; Broms et al., 2016). Models attempting to fit multispecies
occupancy have used a multivariate Bernoulli random variable as the latent occupancy state to
provide conditions for interspecific independence and account for imperfect detection (Rota et al.,
2016). Hierarchical models for communities include a super-community concept with nested
levels of single species occurrences.
This model estimates the species-specific occupancy and site-specific species richness by
incorporating data augmented from potential species in the species pool. Extending the single
species single-season model with an index for each species as the latent variable, then the
underlying distribution is a hyperparameter for the entire carnivore community augmented with
all 0's (Kery and Royle, 2016). The MSOM was fit for eighteen species in the species pool that
were detected in 2010-2016. For example, the smallest scale of MSOM modeled, utilizing the
scale of each detection day, for any given year, then there were between four to eight species
detected. The remainder from the original 18 species pool was then augmented into the detection
array (Table 4).

Table 4. Number of carnivores and detections within each year and block out of the species pool of
eighteen species
Year Block 1 Detections Block 2 Detections Total Total
 Carnivores Detections
 (April – (June – July)
 May) Per year Per year
 # Carnivores
 # Carnivores
2010 4 7 7 12 9 19
2011 4 5 8 22 9 27
2012 5 8 6 13 7 21
2013 4 9 3 3 6 12
2014 5 9 8 14 10 23
2015 7 16 2 3 7 19
2016 5 10 4 4 6 14

For the first set of models, we assumed a closed community for each block subset for every two-
month survey period (May-April, June-July) for over seven years resulting in 14 models. For the
second set of models, we included a block effect to distinguish block 1 from block 2, and
considered every four-month survey period (May-July) as a closed community resulting in a
yearly model for 7 models. The scale of the analysis was the 2km2 grid camera trap survey units
within the larger sampling area. We modeled the detection probabilities as a function of the year
(Julian date) to account for the detection differences. We also included a third set of models for a
broader scale MSOM in the analysis utilizing the block effects and further collating detection
days into months with all of the years of data in one model. In models that were run, including all
years of data, separate covariates were fit to model each year's effects. These three MSOM
74 | Journal of Wildlife and Biodiversity 5 (3): 68-88 (2021)

temporals and spatial scales demonstrate whether the models fit better at broader scales in the
MSOM framework.
Camera trapping detection records (presence/absence) for all species collected in a combined
array of each species from each season were used as the response variable. The analyses were
hypothesized to be affected by environmental variables (distance to streams, elevation, and slope)
and anthropogenic variables (distance to the villages, plantations, or roads).
In this dataset, the point occurrences were modeled as a Bernoulli distribution, where occupancy
(ψ) is the probability that a species, I, occurred at site j during survey k.
Superpopulation process
 ~ ( )
State process (occurrence)
 | ~ ( )
Observation process (detection)
 | ~ ( )
Model for two-month subset for either block 1 or block 2:
 ( ) = + 1 ∗ 1 + 2 ∗ 2
For models with block effects for four-month modeling including both blocks:
 ( ) = + 1 ∗ 1 + 2 ∗ 2 +
Priors and Hyperpriors:
 2
 ~ ( , )
 2
 ~ ( , )
 ~ (0, 0.1)
 2
 ~ (0, 1)

Model for detection
 ( ) = + 1 ∗
For models that included all years of data:
 ( ) = + 1 ∗ . 2010 + 2 ∗ . 2011 + 3 ∗ . 2012 + 4
 ∗ . 2013 + 5 ∗ . 2015 + 6 ∗ . 2016
Priors and Hyperpriors:
 2
 ~ ( , )
 2
 ~ ( , )
 ~ (0,0.1)
75 | Journal of Wildlife and Biodiversity 5(3): 68-88 (2021)

 2
 ~ (0,1)

Where 0 is the intercept term for occurrence probabilities, and betas are to proximity to
plantation or village and elevation. Detection probability ( , ) uses alpha to parameterize the
Julian date and effects on species detectability. This study used jagsUI packages in R for a
Bayesian approach to MSOM (Kellner, 2019). We used non-informative priors and ran three
chains for 6000 iterations, burning 2000 and thinning 10. The convergence of the models was
assessed by having an R-hat of
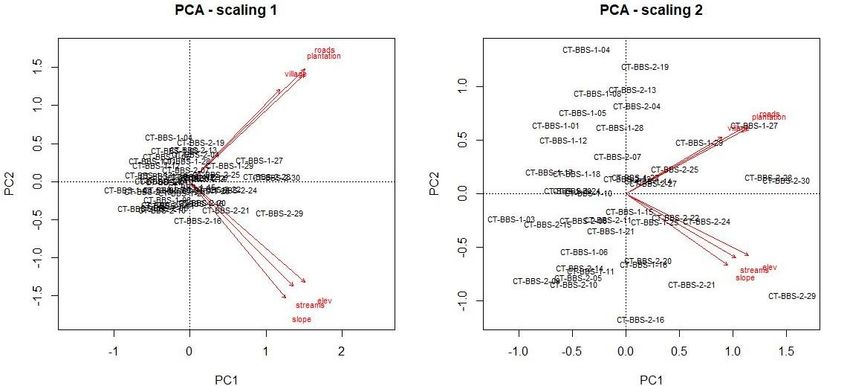
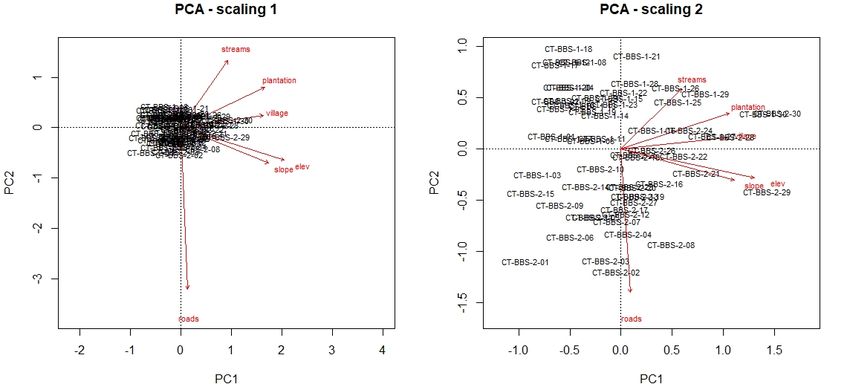
76 | Journal of Wildlife and Biodiversity 5 (3): 68-88 (2021)

 (a)

 (b)
 Figure 2. PCA biplot of TEAM network camera trap data (n=60) in Bukit Barisan Selatan NP
with six environmental covariates (a), PCA biplot of camera trap data (n=44) detected at least one
 carnivore in Bukit Barisan Selatan NP with six environmental covariates (b)

Table 5. Two significant principal components were determined by scree plots, accounting for a
cumulative proportion of 74% of the environmental covariate dataset variance.
 PC1 PC2
 Standard deviation 1.8219 1.0667
 Proportion of Variance 0.5532 0.1896
 Cumulative Proportion 0.5532 0.7428

PCA results indicate that within the subspace of environmental variability, distances to roads and
plantations were particularly pronounced among the camera trap sites (Fig. 4).
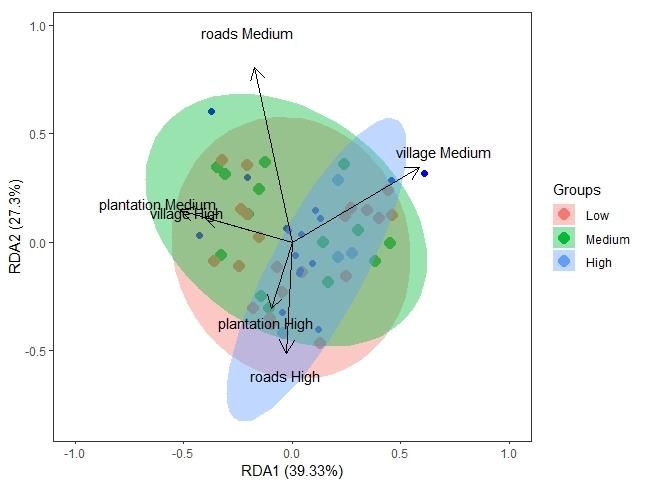
77 | Journal of Wildlife and Biodiversity 5(3): 68-88 (2021)

a. b.
 Figure 4. PCA plots for the six feature environmental covariate feature space results, revealing
 differentiation among areas of low medium and high distance to a. plantations and b. roads.

Redundancy Analysis
Forward selection of the RDA indicated three significant variables (distance to roads, villages,
and plantations). These results were confirmed using a permutation test on the RDA (Table 6),
which found the distance to roads, villages, and plantations model significant (p-value 0.028).
Permutation results indicated 6 RDA axes with one significant as determined by ANOVA and 16
PCA axes. Variance inflation factors (VIF) were checked to determine collinearity using a
threshold of 7, and none of the model variables were found to be strongly correlated. These RDA
results confirm that proximity to human disturbances such as roads, villages, and plantations
affects the number of detections of carnivores (Fig. 5).

 Figure 5. Statistically significant RDA results indicated that Hellinger transformed species richness of
carnivore detections in response to distance to roads, villages, and plantations model. Areas are shaded to
 denote low, medium, and high numbers of detections of carnivores
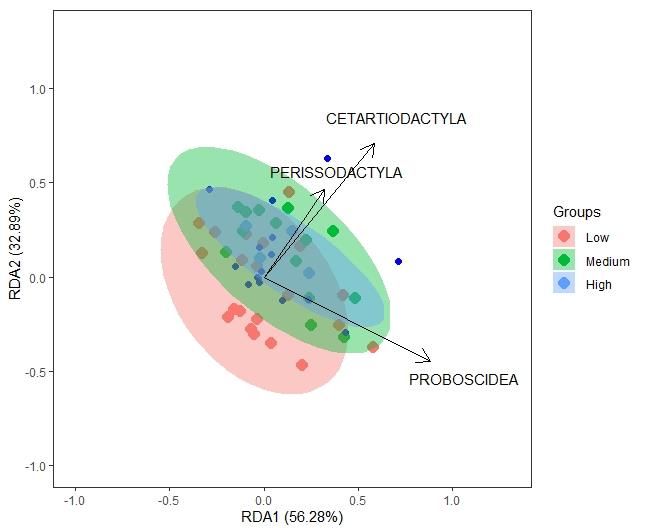
78 | Journal of Wildlife and Biodiversity 5 (3): 68-88 (2021)

Further results showed that the environmental variables accounted for roughly 15% of the
constrained variation, leaving approx 85% of the variation unexplained (Table 7). The first RDA
coefficients indicate that the carnivore community preferred areas of high distance to roads and
plantations and medium distance from villages.

Table 6. Results from the RDA of carnivore community data and anthropogenic covariates (distance to
roads, plantations, and villages)
Model Covariates Df Variance F Pr(>F)
 Elevation, slope, distance to roads, villages,
Full 6 0.09116 0.8436 0.744
 streams and plantations
Anthropogenic Distance to roads, villages, and plantations 6 0.14772 1.4939 0.028 *
Natural Elevation, slope, distance to streams 6 0.09116 0.8436 0.736

Table 7. Significance of RDA and the proportion of constrained and unconstrained variation in the data.
 Inertia Proportion
 Total 0.65084 1.0000
 Constrained 0.09789 0.1504
 Unconstrained 0.55295 0.8496

Further RDA results for the sum of detection days across orders indicate a niche space within the
wider mammal community that the carnivores inhabit. Notably, the species richness of carnivores
was significantly correlated with higher detections of the species in orders Cetartiodactyl (even-
toed ungulate), Perissodactyla (odd-toed ungulate), and fewer detections of Proboscidea
(elephants), as confirmed by ANOVA with a model significance (p=0.028) (Fig 6).

 Figure 6. Statistically significant RDA results indicated that Hellinger transformed species richness with
 detection day counts of mammal species in various orders (Proboscidea, Perissodactyla, Cetartiodactyla).
 With areas shaded for low, medium, and high numbers of carnivore detections.
79 | Journal of Wildlife and Biodiversity 5(3): 68-88 (2021)

Results from the exploratory analysis indicate from PCA that camera trap sites that detected
carnivores show a distinct difference between anthropogenic covariates and natural covariates.
Furthermore, the anthropogenic covariates for distance to roads, villages, and plantations are
significant to this carnivore community (p-value 0.028), explaining 15% of the data are
constrained variation.

Single Subset Occupancy Modeling
Results from the first set of models run for each subset (Block 1 (April-May), Block 2 (June-July)
indicate that the models utilizing covariate information performed better than the null model
(Supp. Table 7a and 7b). Overall, 14 seasons were used in this analysis. Model selection using
deviance, lppd, pD, WAIC, CPO confirmed the best model among the total, anthropogenic,
natural, and null models. In four of the seasons (28%), the full covariate model was the best fit,
four of the seasons (28%), the anthropogenic model was the best fit, four of the seasons (28%),
the natural model was the best fit, and two of the seasons (14%) the null model was the best fit.
This indicates that covariate information helped predict the carnivore community more than the
null model. Model evaluation using Deviance, AUC, and Brier was used to confirm whether the
models fit the data. Sparse camera trapping datasets were shown to perform adequately with
enough carnivore detections. Several models fit the data with AUC scores lower than 0.5,
meaning the model can be considered complete random noise. Ten models had AUC scores
higher than 0.5, indicating these models fit the model better than non-random during the cross-
validation runs (Full (3), Anthro(3), Natural (2), Null (2)) (Supp. Table 8). However, the model
results for those that fit marginally well showed different mean covariate responses for each year
and season (Supp. Table 9). Our hypothesis that there will be covariate effects on the community
as a whole was confirmed. However, the estimates of covariates between years were not
consistent. Furthermore, none of the models had an AUC > 0.7, indicating the models overall did
not fit very well. Species richness distribution maps were generated from the outputs (Fig 7),
which show the projected species richness outputs onto the landscape, further illustrating the
models' inconsistency to find a niche subspace within the study area carnivore species richness
may be higher or lower between years.

Block Design Occupancy Modeling
The block-design models that included a block effect within the model (May-July) were run for
each year of the study. The model selection procedures showed that the full model outperformed
all other models, with five out of the seven years (71%) having better selection metrics for the full
model (Supp. Table 10). However, the models were shown through model evaluation metrics and
k-fold cross-validation not to perform better than random with AUC ~ 0.5 (Supp. Table 11).
These results indicate the block-effects while allowing for a more extensive inclusion of surveys
between May and July, did not improve the ability of MSOM to estimate covariate effects.
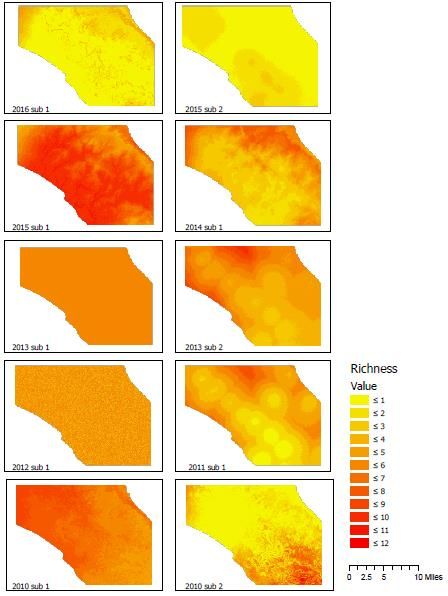
80 | Journal of Wildlife and Biodiversity 5 (3): 68-88 (2021)

 Figure 7. Carnivore species richness outputs and projection onto the landscape for the years that had an
 AUC > 0. 5.

Broad Scale Occupancy Modeling
The block design models that had collated monthly data across years were assessed as the
anthropogenic model performing best (Supp. Table 12). However, the AUC ~ 0.5 revealed these
results to be no better than random (Supp. Table 13).
81 | Journal of Wildlife and Biodiversity 5(3): 68-88 (2021)

Discussion
The results from the RDA were conclusive for anthropogenic effects on the carnivore community.
The RDA produced significant results with the broad-scale exploratory techniques not confirmed
by local scale MSOM with imperfect detection. The hierarchical Bayesian MSOM was only
marginally able to detect any covariability for species richness and the environmental variables at
the smallest scale modeled, which used every survey day, no block effects, and each year
separately. The MSOM was inconclusive at larger temporal scales when block effects were added
and when data were collated to each month within every year in one model. Of the MSOM
models for the smallest scale of data, results were not consistent across years, showing a mix of
full, anthropogenic, natural, and null models. Furthermore, even models with the best model
selection and evaluation did not have model estimates that were similar for covariates, indicating
that MSOM techniques at the local scale did not best represent these data. To illustrate these
inconsistencies, the models were plotted to show potential landscape-scale species richness
hotspots.
Additional analyses indicated that small variation in the RDA was significant for carnivore
species richness described by a niche space of taxonomic orders. Higher numbers of
Cetartiodactyla and Perissodactyla indicated higher numbers of carnivores and a marginal
distance from Proboscidea. These results indicate that a small amount of variation in the data is
likely to co-occurring ungulate species in areas where there is a higher number of carnivores.
The scale of analysis between RDA and MSOM was a topic of concern for this study, as the RDA
collates all data across years, producing one column of species counts at each site across the
seven years of the study, whereas the MSOM was modeled at different temporal scales using the
entire survey of detection days or month and also accounting for imperfect detection.
Furthermore, the RDA used factored variables for distance to roads, plantation, and village as
significant, revealing that factoring variables into broader categories helped detect significant
variables correlated with carnivore species richness.
Previous carnivore studies have performed occupancy modeling, either single season or multi-
season single species models on individual carnivores, revealing occupancy patterns and niche
partitioning when exposed to anthropogenic pressures (Lantschner et al., 2012; Pettorelli et al.,
2010; Rich et al., 2017; Schuette et al., 2013; Van der Weyde et al., 2018). For example, Schuette
(2013) showed through individual-species models that distance to human settlements and land
uses were shown in Kenya to affect 83% of African carnivores' species in their study area. A
unique combination of environmental variables was shown to influence occupancy patterns for
each carnivore studied (Schuette et al., 2013). Globally, many mammalian carnivores exist in
areas of high spatial overlap or significant spatial avoidance, resulting in carnivore co-
occurrences, where resource availability is potentially similar (Davis et al., 2018). Other studies
have attempted to estimate the carnivore community's structure, using density estimates derived
from spatial capture-recapture models that are spatially-explicit, to understand space use and
interspecific interactions (Jiménez et al., 2017). Previous studies on the carnivore community in
Bukit Barisan Selatan National Park (BBSNP) have shown that many carnivores have temporal
overlap or non-overlap of their busy times of day, indicating felid sympatry (Allen et al., 2020).
Through quantitative analysis, these carnivore studies have shown that there are carnivore
community organizations and niche overlap in areas of shared resource use.
82 | Journal of Wildlife and Biodiversity 5 (3): 68-88 (2021)

Other studies have sought to understand community-level covariate effects using MSOM (Boron
et al., 2019; Cavada et al., 2019; Dechner et al., 2018; Rovero et al., 2014) using the Bayesian
Credible Interval (BCI) or Bayesian p-value to understand whether the model fit. However,
methods and metrics for performing model selection (Broms et al., 2016) and evaluation (Zipkin
et al., 2012) have developed slowly alongside these multispecies models. Here, we were able to
provide several model selection (lppd, pD, waic, CPO) and evaluation metrics (deviance, AUC,
briers log) (Broms et al., 2016) for our models to confirm that these MSOM models only
marginally fit the data. The models that had AUC better than random included several subsets
within the most local scale models, although when projected onto the landscape, it also revealed
no distinct patterns between seasons and the model estimates showed no consistency between
subsets and seasons.
This study was unable to make definitive conclusions using community-level data and MSOM,
which accounts for imperfect detection in a more robust modeling framework to include rare
species into the analysis. Using a broad scale of analysis for RDA was more successful, likely
because the number of individual carnivore detections was low, so collating the detections across
years and further binning the covariates into factors was the best way to analyze carnivore data
from this dataset. The comparison between MSOM and RDA has been addressed by Yamaura et
al. (2019), who concluded that they are beneficial depending on the application. One significant
difference in the modeling techniques presented in this work that RDA does not include imperfect
detection and is therefore not making any inferences about occupancy, only detection. We can say
that we detected higher numbers of carnivores at sites with greater distances from plantations and
roads, and medium distances from villages, although this does not estimate occupancy or species
richness that we can project onto the landscape along with covariate estimates. The MSOM did
include imperfect detection and was not able to find a consistent correlation between the
covariates between years or produce results that are considered genuinely robust (AUC > 0.7),
only marginally better than random (AUC > 0.5). These methods can be more beneficial for
larger datasets where the frequency of detection is higher, and the covariate effects are more
pronounced, such as a multi-regional study that has shown a much better ability to fit the data
(Sutherland et al., 2016). An extension of this study may attempt the same workflow utilizing
camera grids from across the state of Sumatra to produce a broader range heterogeneity. In this
study, we sought to use sparse carnivore detections that are a product of surveying carnivores that
are wide-ranging and difficult to detect. Furthermore, between years the number of cameras was
not consistent, with some years having only 30 or 40 cameras and other years having 60 cameras,
which means that imputing the data may have been able to help with these inconsistencies.
Large-scale camera trapping data are only now surfacing for public use or in private database
repositories that can enable more synergistic research. Large area camera trapping networks have
been implemented in order to address questions about mammal distributions at a landscape scale
(McShea et al., 2016), and multiple groups such as GBIF, GEO BON, eMammal, TEAM network
are working towards global camera trapping coverage for generating biodiversity data for
terrestrial mammal assemblages (Steenweg et al., 2017). In combination with environmental data
from repositories such as Google Earth Engine, MSOM approaches can help understand how
communities use the landscape in response to anthropogenic disturbances. As these data are
83 | Journal of Wildlife and Biodiversity 5(3): 68-88 (2021)

generated, then analysis projects like this may be applied to larger projects with more
differentiation from which to model, making landscape-scale patterns easier to detect.
The implications of looking at broader scales for patterns using RDA that otherwise would not be
detectable using MSOM are significant. The results demonstrate the large-scale detectability
patterns for carnivore species that otherwise were not apparent from running MSOM. While there
are many implications to not including imperfect detection into the analysis and collating data
across years for one response column of data, it appears in this study that any patterns in species
richness that was to be detected were only available at larger scales. This also indicates that the
data for MSOM may require much larger samples across a larger area to perform adequately at
the small temporal scales that it operates and including imperfect detection.

Conclusions
The analysis presented in this paper utilizes redundancy analysis (RDA) and multispecies
occupancy (MSOM) as an exploratory analysis to determine covariate effects on the carnivore
community. The exploratory data analysis RDA showed significant results with anthropogenic
covariates for high distance to roads and plantations and medium distance to villages with higher
carnivore detections. MSOM was intended to model species richness on the landscape given
covariates. However, the results were not consistent. Despite the low detection frequency of many
species in the study, this camera trapping study enabled us to include these rare carnivores and
imperfect detection into our species richness models. The model selection log pointwise
predictive density (lppd), Watanabe-Akaike information criterion (WAIC) and Conditional
Predictive Ordinate Criterion (CPO), and evaluation metrics (Deviance, Area under Curve (AUC)
and Brier's Log) assisted in further understanding the effect of covariate information on the
carnivore community as a whole. MSOM was unable to make definitive conclusions about the
carnivore community across various spatial and temporal scales, as the models that produced
marginal significance had covariate estimates that were not consistently positive or negative
between years. The results indicate that species richness patterns were detectable across large
spatial and temporal scales using the RDA after collating all detections across seven years and
binning covariates, whereas finer temporal scales using the MSOM for survey days and months
and including imperfect detection were unable to make meaningful conclusions.
Acknowledgments: We are grateful to the TEAM network and William McCarthy to freely
download the camera trap data from Bukit Barisan Selatan NP. Thank you to FiBER and the
Center for Landscape Conservation Planning to support dissertation research and graduate
teaching assistantship. Special thanks to reviewers for taking the time to comment. This work was
supported by the Florida Institute for Built Environment Resilience and the University of Florida,
Gainesville, FL.

References
Allen, M. L., Sibarani, M. C., Utoyo, L., & Krofel, M. (2020). Terrestrial mammal community
 richness and temporal overlap between tigers and other carnivores in Bukit Barisan
84 | Journal of Wildlife and Biodiversity 5 (3): 68-88 (2021)

 Selatan National Park, Sumatra. Animal Biodiversity and Conservation, 97–107.
 https://doi.org/10.32800/abc.2020.43.0097
Borcard, D., Gillet, F., & Legendre, P. (2011). Numerical ecology with R. Springer.
Boron, V., Deere, N. J., Xofis, P., Link, A., Quiñones-Guerrero, A., Payan, E., & Tzanopoulos, J.
 (2019). Richness, diversity, and factors influencing occupancy of mammal communities
 across human-modified landscapes in Colombia. Biological Conservation, 232, 108–116.
 https://doi.org/10.1016/j.biocon.2019.01.030
Broms, K. M., Hooten, M. B., & Fitzpatrick, R. M. (2016). Model selection and assessment for
 multispecies occupancy models. Ecology, 97(7), 1759–1770. https://doi.org/10.1890/15-
 1471.1
Cavada, N., Worsøe Havmøller, R., Scharff, N., & Rovero, F. (2019). A landscape-scale
 assessment of tropical mammals reveals the effects of habitat and anthropogenic
 disturbance on community occupancy. PLOS ONE, 14(4), e0215682.
 https://doi.org/10.1371/journal.pone.0215682
Davis, C. L., Rich, L. N., Farris, Z. J., Kelly, M. J., Di Bitetti, M. S., Blanco, Y. D., Albanesi, S.,
 Farhadinia, M. S., Gholikhani, N., Hamel, S., Harmsen, B. J., Wultsch, C., Kane, M. D.,
 Martins, Q., Murphy, A. J., Steenweg, R., Sunarto, S., Taktehrani, A., Thapa, K., …
 Miller, D. A. W. (2018). Ecological correlates of the spatial co-occurrence of sympatric
 mammalian carnivores worldwide. Ecology Letters, 21(9), 1401–1412.
 https://doi.org/10.1111/ele.13124
Dechner, A., Flesher, K. M., Lindell, C., Vega de Oliveira, T., & Maurer, B. A. (2018).
 Determining carnivore habitat use in a rubber/forest landscape in Brazil using
 multispecies occupancy models. PLOS ONE, 13(4), e0195311.
 https://doi.org/10.1371/journal.pone.0195311
Dorazio, R. M., & Royle, J. A. (2005). Estimating Size and Composition of Biological
 Communities by Modeling the Occurrence of Species. Journal of the American Statistical
 Association, 100(470), 389–398. https://doi.org/10.1198/016214505000000015
Dray, S., Pélissier, R., Couteron, P., Fortin, M.-J., Legendre, P., Peres-Neto, P. R., Bellier, E.,
 Bivand, R., Blanchet, F. G., De Cáceres, M., Dufour, A.-B., Heegaard, E., Jombart, T.,
 Munoz, F., Oksanen, J., Thioulouse, J., & Wagner, H. H. (2012). Community ecology in
 the age of multivariate multiscale spatial analysis. Ecological Monographs, 82(3), 257–
 275. https://doi.org/10.1890/11-1183.1
Easter, T., Bouley, P., & Carter, N. (2019). Opportunities for biodiversity conservation outside of
 Gorongosa National Park, Mozambique: A multispecies approach. Biological
 Conservation, 232, 217–227. https://doi.org/10.1016/j.biocon.2019.02.007
Gibson, L., Lee, T. M., Koh, L. P., Brook, B. W., Gardner, T. A., Barlow, J., Peres, C. A.,
 Bradshaw, C. J. A., Laurance, W. F., Lovejoy, T. E., & Sodhi, N. S. (2011). Primary
 forests are irreplaceable for sustaining tropical biodiversity. Nature, 478(7369), 378–381.
 https://doi.org/10.1038/nature10425
Goijman, A. P., Conroy, Michael. J., Bernardos, J. N., & Zaccagnini, M. E. (2015). Multi-Season
 Regional Analysis of Multi-Species Occupancy: Implications for Bird Conservation in
85 | Journal of Wildlife and Biodiversity 5(3): 68-88 (2021)

 Agricultural Lands in East-Central Argentina. PLOS ONE, 10(6), e0130874.
 https://doi.org/10.1371/journal.pone.0130874
Hooten, M. B., & Hobbs, N. T. (2015). A guide to Bayesian model selection for ecologists.
 Ecological Monographs, 85(1), 3–28. https://doi.org/10.1890/14-0661.1
Jaya, I. N. S., Wijanarto, A. B., & Wibisono, H. T. (n.d.). Deforestation and it is Implications for
 Sumatran tigers in Bukit Barisan Selatan National Park, Sumatra (Deforestasi dan
 Implikasinya terhadap Populasi Harimau Sumatra di Taman Nasional Bukit Barisan
 Selatan, Sumatra). 9.
Jiménez, J., Nuñez-Arjona, J. C., Rueda, C., González, L. M., García-Domínguez, F., Muñoz-
 Igualada, J., & López-Bao, J. V. (2017). Estimating carnivore community structures.
 Scientific Reports, 7(1), 41036. https://doi.org/10.1038/srep41036
Kellner, K. (2019). Package "jagsUI." CRAN Repository.
Korkmaz, S., Goksulul, D., & Zararsiz, G. (2019). Package 'MVN: Multivariate Normality Tests".
 CRAN Repository.
Lantschner, M. V., Rusch, V., & Hayes, J. P. (2012). Habitat use by carnivores at different spatial
 scales in a plantation forest landscape in Patagonia, Argentina. Forest Ecology and
 Management, 269, 271–278. https://doi.org/10.1016/j.foreco.2011.12.045
Laurance, W. F., Sayer, J., & Cassman, K. G. (2014). Agricultural expansion and its impacts on
 tropical nature. Trends in Ecology & Evolution, 29(2), 107–116.
 https://doi.org/10.1016/j.tree.2013.12.001
MacKenzie, D. I., Nichols, J. D., Lachman, G. B., Droege, S., Andrew Royle, J., & Langtimm, C.
 A. (2002). Estimating site occupancy rates when detection probabilities are less than one.
 Ecology, 83(8), 2248–2255. https://doi.org/10.1890/0012-
 9658(2002)083[2248:ESORWD]2.0.CO;2
McCarthy, J. L., Wibisono, H. T., McCarthy, K. P., Fuller, T. K., & Andayani, N. (2015).
 Assessing the distribution and habitat use of four felid species in Bukit Barisan Selatan
 National Park, Sumatra, Indonesia. Global Ecology and Conservation, 3, 210–221.
 https://doi.org/10.1016/j.gecco.2014.11.009
McShea, W. J., Forrester, T., Costello, R., He, Z., & Kays, R. (2016). Volunteer-run cameras as
 distributed sensors for macrosystem mammal research. Landscape Ecology, 31(1), 55–66.
 https://doi.org/10.1007/s10980-015-0262-9
Moore, J. F., Mulindahabi, F., Masozera, M. K., Nichols, J. D., Hines, J. E., Turikunkiko, E., &
 Oli, M. K. (2018). Are ranger patrols effective in reducing poaching-related threats
 within protected areas? Journal of Applied Ecology, 55(1), 99–107.
 https://doi.org/10.1111/1365-2664.12965
O'Brien, T. G., & Kinnaird, M. F. (1996). Birds and mammals of the Bukit Barisan Selatan
 National Park, Sumatra, Indonesia. Oryx, 30(3), 207–217.
 https://doi.org/10.1017/S0030605300021657
86 | Journal of Wildlife and Biodiversity 5 (3): 68-88 (2021)

O'Brien, T. G., Kinnaird, M. F., & Wibisono, H. T. (2003). Crouching tigers, hidden prey:
 Sumatran tiger and prey populations in a tropical forest landscape. Animal Conservation,
 6(2), 131–139. https://doi.org/10.1017/S1367943003003172
Oksanen, J., Guillaume Blanchet, F., Friendly, M., Kindt, R., Legendre, P., McGlinn, D., Minchin,
 P., O'Hara, R. B., Simpson, G., Solymos, P., Stevens, H., Szoecs, E., & Wagner, H.
 (2019). Package "vegan." CRAN Repository.
Ovaskainen, O., Abrego, N., Halme, P., & Dunson, D. (2016). Using latent variable models to
 identify large networks of species-to-species associations at different spatial scales.
 Methods in Ecology and Evolution, 7(5), 549–555. https://doi.org/10.1111/2041-
 210X.12501
Pacifici, K., Zipkin, E. F., Collazo, J. A., Irizarry, J. I., & DeWan, A. (2014). Guidelines for a
 priori grouping of species in hierarchical community models. Ecology and Evolution,
 4(7), 877–888. https://doi.org/10.1002/ece3.976
Pettorelli, N., Lobora, A. L., Msuha, M. J., Foley, C., & Durant, S. M. (2010). Carnivore
 biodiversity in Tanzania: Revealing the distribution patterns of secretive mammals using
 camera traps. Animal Conservation, 13(2), 131–139. https://doi.org/10.1111/j.1469-
 1795.2009.00309.x
Pusparini, W., Batubara, T., Surahmat, F., Ardiantiono, Sugiharti, T., Muslich, M., Amama, F.,
 Marthy, W., & Andayani, N. (2018). A pathway to recovery: The Critically Endangered
 Sumatran tiger Panthera tigris sumatrae in an 'in danger' UNESCO World Heritage Site.
 Oryx, 52(1), 25–34. https://doi.org/10.1017/S0030605317001144
Rao, C. R. (1964). The Use and Interpretation of Principal Component Analysis in Applied
 Research. 31.
Rezaei, S., Mohammadi, A., Cushman, S. A., Bencini, R., Rooney, T., & Naderi, M. (2021).
 Landscape connectivity for two sympatric carnivores in central Iran [Preprint]. Preprints.
 https://doi.org/10.22541/au.161153950.09782632/v1
Rich, L. N., Miller, D. A. W., Robinson, H. S., McNutt, J. W., & Kelly, M. J. (2017). Carnivore
 distributions in Botswana are shaped by resource availability and intraguild species.
 Journal of Zoology, 303(2), 90–98. https://doi.org/10.1111/jzo.12470
Ripple, W. J., Chapron, G., López-Bao, J. V., Durant, S. M., Macdonald, D. W., Lindsey, P. A.,
 Bennett, E. L., Beschta, R. L., Bruskotter, J. T., Campos-Arceiz, A., Corlett, R. T.,
 Darimont, C. T., Dickman, A. J., Dirzo, R., Dublin, H. T., Estes, J. A., Everatt, K. T.,
 Galetti, M., Goswami, V. R., … Zhang, L. (2016). Saving the World's Terrestrial
 Megafauna. BioScience, 66(10), 807–812. https://doi.org/10.1093/biosci/biw092
Ripple, W. J., Wolf, C., Newsome, T. M., Hoffmann, M., Wirsing, A. J., & McCauley, D. J.
 (2017). Extinction risk is most acute for the world's largest and smallest vertebrates.
 Proceedings of the National Academy of Sciences, 114(40), 10678–10683.
 https://doi.org/10.1073/pnas.1702078114
Rodrigues, A. S., Brooks, T. M., Butchart, S. H., Chanson, J., Cox, N., Hoffmann, M., & Stuart, S.
 N. (2014). Spatially explicit trends in the global conservation status of vertebrates. PLoS
 One, 9(11), e113934.
87 | Journal of Wildlife and Biodiversity 5(3): 68-88 (2021)

Rota, C. T., Wikle, C. K., Kays, R. W., Forrester, T. D., McShea, W. J., Parsons, A. W., &
 Millspaugh, J. J. (2016). A two-species occupancy model accommodating simultaneous
 spatial and interspecific dependence. Ecology, 97(1), 48–53.
Rovero, F., Martin, E., Rosa, M., Ahumada, J. A., & Spitale, D. (2014). Estimating Species
 Richness and Modelling Habitat Preferences of Tropical Forest Mammals from Camera
 Trap Data. PLoS ONE, 9(7), e103300. https://doi.org/10.1371/journal.pone.0103300
Schuette, P., Wagner, A. P., Wagner, M. E., & Creel, S. (2013). Occupancy patterns and niche
 partitioning within a diverse carnivore community exposed to anthropogenic pressures.
 Biological Conservation, 158, 301–312. https://doi.org/10.1016/j.biocon.2012.08.008
Steenweg, R., Hebblewhite, M., Kays, R., Ahumada, J., Fisher, J. T., Burton, C., Townsend, S. E.,
 Carbone, C., Rowcliffe, J. M., Whittington, J., Brodie, J., Royle, J. A., Switalski, A.,
 Clevenger, A. P., Heim, N., & Rich, L. N. (2017). Scaling-up camera traps: Monitoring
 the planet's biodiversity with networks of remote sensors. Frontiers in Ecology and the
 Environment, 15(1), 26–34. https://doi.org/10.1002/fee.1448
Sutherland, C., Brambilla, M., Pedrini, P., & Tenan, S. (2016). A multi-region community model
 for inference about geographic variation in species richness. Methods in Ecology and
 Evolution, 7(7), 783–791. https://doi.org/10.1111/2041-210X.12536
Van der Weyde, L. K., Mbisana, C., & Klein, R. (2018). Multispecies occupancy modeling of a
 carnivore guild in wildlife management areas in the Kalahari. Biological Conservation,
 220, 21–28. https://doi.org/10.1016/j.biocon.2018.01.033
Wearn, O. R., Carbone, C., Rowcliffe, J. M., Pfeifer, M., Bernard, H., & Ewers, R. M. (2019).
 Land-use change alters the mechanisms assembling rainforest mammal communities in
 Borneo. Journal of Animal Ecology, 88(1), 125–137. https://doi.org/10.1111/1365-
 2656.12903
Wearn, O. R., Rowcliffe, J. M., Carbone, C., Pfeifer, M., Bernard, H., & Ewers, R. M. (2017).
 Mammalian species abundance across a gradient of tropical land-use intensity: A
 hierarchical multispecies modeling approach. Biological Conservation, 212, 162–171.
 https://doi.org/10.1016/j.biocon.2017.05.007
Yamaura, Y., Blanchet, F. G., & Higa, M. (2019). Analyzing community structure subject to
 incomplete sampling: Hierarchical community model vs. canonical ordinations. Ecology,
 100(8). https://doi.org/10.1002/ecy.2759
Zipkin, E. F., Andrew Royle, J., Dawson, D. K., & Bates, S. (2010). Multispecies occurrence
 models to evaluate the effects of conservation and management actions. Biological
 Conservation, 143(2), 479–484. https://doi.org/10.1016/j.biocon.2009.11.016
Zipkin, E. F., DeWan, A., & Andrew Royle, J. (2009). Impacts of forest fragmentation on species
 richness: A hierarchical approach to community modelling. Journal of Applied Ecology,
 46(4), 815–822. https://doi.org/10.1111/j.1365-2664.2009.01664.x
Zipkin, E. F., Grant, E. H. C., & Fagan, W. F. (2012). Evaluating the predictive abilities of
 community occupancy models using AUC while accounting for imperfect detection.
 Ecological Applications, 22(7), 1962–1972. https://doi.org/10.1890/11-1936.1
You can also read