Persistence and accumulation of environmental DNA from an endangered dragonfly
←
→
Page content transcription
If your browser does not render page correctly, please read the page content below
www.nature.com/scientificreports
OPEN Persistence and accumulation
of environmental DNA
from an endangered dragonfly
Kristie J. Schmidt*, Daniel A. Soluk, Sarah E. Mays Maestas & Hugh B. Britten
Detection of environmental DNA (eDNA) has become a commonly used surveillance method
for threatened or invasive vertebrates in both aquatic and terrestrial environments. However,
most studies in this field favor vertebrate target species. Environmental DNA protocols can be
especially useful for endangered invertebrates such as the Hine’s emerald dragonfly (Somatochlora
hineana) where conservation efforts have been greatly hindered by training, time, overall costs,
and environmental impacts associated with conducting surveys in the calcareous fens occupied by
this species. An essential step in developing such a protocol is to evaluate the dynamics of eDNA
concentration under controlled conditions. We used the quantitative polymerase chain reaction
(qPCR) to examine seasonal shifts in the persistence and net-accumulation of eDNA from captive S.
hineana larvae in experimental mesocosms at temperatures corresponding with their overwintering
(5.0 °C) and active (16.0 °C) seasons. Environmental DNA persisted longer at 5.0 °C but accumulated
more readily at 16.0 °C. Differences in the accumulation and persistence of eDNA reflect differences in
the longevity of eDNA at different temperatures and seasonal differences in larval S. hineana behavior.
This study highlights the importance of considering how seasonal changes in temperature influence
not only the speed of eDNA degradation but also the target species’ eDNA shedding rates.
We developed environmental DNA (eDNA) detection protocols to assist in habitat identification for conserva-
tion for the US federally endangered Hine’s emerald dragonfly (Somatochlora hineana). Larval S. hineana have
been observed in groundwater-fed calcareous fen habitats in Illinois, Wisconsin, Michigan, and Missouri in the
USA, and Ontario, Canada. Habitat destruction and fragmentation have been the primary cause of S. hineana
population decline1. Therefore, a key part of conservation efforts to benefit S. hineana is the identification and
protection of any remaining habitat areas. Conventional sampling for the presence of S. hineana often includes
both adult and larval sampling.
Larval S. hineana surveys include benthic-sampling and the pumping of crayfish burrows. Larval S. hineana
are most often found in the burrows of Cambarus (= Lacunicambarus) diogenes throughout the year and are
almost exclusively found in C. diogenes burrows during their overwintering p eriod2. Comprehensive larval sur-
veys can take months to complete, require intensive training of field personnel, are reliant on favorable weather
conditions, and are only effective if late instar larvae can be collected for identification. Adult S. hineana surveys
are difficult due to short flight season, habitat segregation by sex, large potential flight range (adults can range
for many kilometers from larval habitat), risk of harm when netting adult dragonflies, and difficulty observing
genitalia characteristics necessary for accurate species identification when in fl ight1.
Given the restrictions of conventional sampling techniques, there has been a great need to develop a method
to expedite field site identification. Environmental DNA can be used to guide and prioritize locations for conven-
tional surveying methods, increasing the speed at which habitats can be identified for protection and restoration.
Environmental DNA (eDNA) is a relatively new surveillance method used to detect the presence of a spe-
cies within a habitat by collecting environmental samples (e.g., soil and water) that contain cell fragments and
exogenous DNA3. Mitochondrial genes, which are more plentiful and have a higher resistance to degradation
than nuclear genes, are targeted and amplified to determine species presence or absence4–7.
Currently, there is a taxonomic skew toward fish, amphibian, and mollusk eDNA studies7,8 suggesting the need
to determine if eDNA methods can be useful for detecting aquatic insects. Environmental DNA analysis from
27 taxa of freshwater arthropods had been published as of 2019; some of these taxa include Procambarus clarkii,
Pacifastacus leniusculus, and Gammarus pulex8. Additionally, the critically endangered plecopteran Isogenus
nubecula was detected using eDNA methods9.
University of South Dakota, Vermillion, SD, USA. *email: Kristie.Schmidt@uky.edu
Scientific Reports | (2021) 11:18987 | https://doi.org/10.1038/s41598-021-98099-1 1
Vol.:(0123456789)
www.nature.com/scientificreports/
The potential advantages of using eDNA rather than traditional surveying methods include the reduction of
field labor h ours10, reduced impact to sensitive h abitats7, and a lower threshold of d etection11,12. Additionally,
eDNA has proven to be an effective tool when traditional methods require timely/costly surveying efforts6 and
for detecting cryptic invasive s pecies10.
Although there is always some risk of damaging the habitat when studying a system, environmental DNA
sampling (i.e., water, soil, ice) is much less invasive and has far less potential for harming native and endangered
species than many traditional surveying m ethods7. For example, electrofishing can cause damage in the form of
removing/killing fish from the sample s ite13. Traditional sampling methods for larval populations of S. hineana
include benthic sampling (monitoring populations in stream beds) and burrow-pumping (a novel technique used
to locate larvae within crayfish burrows)2. These techniques can disrupt flow patterns within shallow streams,
collapse burrows, and harm/kill sampled individuals.
While there has been some speculation that eDNA sampling may have high false-positive rates due to ancient
DNA contamination from extirpated populations, studies show that eDNA typically becomes undetectable in
water within 1–44 days after source removal10,14–21 and approximately 144 days in soil22. This suggests that eDNA
surveys are contemporaneous and can be used to inform conservation efforts.
Environmental DNA degradation is likely more complex in a field setting, and the persistence (defined here
as the length of time eDNA remains detectable within a habitat or mesocosm) and net-accumulation (defined
here as the difference between the amount of eDNA produced and the amount of eDNA degraded over time)
are likely to vary depending on numerous factors that alter source/sink dynamics3. Spatiotemporal dynamics are
especially important in affecting the persistence and accumulation of eDNA in the field and need to be accounted
for when developing eDNA m ethodologies23. Concentrations of eDNA may fluctuate spatially and/or temporally
as a result of fluctuations in biomass18,24,25, transport through a flowing s ystem17,26–28, age structuring of target
populations7,16, feeding a ctivity29, life-history e vents5, seasonal habitat p
reference13,30, water t emperature24,31–33,
hydrology13,27, inhibition13,27, and microbial activity34. Some studies show that water pH affects eDNA degrada-
tion rates19, while others do not35. Similarly, some studies show that UV light exposure affects eDNA degradation
rates17, while others show no such e ffect36.
In this study, we focused on the effects that seasonal shifts in temperature have on the persistence and net-
accumulation of larval S. hineana eDNA. Since temperature drives the production of eDNA through metabolic
processes31 and directly alters the rate of microbial degradation of e DNA32, it may be the most important variable
driving seasonal shifts in eDNA detection.
Somatochlora hineana larval molting activity varies with seasonal changes, the net-accumulation of S. hineana
eDNA within a habitat. Adult S. hineana females lay eggs within streams and streamlets during their flight period
(July–early August). Eggs typically mature over winter. In the following year, hatching of pro-larva from eggs
occurs between April and June. All S. hineana larvae go through approximately 12 larval instars (F-11 to F-0).
The first 6 larval instars (F-11 through F-6) occur rapidly within the first year, and the final 6 (F-5 through F-0)
occur more slowly over a period of 2–4 y ears1. Since S. hineana larvae take several years to fully mature, they
survive overwintering in shallow, partially frozen streams within Cambarus (= Lacunicambarus) diogenes crayfish
burrows. While S. hineana larvae overwinter within burrows, they rarely consume food or molt, thus reducing
the amount of eDNA shed2.
The net-accumulation of larval S. hineana eDNA was likely to increase with increasing temperatures2,31,37,
while the persistence of larval S. hineana eDNA was likely to decrease with increasing t emperatures32. Therefore,
we assessed the seasonal shift in persistence and net-accumulation of larval S. hineana eDNA in temperature-
controlled mesocosms that reflect the larval overwintering period (5.0 °C) and the larval active period (16.0 °C).
This study provided preliminary information regarding the seasonal shift in eDNA production for larval S.
hineana. Understanding the seasonal dynamics of larval S. hineana eDNA is vital for efficient detection of this
rare aquatic species using eDNA protocols. Our mesocosm results have informed subsequent field sampling of
S. hineana eDNA.
Results
Quality control. No extraction blank or no-template-control tested positive, indicating no contamination.
All positive and spiked positive controls tested positive, indicating no inhibition or reagent failure. Average
standard curve r 2 values, which measure replicate reproductivity, were r 2 = 0.96 and r2 = 0.98 for CYTb/FAM and
COX3/HEX, respectively. Average amplification efficiency, determined by the slope of the standard curve, was
97.76% and 98.61% for CYTb/FAM and COX3/HEX, respectively. The limit of detection (LOD) for CYTb and
COX3 with four sample replicates was 2 copies/µL and 20 copies/µL respectively (unpublished data).
Net accumulation of S. hineana eDNA. At 16.0 °C, containers holding S. hineana larvae in the large
size class (approx. 0.33 g) accumulated significantly more eDNA than those with larvae in the medium size class
(approx. 0.06 g) (linear mixed effects, n = 64, df = 375, p < 0.01) and in the small size class (approx. 0.01 g) (linear
mixed effects, n = 64, df = 375, p < 0.001). Containers holding small and medium size class larvae accumulated
comparable amounts of eDNA (linear mixed effects, n = 64, df = 375, p = 0.20). At 5.0 °C, containers holding
larvae in the medium size class accumulated significantly more eDNA than those containers holding larvae in
the large size class (linear mixed effects, n = 64, df = 375, p = 0.04). There was no difference in the accumulation
among large and small (linear mixed effects, n = 64, df = 375, p = 0.45) or small and medium (linear mixed effects,
n = 64, df = 375, p = 0.19) larval size classes.
At 16.0 °C, the concentration of S. hineana eDNA increased significantly between days 5 and 10 (linear mixed
effects, n = 96, df = 375, p < 0.001; Fig. 1a; Table 1). At 5.0 °C, there was no significant change in concentration of
S. hineana eDNA between days 5 and 10 (linear mixed effects, n = 64, df = 375, p = 0.37 Fig. 1b; Table 1).
Scientific Reports | (2021) 11:18987 | https://doi.org/10.1038/s41598-021-98099-1 2
Vol:.(1234567890)www.nature.com/scientificreports/
Figure 1. Significant accumulation (p < 0.001) in S. hineana eDNA concentrations at 16 °C between 5 and
10 days post water change. No significant change in S. hineana eDNA concentrations at 5 °C between 5 and
10 days post water change (p = 0.37). Shape indicates gene target (COX3, CYTb). Black shapes indicate average
quantification for each target. Red, green, and blue shapes indicate quantifications for large, medium, and small
size classes, respectively. Points are graphed on a pseudo-log scale (0.1–2500) with break points at (0, 1, 10, 25,
50, 100, 250, 500, 1000, and 2500).
Treatment Target Day 5 Day 10
COX3: 14.31 copies/μL 122.04 copies/μL
Net accumulation 16.0 °C
CYTb: 19.07 copies/μL 247.76 copies/μL
COX3: 33.65 copies/μL 62.10 copies/μL
Net accumulation 5.0 °C
CYTb: 36.25 copies/μL 76.50 copies/μL
Table 1. Average Somatochlora hineana eDNA concentrations—accumulation experiment.
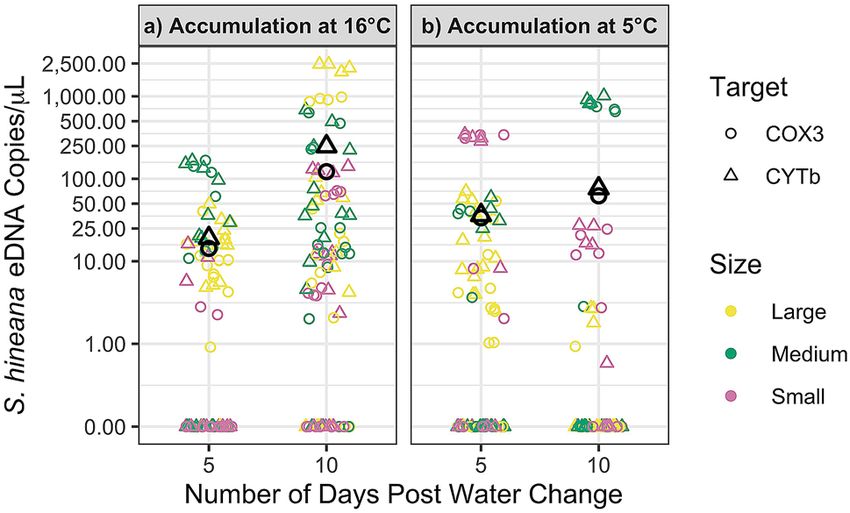
Figure 2. Significant decrease in S. hineana eDNA concentrations at 16 °C (p < 0.01) and 5 °C (p < 0.001)
between 1 and 15 days post larval removal. Shape indicates gene target (COX3, CYTb). Red shapes indicate
average quantification for each target.
Persistence of S. hineana eDNA. At 16.0 °C, average concentrations of S. hineana eDNA significantly
decreased between days 1 and 15 (linear mixed effects [ln(Quantity + 1)], day 1 n = 16, day, day 15 n = 32,
df = 232, p < 0.01; Fig. 2a; Table 2). Larval S. hineana eDNA decayed exponentially with an alpha decay rate of
0.83 (Fig. 3a). At 5.0 °C, the average concentration of S. hineana eDNA significantly decreased between days
1 and 15 (linear mixed effects [ln(Quantity + 1)], n = 32, df = 232, p < 0.001; Fig. 2b; Table 2). Larval S. hineana
eDNA decayed exponentially with an alpha decay rate of 0.55 (non-linear least squares model, Fig. 3b).
Discussion
This study of S. hineana eDNA persistence and net-accumulation provides an example of one of the first applica-
tions of using emerging eDNA detection technology for the conservation of an endangered dragonfly (Odonata).
We studied seasonal shifts in eDNA concentrations under controlled conditions at environmentally relevant
Scientific Reports | (2021) 11:18987 | https://doi.org/10.1038/s41598-021-98099-1 3
Vol.:(0123456789)www.nature.com/scientificreports/
Treatment Target Day 1 Day 5 Day 10 Day 15
COX3: 2.99 copies/μL 0.44 copies/μL 0.47 copies/μL 0.00 copies/μL
Persistence 16.0 °C
CYTb: 7.01 copies/μL 0.20 copies/μL 0.16 copies/μL 0.00 copies/μL
COX3: 47.79 copies/μL 9.07 copies/μL 2.09 copies/μL 2.94 copies/μL
Persistence 5.0 °C
CYTb: 53.90 copies/μL 6.75 copies/μL 0.81 copies/μL 4.16 copies/μL
Table 2. Average Somatochlora hineana eDNA concentrations—persistence experiment.
Figure 3. Exponential decay of S. hineana eDNA at 16 °C (α = 0.83) and 5 °C (α = 0.55) days 1, 5, 10, and 15
post larval removal. Note: parts (a) and (b) display different y-axes.
temperatures. Our eDNA mesocosm results have been used to plan the timing of field sampling in our S. hineana
study areas in Illinois and Wisconsin, two areas with different annual temperature profiles.
Although organisms like fish readily shed mucous and/or epithelial cells during periods of inactivity, organ-
isms with an exoskeleton are more conservative in eDNA shedding rates, making them more difficult to detect12.
The primary source of eDNA from living S. hineana is from molting and the production of fecal matter37. Our
results indicate that overwintering larvae rarely shed eDNA. Additionally, eDNA persists longer at overwinter-
ing temperatures but has greater net-accumulation at temperatures when larvae are active. Therefore, eDNA
sampling for larval S. hineana populations is likely more efficient in the spring/summer than in the fall/winter.
Results from our persistence experiment are consistent with other studies indicating that eDNA does not
persist in a system beyond several weeks10,14,16,20, and that eDNA degrades more quickly at higher temperatures24.
These results are also consistent with other eDNA studies indicating that eDNA degrades exponentially over
time4,17,18. Our results indicated that eDNA signals are contemporaneous, reflecting recent eDNA production.
When water temperatures are near 5.0 °C, S. hineana eDNA signals can be detected 2 weeks after shedding.
However, our exponential decay curve (Fig. 3b) suggested that eDNA concentrations neared the limit of detection
for CYTb within 10 days (LOD: 2 copies/µL) and within 5 days for COX3 (LOD: 20 copies/µL). This suggests
that larval S. hineana eDNA is unlikely to persist at a detectable level in the environment after 2 weeks, even at
overwintering temperatures. Therefore, assuming this pattern applied to field-collected eDNA samples, larval
S. hineana eDNA results are contemporaneous.
Previous studies indicated that eDNA shedding rates can vary among older/younger and smaller/larger
individuals. Some studies suggest that smaller individuals produce more eDNA than larger individuals due to
rapid rates of development and m olting12, while other studies suggest that eDNA production increases with
biomass18,24. Our results showed that variation in eDNA shedding rates were season- or temperature dependent.
At 16.0 °C, large larvae produced more eDNA than medium or small larvae, suggesting that eDNA production
increases with biomass. However, at 5.0 °C medium larvae produced more eDNA than large larvae, indicating
that medium sized individuals were more metabolically active than larger individuals while overwintering.
Consistent with studies indicating that eDNA shedding rates increase with higher temperatures24,33, S. hineana
eDNA accumulated more readily over time in our 16.0 °C mesocosms than in our 5.0 °C mesocosms. Just as
behavioral changes in other invertebrate species affect eDNA shedding r ates16, the decreased rate of eDNA
production by S. hineana larvae is likely associated with the reduction of activity among S. hineana larvae later
in the season at overwintering temperatures. Preliminary field sample analysis suggests that our qualitative
predictions of seasonal eDNA concentrations deduced from these mesocosm experiments are borne out in S.
hineana habitat38.
These results suggest that it is more important to consider the effects that seasonal changes, including tem-
perature, have on behavior (e.g., molting and overwintering) rather than the effects of temperature on eDNA
persistence (e.g., microbial decay) when planning efficient eDNA sampling periods. Determining the most
efficient time to detect target DNA is especially important for organisms with an exoskeleton, which generally
produce small quantities of eDNA7,8,12. Given this, we expect that field detection of larval S. hineana eDNA will
be less efficient when water temperatures are low enough to induce overwintering behaviors.
However, additional life history characteristics such as emergence have also been shown to impact seasonal
eDNA concentrations5. Therefore, we predict that summer (after hatching and prior to emergence) would be the
Scientific Reports | (2021) 11:18987 | https://doi.org/10.1038/s41598-021-98099-1 4
Vol:.(1234567890)www.nature.com/scientificreports/
most efficient time to detect S. hineana eDNA in the field. This trend likely describes eDNA detection efficiency
for all aquatic invertebrates with life-histories similar to S. hineana.
To test this, we developed field experiments to document temporal variation in eDNA concentration over
several months at sites with known S. hineana occupancy and detected eDNA concentrations comparable to
those reported in this study38. For field samples, we increased sample volumes to reduce the risk of false-negative
results when sampling from a highly dilute environment36. Since one study showed that qPCR methods were
ineffective at detecting eDNA from endangered aquatic insects due to i nhibition9, we continued to monitor for
inhibition in field samples using “spiked” controls containing a mixture of sample and positive control t emplate38.
During efficient sampling periods (e.g., summer months), eDNA can be a useful tool in the identification of
S. hineana habitat. Environmental DNA results can be used to prioritize sites for traditional surveying methods,
significantly increasing the efficiency of habitat detection and assessment. Similar eDNA projects may also be
beneficial in habitat identification of many other threatened, endangered or invasive aquatic invertebrates.
Methods
Larvae used for this study had been reared from eggs over the course of 1–3 years from S. hineana females
obtained at sites in Wisconsin and Illinois as part of a captive rearing program. All larvae and eggs of S. hineana
were handled according to Federal Fish and Wildlife Native Endangered Species Permit (TE805269-15) issued to
D. Soluk. Once larvae reached their 6th instar (F-5, F-6), they were individually held in 120 mL capacity specimen
cups that were filled with approximately 80 mL of water. Larvae were kept in oxygenated water that was collected
from a shallow well in Door County, WI. This water was similar to the groundwater that feeds larval habitat areas
but had never come into contact with S. hineana DNA prior to addition to the specimen cups.
In the fall, the larvae were kept at 16.0 °C and were regularly fed a diet of amphipods and larval chironomids.
Larvae were given regular water changes every 2–6 weeks. At experimental day 0 for the 16.0 °C trial, water
was removed from specimen cups, combined, placed into beakers for the persistence experiment, and replaced
with fresh water. Following the experiments at 16.0 °C, the water surrounding the larvae was adjusted over a
period of 2–3 weeks down to 5 °C leading up to S. hineana’s overwintering period. Since we have observed that
S. hineana larvae do not consume prey while overwintering at 5 °C, larvae at this temperature were not fed. At
experimental day 0 for the 5.0 °C trial, water was removed from specimen cups, combined, placed into beakers
for the persistence experiment, and replaced with fresh water. Experiments were conducted in this manner two
years in a row. Sixty milliliter water samples were taken with a syringe and immediately filtered through 0.45 µm
25 mm Whatman Nitro-Cellulose Filters for future eDNA extraction. Specimen cups and beakers were gently
nutated prior to sample collection to homogenize eDNA concentration throughout the container.
Net accumulation sample collection. To measure the net-accumulation of S. hineana eDNA at 16.0 °C
and 5.0 °C, we filtered 60 mL water samples from larval specimen cups 5 and 10 days post water change. Six lar-
vae were selected on each collection day to provide samples. Two larvae from each of three size classes were cho-
sen: large (instar class F-0 to F-1, approximately 0.33 g live mass), medium (instar class F-2 to F-3, approximately
0.06 g live mass), and small (instar class F-4 to F-6, approximately 0.01 g live mass). Different larvae were chosen
at days 5 and 10 post water change. Each larval specimen cup was only sampled once during this experiment.
Persistence sample collection. To measure persistence of S. hineana eDNA at 16.0 °C and 5.0 °C, water
and debris removed from all specimen cups during the water change at day 0 of the accumulation experiment
were combined and placed in one of two beakers. The two beakers were considered replicates and stored in iden-
tical conditions. At days 1, 5, 10, and 15 post larval removal, 60 mL water samples were taken from each beaker
which contained approximately 600 mL of water. Filtered water was not returned to the beaker after sampling.
Sample extraction. We extracted sample filters using the QIAGEN DNeasy Blood and Tissue Kit com-
monly used for eDNA s tudies17,25. Approximately ½ of each filter was extracted, and the other ½ of each filter
was stored in 75% ethanol at room temperature as a voucher. For every set of extractions, one extraction blank
using only reagents and no sample was also processed to ensure that the reagents used were not contaminated.
The ½ of the filter intended for extraction was further cut into thirds to increase lysis buffer exposure throughout
the filter. These pieces were placed in open microcentrifuge tubes and allowed to dry in a fumigation hood until
all of the ethanol had evaporated from the sample (approximately 6–12 h). Two alterations were made to the
QIAGEN Spin Column—Animal Tissue Protocol: (1) QIAGEN Mini-Prep Spin Columns were used after sam-
ple lysis and before the precipitation of DNA with Buffer AL and 100% ethanol; (2) Samples were eluted using
100 μL of elution buffer twice for an end volume of 200 μL.
qPCR. Environmental DNA primers, probes, and g-block specific to S. hineana were developed at the US
Geological Survey’s Upper Midwest Environmental Science Center based on the dragonfly’s full mitochondrial
genome39. Primer/probe sets specific to S. hineana mitochondrial DNA sequences Cytochrome c oxidase subu-
nit 3 (COX3: 139 base pairs [bp]) and Cytochrome b (CYTb: 125 bp) (Table 3) were multiplexed using qPCR39.
HEX-labeled probes were used in conjunction with COX3 primers, and FAM-labeled probes were used in con-
junction with CYTb primers. The limit of detection for these primers was approximately 20 copies/µL (unpub-
lished data).
The primers and probes used to detect S. hineana for this study were cross-validated against several species of
Somatochlora (S. minor, S. elongata, S. franklini, S. incurvata, S. kennedyi, S. walshii, S. williamsoni, S. tenebrosa, S.
linearis, and S. ensigera) as well as several aeshnid and libellulid species (unpublished data). Furthermore, water
samples from three locations outside the known range of S. hineana, which support numerous dragonfly species
Scientific Reports | (2021) 11:18987 | https://doi.org/10.1038/s41598-021-98099-1 5
Vol.:(0123456789)www.nature.com/scientificreports/
Primer/probe Forward primer Reverse primer Probe
Cytochrome c oxidase subunit 3 (COX3)/HEX GCTCCATTCACTATTGCAGATTC GTGGTGAGAAGTGGCTTATGT AGCAACTGGATTTCATGGAATTCACGT
CATCAAACTGGTTCCAATAACCCAATT
Cytochrome b (CYTb)/FAM GCAGCTGCTACAATAATTCAC CCATGAGAAATATGGATGGAAAG
GGT
Table 3. Primer/probe sequences used to detect Somatochlora hineana eDNA.
that are sympatric with S. hineana, were tested with qPCR for the presence of S. hineana primer, probe, and
g-block eDNA sequences. All these samples were negative for the presence of the S. hineana mtDNA sequences
used in this study (unpublished data).
Each sample was run in quadruplicate with both primer/probe sequences for a total of eight possible amplifi-
cations per sample. Each sample replicate consisted of a 20 μL reaction containing 10 μL of IDT’s 2 × Master Mix
with hot-start DNA polymerase, a 0.5 μm concentration of each of the four primers, and 0.25 μm concentration
of each probe. During the qPCR run protocol, samples were initially held at 95 °C for three minutes and then
cycled 45 times through denaturation (95 °C for 15 s), annealing (1.6 °C decrease per second), and extension
(55 °C for 60 s).
G-block DNA, a single stranded DNA molecule (526 bp) containing COX-3 and CYT-b sequences specific
to S. hineana and ND 5 and CR2 sequences specific to C. diogenes39, was purchased through IDT’s custom DNA
Oligos tool. The g-block was used to create standard curves for eDNA quantification by providing equimolar
concentrations of all targets, allowing for unbiased amplification. One microliter of g-block DNA was run in
duplicate for each plate at dilutions of 101 to 106 copies/µL in 101 µL increments to produce a standard curve
on each plate. Sample quantities were determined by comparison to this standard curve. The critical threshold
value (Ct-value) was set at 0.1 cq for both primer/probe sets. This value determines the level of fluorescence at
which the sample is quantified.
Quality control. To prevent contamination, samples were handled using aseptic techniques. Separate rooms
were used for sample preparation, extraction, and amplification. Before use, all surfaces were cleaned with a 25%
bleach solution and pipettes were cleaned using DNA Away. All qPCR plates were prepared in a laminar flow
hood, which was sterilized using a 20 min UV exposure immediately before and after plate preparation. To pre-
vent sample degradation, filters were stored at room temperature out of direct sunlight in 75% laboratory-grade
ethanol prior to extraction and DNA extracts were stored at – 20 °C.
To identify the presence of compounds that would inhibit the amplification of sample DNA, we ran three
“spiked” positive controls for each sample. Spiked positive controls consisted of 1 μL of 103 copies/μL g-block
DNA mixed with 1 μL of sample template. If spiked samples had not amplified, this would have indicated the pres-
ence of inhibiting compounds. Four positive controls were run on each plate using 1 μL of previously extracted S.
hineana DNA as sample template. One extraction blank was run for each extraction to monitor possible extrac-
tion reagent contamination. Ten no-template controls were run on each plate to monitor possible qPCR reagent
contamination. Limit of Detection was calculated following standard eDNA qPCR a ssays41.
Sample analysis. COX3 and CYTb sequence amplifications were multiplexed to increase likelihood of
detection. Figures 1 and 2 were produced using the package g gplot240. Figure 3 was produced using qplot from
the R base p ackage42. To analyze eDNA net-accumulation, we calculated the difference of least squared-means
using linear mixed effects models (R42 lme4 p
ackage43) comparing eDNA quantities among both sampling day
and larval size class including interactions between COX3/Cytb amplification as a source of random error. To
analyze eDNA persistence, we calculated the difference of least squared-means using linear mixed effects models
(R42 lme4 package43) comparing the natural log of eDNA sample quantity (+ 1 to include samples quantified at
0.00 copies/μL) among sampling dates including interactions between COX3/Cytb amplification as a source of
random error. Exponential decay rate was analyzed with a non-linear least squares model (NLS)4. Specifically,
we implemented an NLS model in R42 using the SSasymp function44.
Data availability
The datasets generated during the study are available from the corresponding author on reasonable request.
Received: 19 October 2020; Accepted: 28 July 2021
References
1. Foster, S. E. & Soluk, D. A. Protecting more than the wetland: The importance of biased sex ratios and habitat segregation for
conservation of the Hine’s emerald dragonfly, Somatochlora hineana Williamson. Biol. Conserv. 127(2), 158–166. https://doi.org/
10.1016/j.biocon.2005.08.006 (2006).
2. Pintor, L. M. & Soluk, D. A. Evaluating the non-consumptive, positive effects of a predator in the persistence of an endangered
species. Biol. Conserv. 130(4), 584–591. https://doi.org/10.1016/j.biocon.2006.01.021 (2006).
3. Stewart, K. A. Understanding the effects of biotic and abiotic factors on sources of aquatic environmental DNA. Biodivers. Conserv.
28(5), 983–1001. https://doi.org/10.1007/s10531-019-01709-8 (2019).
4. Barnes, M. A. et al. Environmental conditions influence eDNA persistence in aquatic systems. Environ. Sci. Technol. 48, 1819–1827
(2014).
Scientific Reports | (2021) 11:18987 | https://doi.org/10.1038/s41598-021-98099-1 6
Vol:.(1234567890)www.nature.com/scientificreports/
5. Bista, I. et al. Annual time-series analysis of aqueous eDNA reveals ecologically relevant dynamics of lake ecosystem biodiversity.
Nat. Commun. 8, 1. https://doi.org/10.1038/ncomms14087 (2017).
6. Ficetola, G. F., Miaud, C., Pompanon, F. & Taberlet, P. Species detection using environmental DNA from water samples. Biol. Lett.
4, 423–425 (2008).
7. Thomsen, P. F. & Willerslev, E. Environmental DNA—An emerging tool in conservation for monitoring past and present biodi-
versity. Biol. Conserv. 183, 4–18 (2015).
8. Belle, C. C., Stoeckle, B. C. & Geist, J. Taxonomic and geographical representation of freshwater environmental DNA research in
aquatic conservation. Aquat. Conserv. Mar. Freshw. Ecosyst. 29(11), 1996–2009. https://doi.org/10.1002/aqc.3208 (2019).
9. Mauvisseau, et al. Combining ddPCR and environmental DNA to improve detection capabilities of a critically endangered fresh-
water invertebrate. Sci. Rep. 9, 14064. https://doi.org/10.1038/s41598-019-50571-9 (2019).
10. Piaggio, A. J. et al. Detecting an elusive invasive species: A diagnostic PCR to detect Burmese python in Florida waters and an
assessment of persistence of environmental DNA. Mol. Ecol. Resour. 14, 374–380 (2014).
11. Jerde, C. L., Mahon, A. R., Chadderton, W. L. & Lodge, D. M. “Sight-unseen” detection of rare aquatic species using environmental
DNA. Conserv. Lett. 4, 150–157 (2011).
12. Treguier, A. et al. Environmental DNA surveillance for invertebrate species: Advantages and technical limitations to detect invasive
crayfish Procambarus clarkii in freshwater ponds. J. Appl. Ecol. 51, 871–879 (2014).
13. Erickson, R. A. et al. Detecting the movement and spawning activity of bigheaded carps with environmental DNA. Mol. Ecol.
Resour. 16, 957–965 (2016).
14. Dejean, T. et al. Persistence of environmental DNA in freshwater ecosystems. PLoS One 6(8), e23398. https://doi.org/10.1371/
journal.pone.0023398 (2011).
15. Goldberg, C. S., Sepulveda, A., Ray, A., Baumgardt, J. & Waits, L. P. Environmental DNA as a new method for early detection of
New Zealand mudsnails (Potamopyrgus antipodarum). Freshw. Sci. 32(3), 792–800. https://doi.org/10.1899/13-0460.1 (2013).
16. Maruyama, A., Nakamura, K., Yamanaka, H., Kondoh, M. & Minamoto, T. The release rate of environmental DNA from juvenile
and adult fish. PLoS One 9(12), e114639. https://doi.org/10.1371/journal.pone.0114639 (2014).
17. Pilliod, D. S., Goldberg, C. S., Arkle, R. S. & Waits, L. P. Factors influencing detection of eDNA from a stream-dwelling amphibian.
Mol. Ecol. Resour. 14, 109–116 (2014).
18. Sassoubre, L. M., Yamahara, K. M., Gardner, L. D., Block, B. A. & Boehm, A. B. Quantification of environmental DNA (eDNA)
shedding and decay rates for three marine fish. Environ. Sci. Technol. 50(19), 10456–10464. https://doi.org/10.1021/acs.est.6b031
14 (2016).
19. Seymour, M. et al. Acidity promotes degradation of multi-species environmental DNA in lotic mesocosms. Commun. Biol. 1(4),
1–8. https://doi.org/10.1038/s42003-017-0005-3 (2018).
20. Thomsen, P. F. et al. Detection of a diverse marine fish fauna using environmental DNA from seawater samples. PLoS One 7(8),
e41732. https://doi.org/10.1371/journal.pone.0041732 (2012).
21. Thomsen, P. F. et al. Monitoring endangered freshwater biodiversity using environmental DNA. Mol. Ecol. 21, 2565–2573. https://
doi.org/10.1111/j.1365-294x.2011.05418.x (2012).
22. Turner, C. R., Uy, K. L. & Everhart, R. C. Fish environmental DNA is more concentrated in aquatic sediments than surface water.
Biol. Conserv. 183, 93–102. https://doi.org/10.1016/j.biocon.2014.11.017 (2015).
23. Mathieu, C. et al. A systematic review of sources of variability and uncertainty in eDNA data for environmental monitoring. Front.
Ecol. Evol. 8, 1–14. https://doi.org/10.3389/fevo.2020.00135 (2020).
24. Jo, T., Murakami, H., Yamamoto, S., Masuda, R. & Minamoto, T. Effect of water temperature and fish biomass on environmental
DNA shedding, degradation, and size distribution. Ecol. Evol. 9(3), 1135–1146. https://doi.org/10.1002/ece3.4802 (2019).
25. Piggott, M. P. Evaluating the effects of laboratory protocols on eDNA detection probability for an endangered freshwater fish. Ecol.
Evol. 6(9), 2739–2750. https://doi.org/10.1002/ece3.2083 (2016).
26. Deiner, K. & Altermatt, F. Transport distance of invertebrate environmental DNA in a natural river. PLoS One 9(2), e88786. https://
doi.org/10.1371/journal.pone.0088786 (2014).
27. Jane, S. F. et al. Distance, flow and PCR inhibition: eDNA dynamics in two headwater streams. Mol. Ecol. Resour. 15(1), 216–227.
https://doi.org/10.1111/1755-0998.12285 (2014).
28. Shogren, A. J. et al. Controls on eDNA movement in streams: Transport, retention, and resuspension. Sci. Rep. 7(5065), 1–11.
https://doi.org/10.1038/s41598-017-05223-1 (2017).
29. Klymus, K. E., Richter, C. A., Chapman, D. C. & Paukert, C. Quantification of eDNA shedding rates from invasive bighead carp
Hypophthalmichthys nobilis and silver carp Hypophthalmichthys molitrix. Biol. Conserv. 183, 77–84. https://doi.org/10.1016/j.
biocon.2014.11.020 (2015).
30. Stoeckle, M. Y., Soboleva, L. & Charlop-Powers, Z. Aquatic environmental DNA detects seasonal fish abundance and habitat
preference in an urban estuary. PLoS One 12(4), e0175186. https://doi.org/10.1371/journal.pone.0175186 (2017).
31. Lacoursière-Roussel, A., Rosabal, M. & Bernatchez, L. Estimating fish abundance and biomass from eDNA concentrations: Vari-
ability among capture methods and environmental conditions. Mol. Ecol. Resour. 16(6), 1401–1414. https://doi.org/10.1111/
1755-0998.12522 (2016).
32. Moyer, G. R., Díaz-Ferguson, E., Hill, J. E. & Shea, C. Assessing environmental DNA detection in controlled lentic systems.
PLoS One 9(7), e103767. https://doi.org/10.1371/journal.pone.0103767 (2014).
33. Takahara, T., Minamoto, T., Yamanaka, H., Doi, H. & Kawabata, Z. Estimation of fish biomass using environmental DNA. PLoS One
7(4), e35868. https://doi.org/10.1371/journal.pone.0035868 (2012).
34. Kreader, C. A. Persistence of PCR-detectable Bacteroides distasonis from human feces in river water. Appl. Environ. Microbiol.
64(10), 4103–4105. https://doi.org/10.1128/aem.64.10.4103-4105.1998 (1998).
35. Bochove, et al. Organic matter reduces the amount of detectable environmental DNA in freshwater. Ecol. Evol. 00, 1–8. https://
doi.org/10.1002/ece3.6123 (2020).
36. Mächler, E., Osathanunkul, M. & Altermatt, F. Shedding light on eDNA: Neither natural levels of UV radiation nor the presence
of a filter feeder affect eDNA-based detection of aquatic organisms. PLoS One 13, 4. https://doi.org/10.1371/journal.pone.01955
29 (2018).
37. Monroe, E. M., Lynch, C., Soluk, D. A. & Britten, H. B. Nonlethal tissue sampling techniques and microsatellite markers used for
first report of genetic diversity in two populations of the endangered Somatochlora hineana (Odonata: Corduliidae). Ann. Entomol.
Soc. Am. 103(6), 1012–1017. https://doi.org/10.1603/an10088 (2010).
38. Schmidt, K. J. Developing eDNA Techniques for the Endangered Hine’s Emerald Dragonfly (Somatochlora hineana) and Its Symbiont
the Devil Crayfish (Cambarus [=Lacunicambarus] Diogenes): Mesocosm and Field Studies. (University of South Dakota, 2020).
39. Jackson, C., McCalla, S. G., Amberg, J., Soluk, D. A. & Britten, H. B. The complete mitochondrial genome of Hine’s emerald drag-
onfly (Somatochlora hineana Williamson) via NGS sequencing. Mitochondrial DNA Part B 3(2), 562–563 (2018).
40. Wickham, H. ggplot2: Elegant Graphics for Data Analysis (Springer, 2009).
41. Klymus, K. E. et al. Reporting limits of detection and quantification for environmental DNA assays. Environ. DNA. 2, 271–282
(2020).
42. R Core Team. R: A Language and Environment for Statistical Computing. (R Foundation for Statistical Computing, 2020). http://
www.R-project.org/.
Scientific Reports | (2021) 11:18987 | https://doi.org/10.1038/s41598-021-98099-1 7
Vol.:(0123456789)www.nature.com/scientificreports/
43. Bates, D., Maechler, M., Bolker, B. & Walker, S. Fitting linear mixed-effects models using lme4. J. Stat. Softw. 67(1), 1–48. https://
doi.org/10.18637/jss.v067.i01 (2015).
44. Pinheiro, J. C. & Bates, D. M. Fitting nonlinear mixed-effects models. In S and S-Plus (eds. Pinheiro, J.C. & Bates, D. M.) 337–414.
(Springer, 2000).
Acknowledgements
We would like to acknowledge D. Tesar and P. Dombrowski for their assistance with sample collection, as well as
T. Soluk, R. Meza and Z. Dibbern for assistance with captive rearing protocols, C. Jackson for technical advice
on qPCR and primer development. We would like to thank K. Lah for assistance in acquiring funding and for
other support for this study. We would like to thank the corresponding editor, Dr. C. Baker, and two anonymous
reviewers for their helpful suggestions in improving this paper. This work was funded by the USGS through the
USFWS/USGS Science Support Partnership program.
Author contributions
Author K.J.S. is the corresponding author, analyzed the data, wrote the manuscript, and prepared the figures.
Authors H.B.B. and S.E.M.M. developed the experimental design. Authors K.J.S. and S.E.M.M. carried out the
experiments. Author D.A.S. provided larvae for the study and supervised the captive rearing project. Authors
D.A.S. and H.B.B. conceived of the project, provided funding, and supervised the project. All authors reviewed
and edited the manuscript.
Competing interests
The authors declare no competing interests.
Additional information
Correspondence and requests for materials should be addressed to K.J.S.
Reprints and permissions information is available at www.nature.com/reprints.
Publisher’s note Springer Nature remains neutral with regard to jurisdictional claims in published maps and
institutional affiliations.
Open Access This article is licensed under a Creative Commons Attribution 4.0 International
License, which permits use, sharing, adaptation, distribution and reproduction in any medium or
format, as long as you give appropriate credit to the original author(s) and the source, provide a link to the
Creative Commons licence, and indicate if changes were made. The images or other third party material in this
article are included in the article’s Creative Commons licence, unless indicated otherwise in a credit line to the
material. If material is not included in the article’s Creative Commons licence and your intended use is not
permitted by statutory regulation or exceeds the permitted use, you will need to obtain permission directly from
the copyright holder. To view a copy of this licence, visit http://creativecommons.org/licenses/by/4.0/.
© The Author(s) 2021
Scientific Reports | (2021) 11:18987 | https://doi.org/10.1038/s41598-021-98099-1 8
Vol:.(1234567890)You can also read