Mapping of antimicrobial resistance in marine mammals: Targeted PCR and metagenomic analysis - M-1641|2020 February 2020 - GenØk
←
→
Page content transcription
If your browser does not render page correctly, please read the page content below

Ma
 ppi
   ngofanti
          micr
             obi
               alr
                 esi
                   st
                    a nc
                       einmari
                             nema mma
                                    ls:
    Tar
      getedPCRandmetagenomi
                          canal
                              ysi
                                s
               M-
                1641|
                    2020

                                 F
                                 ebr
                                   uar
                                     y2020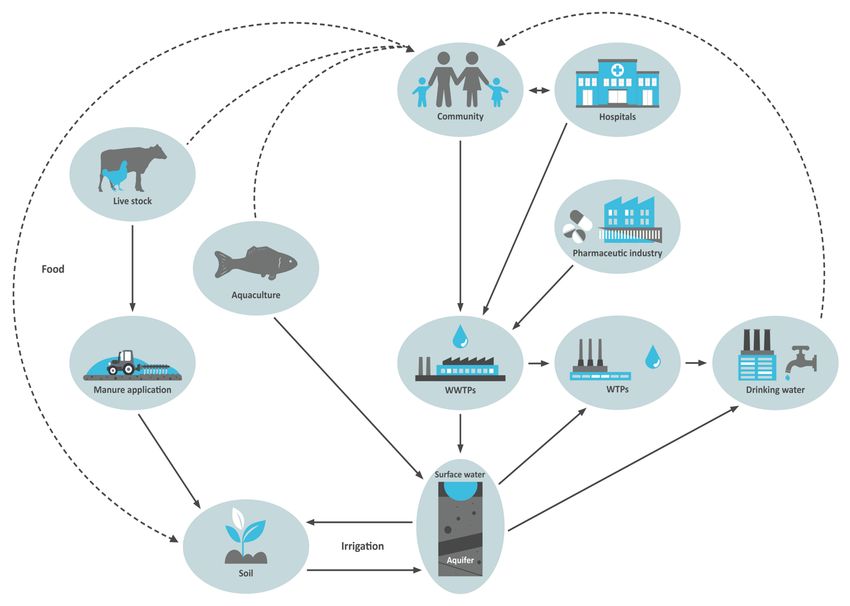
GenØk - Centre for Biosafety, Tromsø, Norway, February 2020

    Mapping of antimicrobial resistance in marine mammals:
           Targeted PCR and metagenomic analysis
                        M-1641|2020

              Ingvild Falkum Ullmann, Anne Ingeborg Myhr and Lise Nordgård

Suggested citation:
Ullmann, I. F et al. (2020) Antimicrobial resistance in marine mammals: Targeted PCR and
metagenomic analysis. Project report, M-1641|2020, GenØk, Tromsø, Norway.

 GenØk - Senter for biosikkerhet, Siva Innovasjonssenter, P.B. 6418, 9294 Tromsø, Norway,
                 Tel.: +47 77 64 66 20 – post@genok.no – www.genok.no

                   Front page photo: ©Adobestock.com/The Ocean Agency
This report was commissioned by the Norwegian Environment Agency
Background
Antibiotic resistance, particularly antibiotic resistance among bacteria, is globally recognised as a
threat to modern medicine, and thus a threat to human and animal health (World Health Organization,
2015). There is increasing appreciation for the fact that the environment plays a dynamic role in the
issue of antibiotic resistance. It has become clear that the environment is both a source and a recipient
of antibiotic resistance genes (ARGs) and resistant bacteria (ARB).
The national strategy of the Norwegian government against antibiotic resistance for 2015-2020
highlights that this issue must be considered in a holistic perspective. It is aligned with the One Health
principle, and acknowledges that human and animal health and the environment interact and must be
seen in context to each other. The identification and monitoring of the presence of ARB and ARRs in
different environments is highlighted as one of the areas where more information is needed. The
presence of resistant bacteria in different natural environments, such as soil, fresh water, sea
sediments and wild animals, has however only been sporadically studied, although they may
contribute to the development of resistance of clinical importance. This implies that there is therefore
a need for more knowledge about antimicrobial resistant bacteria (ARB) and antimicrobial resistant
genes (ARGs) in different natural environments in Norway.
GenØk – Centre for Biosafety
GenØk – Centre for Biosafety (www.genok.no) is an independent research institute founded in 1998
and located in Tromsø, Norway. GenØk works for safe use of biotechnologies and is engaged in the
field of biosafety on modern biotechnologies. The institution also works on capacity building and
advisory activities. GenØk takes a precautionary and interdisciplinary approach to biosafety. In 2007,
GenØk was appointed national competence centre on biosafety by Norwegian authorities.
Acknowledgement
We thank Hermoine Venter for carrying out experiments and for drafting the first report of this
study. We would also like to thank Katrine Jaklin for editorial work, Kaare Nielsen, OsloMet/GenØk,
for advice, Kathrine Ryeng and Lotta Lindblom, Institute of Marine Research, for providing whale
samples.
iiMapping of antimicrobial resistance in marine mammals:
Targeted PCR and metagenomic analysis
Table of Contents
Summary ............................................................................................................................................ 4
Sammendrag på norsk ........................................................................................................................ 6
Introduction ....................................................................................................................................... 8
Materials and Methods..................................................................................................................... 10
Sampling ....................................................................................................................................... 10
Methods ....................................................................................................................................... 10
Total DNA extraction from whale faeces ....................................................................................... 11
PCR based detection of ARGs in total DNA .................................................................................... 11
Metagenomic analysis .................................................................................................................. 13
Results and Discussion ...................................................................................................................... 14
Molecular Characterization: DNA Isolation and PCR ...................................................................... 14
Molecular Characterization: PCR on total DNA from whale faeces................................................. 15
Detection of ARG using a metagenomics approach ....................................................................... 17
The benefits from combining different methodological approaches .............................................. 19
Limitations .................................................................................................................................... 20
Recommendations for further studies............................................................................................... 21
Conclusion ........................................................................................................................................ 22
References........................................................................................................................................ 23
Appendix 1 ....................................................................................................................................... 26
iiiSummary
In this study faecal samples were collected from ten selected whales for analysis of antimicrobial
resistance. The study is a part of a larger project and therefore builds on previous experiments where
a culture-based approach was used to investigate the MIC values of bacteria isolates from 55 whale
samples and 5 seals (Venter, 2019). Here we have extended the culture-based approach by a non-
culture approach. Hence, this study combines the strengths of both a culture-based approach where
resistance phenotypes can be investigated, and non-culture-based approach, which is not limited to
microorganisms that can only grow under laboratory conditions.
Findings from previous experiments were published by Venter in 2019. Faecal samples from 60 marine
mammals (55 minke whales and 5 seals) were tested for phenotypic resistance to a selection of
antibiotics (ampicillin, cefotaxime, vancomycin, kanamycin, tetracycline, ciprofloxacin, erythromycin
and trimethoprim). MICs were determined for 239 isolates from whale samples and 46 isolates from
seal samples. For each antibiotic, isolates which were capable of growing at the maximum
concentration were tested (32 mg/L). The MIC values for ampicillin and tetracycline were low
compared to studies of other environmental samples. The highest number of isolates with an MIC of
≥32 mg/L was seen for trimethoprim, which also had an overall MIC range which was high compared
to similar studies. This was followed by molecular testing for a selection of antibiotic resistance genes
(ARGs) using standard PCR methods. The selected ARGs were mecA, tetA, ermB, nptII, qnrs, dfrA1,
vanA, as well as two genes which code for multidrug resistance (MDR) efflux pumps, acrB and mexD.
Only nptII failed to produce any amplicons. There was not a strong association between high MIC
values and the detection of resistance genes (except for vancomycin and VanA), though this is likely
due to the small selection of genes screened for.
Based on the findings from the first part of the project (Venter, 2019), we decided to continue the
research with the most interesting samples based on bacteria isolates with the highest or most
interesting MIC values. These findings were correlated back to the original whale samples, and it was
decided to select samples from ten whales. From these selected whales total microbial DNA was
extracted for targeted PCR for selected ARGs; mecA, tetA, tetB, tetM, qnrS, erm(B), dfrA1, nptII, and
nptIII. MDR efflux pumps; mexB, mexD, acrB and acrD, were also included in this essay, and several of
the analyzed samples were positive for one or more genes coding for antibiotic MDR efflux.
In addition to targeted PCR, the extracted microbial DNA from the whale faecal samples was subjected
to shotgun metagenomics analysis, using the HiSeq platform of Illumina. The findings from the
4metagenomic analysis shows that variants of van and tet genes, coffering resistance to vancomycin
and tetracycline, respectively, were among the most prevalent. In addition, it was found one or more
genes coding for antibiotic MDR efflux in the samples. The detected tet genes are different variants to
those screened for in the targeted PCR analysis, and show the importance of combining different
methodology in the case of environmental microbiology.
The results of this study reveal a snapshot of the antimicrobial susceptibility and resistance genes
present in samples collected from marine mammals, and contribute to a growing body of evidence
connecting the environment to dissemination of antibiotic resistance. The present study is limited in
terms of scale, and continued research is required to fully understand the role of marine mammals in
the context of maintenance and spread of antimicrobial resistance.
5Sammendrag på norsk
I dette studiet har vi analysert antimikrobiell resistens i avføringsprøver fra 10 utvalgte vågehval.
Denne studien bygger på tidligere eksperimenter der en kulturbasert tilnærming ble brukt for å
undersøke MIC-verdiene til bakterieisolater fra 55 hval- og 5 selprøver, se rapport publisert av Venter
(2019). Her har vi utvidet den kulturbaserte tilnærmingen med en ikke-kulturell tilnærming. Denne
studien kombinerer dermed styrkene til både en kulturbasert tilnærming, som gjør det mulig å
undersøke resistensfenotyper og ikke-kulturbasert tilnærming, som ikke er begrenset til
mikroorganismer som kun vokser under laboratorieforhold.
I studie publisert av Venter i 2019, ble fekalprøver fra 60 marine pattedyr (55 vågehval og 5 sel) testet
for fenotypisk resistens mot et utvalg av antibiotika (ampicillin, cefotaxime, vancomycin, kanamycin,
tetracyklin, ciprofloxacin, erythromycin og trimetoprim). MIC ble fastslått for 285 av isolatene, 239 fra
hvalprøver og 46 isolater fra selprøver. For hvert antibiotikum fantes det isolater som var i stand til å
vokse i den maksimale konsentrasjonen som ble testet (32 mg/l). MIC-verdiene for ampicillin og
tetracyklin var lave sammenlignet med studier av andre miljøprøver. Det høyeste antallet isolater med
en MIC på ≥32 mg / L ble sett for trimethoprim, som også hadde et samlet MIC-område som var høyt
sammenlignet med lignende studier. Dette ble fulgt av molekylær testing for et utvalg av
antibiotikaresistensgener (ARGs) ved bruk av standard PCR-metoder. De utvalgte ARG var mecA, tetA,
ermB, nptII, qnrs, dfrA1, vanA, samt to gener som koder for multidrug resistens (MDR) effluks pumper,
acrB og mexD. Kun i testene for nptII ble det ikke produsert noen amplikoner (PCR-produkt). Det var
ikke en sterk sammenheng mellom høye MIC-verdier og deteksjon av resistensgener (unntatt for
vancomycin og VanA), men dette skyldes sannsynligvis det begrensede utvalget av gener som ble
analysert.
Basert på funnene til Venter (2019), bestemte vi oss her for å fortsette analysene med de mest
interessante prøvene basert på bakterieisolater med de høyeste eller mest interessante MIC-verdiene.
Disse funnene ble korrelert med de opprinnelige hvalprøvene, og det ble besluttet å velge prøver fra
ti hvaler. Fra disse utvalgte hvalene ble totalt mikrobielt DNA ekstrahert for målrettet PCR for følgende
utvalgte antimikrobielle resistensgener (ARGs); mecA, tetA, tetB, tetM, qnrS, erm (B), dfrA1, nptII, og
nptIII. De fire genene som koder for efflukspumper, mexB, mexD, acrB og acrD, ble også inkludert, og
flere av de analyserte prøvene var positive for en eller flere av genene som koder for MDR efflux.
I tillegg til målrettet PCR ble det ekstraherte DNAet fra hval prøvene brukt for metagenomisk analyse
ved HiSeq-plattformen til Illumina. Disse resultatene viser at varianter av van- og tet-gener, som gir
resistens mot henholdsvis vancomycin og tetracykliner, var blant de mest utbredte. I metagenom-
6undersøkelsen ble det også funnet varianter av MDR effluks pumper. De påviste tet-genene er av
forskjellige gen-varianter enn de som ble screenet for i den målrettet PCR-analyse, og viser viktigheten
av å kombinere flere metoder innen studier av ARG i miljøet. I metagenom-undersøkelsen ble det også
funnet varianter av MDR effluks pumper.
Resultatene i denne studien viser et øyeblikksbilde av antibiotikaresistensen og av de ARG som er
tilstede i prøver fra marine pattedyr. Studien er begrenset i omfang, men bidrar til økt kunnskap om
forekomst og spredning av antibiotikaresistens i naturmiljøet. Det er nødvendig med videre forskning
for å fullt ut forstå rollen marine pattedyr har i sammenheng med opprettholdelse og spredning av
antimikrobiell resistens.
7Introduction
In the decades since humans began the mass production of antimicrobial products (especially
antibiotics (AB)), there has been an increase in cases of antimicrobial resistance the clinical level, which
interferes with our ability to treat disease. A large and diverse range of antibiotic resistance genes
(ARG) and antibiotic resistant bacteria (ARB) is found in the environment, which also could be found
there before humans started using antimicrobial products, and it is likely that clinical antimicrobial
resistance has its origins in environmental reservoirs (D’Costa et al., 2011; Larsson et al., 2018; Perry
et al., 2016). The capacity of microorganisms to share genetic material via horizontal gene transfer
(HGT) means that genes present in the environmental resistome have the potential to move between
bacterial communities, potentially transferring antimicrobial resistance genes to human and animal
pathogens (Finley et al., 2013, Larsson, 2014). Drivers of antimicrobial resistance, such as antibiotics,
biocides, and heavy metals, likely exert selective pressure in the environment which drives an increase
in the prevalence and spread of ARGs and ARBs. Anthropogenic activities and the environment
intersect in several ways when considering the issue of AB, ARBs and ARGs, as illustrated in figure 1.
Figure 1: A representation of the intersections between human activity and environmental
compartments in terms of the spread of antibiotics and antimicrobial resistance determinants
(Illustration: Cathrine Brynjulfsen. All icons are designed by following contributors at Freepik.com:
Macrovector, Ibrandify, Zirconicusso). First published in Nordgård et al., 2017a).
8The presence of ARB in different natural environments, such as soil, fresh water, sea sediments and
wild animals, has only been sporadically studied, although they may contribute to the development of
antibiotic resistance of clinical importance. There is therefore a crucial need for more knowledge about
ARB and ARGs in different natural environments in Norway. There is also a need for better
understanding of how antimicrobial resistance drivers present in the environment impact the
prevalence and spread of resistance, how this intersects with spread facilitated by wildlife and water,
and connects with human activities (VKM, 2018). Establishing a causal link between exposure to
anthropogenic activities and resistance in animals has proven difficult (VKM, 2018). A recent project
screened for resistance in marine mussels, and while this was detected, it did not correlate with areas
of increased human activity (Svanevik et al., 2018).
Minke whales are highly mobile animals, migrating enormous distances from areas in the North
Atlantic (around the coast of Norway and Greenland), to as far south as the waters around the South-
Eastern United States and the Caribbean (Risch et al., 2014). Migratory animals are of particular
interest when considering environmental reservoirs of ARB and ARGs, because in addition to being
exposed to multiple sources of antimicrobials and drivers of resistance, they may also play a role in the
spread of resistant bacteria and genes between different environments (Viana et al., 2016, VKM, 2018).
Minke whales, with their extensive migration patterns, thus make good candidates for investigation of
this concept.
9Materials and Methods
Sampling
Minke whale samples were collected by Lotta Lindblom from the Institute of Marine Research in
2017 and 2018. The samples were collected in the Barents Sea (outside the Bear Island) and
transferred to GenØk, where they were kept frozen until use. More information regarding the whales
from which the samples were taken can be found in appendix 1. Other samples from the whales will
be investigated by UiT- The Arctic University of Norway with regard to demographics, reproduction
and diet, while the University of Oslo will perform the ecotoxicology studies (personal
communication with Tore Haug (UiT)).
Methods
A brief summary of the methods is presented in the figure below. In the first part of this study three
main phases of work were carried out (Venter, 2019): resuscitation of bacteria from samples,
determination of minimum inhibitory concentration of various antibiotics, and screening for selected
ARGs. In this study two phases of work were carried out: total DNA extraction from whale samples,
and the isolated DNA was used either for PCR based detection of ARGs in total DNA or metagenomics
analyses.
Sample (faecal)
Culture bacteria &
Total DNA isolation
isolate plasmids
Metagenomics Phenotypic Molecular
PCR: ARGs
(NGS) reistance profiles characterization
MIC
Processing & DNA isolation &
determination:
Analysis PCR: ARGs
broth microdilution
Figure 2. Methods used for molecular and phenotypic characterization of antimicrobial resistance.
10For methods used in the culture-based approach, as resuscitation of bacteria from frozen samples,
phenotypic characterization (Broth microdilution), and molecular characterization: DNA Isolation and
PCR of ARGs, see Venter 2019.
Total DNA extraction from whale faeces
Based on interesting findings from the culture-approach (Venter, 2019), we decided to focus on the
bacteria isolates with the highest or most interesting MIC values, and correlate these samples back to
the original whale samples. These faecal samples were selected for more thorough analysis. The first
step of the analysis was total DNA isolation from the samples. Total DNA was extracted from selected
whale faeces samples with number 26, 30, 36, 37, 49, 50, 51, 86, 96 and 105 (see appendix 1) using
the QIAamp DNA stool kit (Qiagen) according to the manufacturer’s instructions. DNA was extracted
in parallels of two from each faeces sample. Quantity and quality of the purified DNA were determined
using a NanoDrop™ 2000 spectrophotometer (ThermoFisher Scientific, Wilmington, DE, USA).
Additionally, DNA concentrations were measured using Qubit Fluorometric quantification
(ThermoFisher Scientific, Waltham, MA, USA) employing the dsDNA High Sensitivity Assay as described
by the Manufacturer. The eluted DNA extracts were stored at -20°C until further analysis.
PCR based detection of ARGs in total DNA
PCR experiments for the amplification of specific resistance genes were performed with DNA isolated
directly from whale feces as described above. The selected resistance genes that were tested for
were: mecA, tetA, tetB, tetM qnrS, Erm(B), dfrA1, mexB, mexD, acrB, acrD, nptII, and nptIII. Primers
and additional information on the amplification of the selected genes are described in table 1, same
as used in Venter (2019), and additional primers used is presented in table 2. The 16S rRNA gene was
amplified as a control of the extracted DNA to confirm the general absence of PCR inhibitors and the
presence of bacterial DNA. In general, all reactions were performed in a total volume of 20 μl
containing the following: 1 μl of each specific primer (Sigma Aldrich) at 10 μM concentration, 10 μl
mastermix (DreamTaq PCR Mastermix, Thermo Fisher), 6 μl water and 2 μl template DNA.
The PCR conditions were as follows: 1 cycle of initial denaturation at 95˚C for 2 min, 30 cycles of
denaturation at 95 ˚C for 30 sec, annealing at 54-62 ˚C for 30 sec (see table 1 and 2 for specific
annealing temperature) and elongation at 72 ˚C for 40 sec. Finally, one cycle of elongation at 72˚C for
115 min was added after the described 30 cycles. All PCRs were carried out on a BioRad
ThermoCycloS1000. The PCR products were run on 2% agarose gels, using E-Gel® 1 Kb plus DNA
ladder (all supplied by Invitrogen, Norway), for visualization. All PCR analyses included no-template
controls and positive controls and were run in parallels of three.
Table 1. Selected ARGs and the primers used for their detection (Venter, 2019).
Antibiotic Gene Primer Sequences Annealing Amplic Reference
(5’ - 3’) temp (°C) on size
(bp)
Tetracycline TetA CCTGATTATGCCGGTGCT 61 200 (Szczepanowski
TGGCGTAGTCGACAGCAG et al., 2009)
Ampicillin mecA AAAAAGATGGCAAAGATATTCAA 56 185 (Szczepanowski
TTCTTCGTTACTCATGCCATACA et al., 2009)
Kanamycin nptII ATGATTGAACAAGATGGATTGC 55 364 (Börjesson et
TCAGAAGAACTCGTCAAGAAGG al., 2009)
Erythromycin Erm(B) GATACCGTTTACGAAATGG 58 364 (Chen et al.,
GAATCGAGACTTGAGTGTGC 2007)
Ciprofloxacin qnrS ATCAAGTGAGTAATCGTATGTACT 61 171 (Berglund et al.,
CACCTCGACTTAAGTCTGAC 2014)
Trimetoprim dfrA1 ATGGAGTGCCAAAGGTGAAC 62 241 (Grape et al.,
TATCTCCCCACCACCTGAAA 2007)
Vancomycin VanA GGGAAAACGACAATTGC 54 732 (Biavasco et al.,
GTACAATGCGGCCGTTA 2007)
MDR efflux pump, acrB ATATCCTACGATTGCACCGC 62 160 (Szczepanowski
RND family GGTACCCGTGGAGTCACTGT et al., 2009)
MDR efflux pump, mexD TCAACGGTCTGGGTAACTCC 62 182 (Szczepanowski
RND family GTCGATCAACAGGCGCAGT et al., 2009)
Table 2. Additional selected ARGs and the primers used for their detection in this study of total DNA.
Antibiotic Gene Primer Sequences Annealin Amplic Reference
(5’ - 3’) g temp on size
(°C) (bp)
Tetracycline TetB TACGTGAATTTATTGCTTCGG 61 206 (Aminov et al,
ATACAGCATCCAAAGCGCAC 2002)
TetM GCTTATTCCGGGGAAATTGT 60 198 (Szczepanowski
CGGGTCACTGTCGGAGATT et al., 2009)
Kanamycin nptIII ATGGCTAAAATGAGAATATCACCG 60 795 (Woegerbauer
CTAAAACAATTCATCCAGTAAAATATA et al., 2014)
MDR efflux pump, acrD GGCAATCCTGTTGTGTCTGA 62 185 (McArthur et
RND family ACATGAGATTATCGAGGCCG al., 2013)
MDR efflux pump, mexB GACCAAGGCGGTGAAGAAC 62 147 (McArthur et
RND family AACACCTGGAAGTCACCGAC al., 2013)
12Metagenomic analysis Metagenomic analysis is a modern approach that overcome the challenges and limitations of culture- dependent methods and amplification. By this approach direct genetic analysis of genomes contained with environmental samples is possible (Franzosa et al., 2015; Thomas, Gilbert, & Meyer, 2012). A metagenomics approach can be used alone or combined with a culture-based approach, which would provide more details about the bacteria present and the genes they carry. This would also allow detection of a greater number of resistance genes than in a culture-based approach, which until now has been the approach most often used in mapping of ARB and ARGs in environmental samples. In this study total DNA extracted from ten whale faeces samples, animal 26, 30, 36, 37, 49, 50, 51, 86, 96 and 105 (see appendix 1), and were sent to the Norwegian Sequencing Centre (NSC) at the University of Oslo for metagenomic library preparation with the THRUplex kit (Rubicon) and sequencing on the Illumina HiSeq 3000/4000 platform. The open source command line trimming tool Trimmomatic version 0.27 (http://www.usadellab.org/cms/index.php?page=trimmomatic) (Bolger et al., 2014) was used for processing of raw sequencing files. The recommended settings for Paired End sequences were used. Trimmed sequence files were then assembled using the open source assembler MEGAHIT v1.1.3 (http://www.metagenomics.wiki/tools/assembly/megahit) (Li et al., 2015). Genes conferring antimicrobial resistance were identified using a local installation of the open source Resistance Gene Identifier (RGI) tool (v. 5.1.0 ) from the Comprehensive Antibiotic Resistance Database (CARD) version 3.0.4 (Jia et al., 2017, McArthur et al., 2013, McArthur and Wright, 2015). Homolog detection was performed using DIAMOND 0.8.36. “Loose” matches were allowed in addition to “strict” and “perfect” hits. The detected ARG matches were further categorized into groups according to antimicrobial resistance mechanism.
Results and Discussion
For results and discussion from the culture-based approach of phenotypic characterization (broth
microdilution), and molecular characterization: DNA Isolation and PCR, see Venter 2019.

Molecular Characterization: DNA Isolation and PCR
In the previous study by Venter (2019) DNA was isolated from bacteria. We have included a brief
presentation of the findings here. Venter carried out PCR with a selection of primers targeting various
ARGs, including two genes targeting multidrug efflux pumps (acrB and mexD). In the case of the
molecular characterization, in a total 600 selected isolates were screened.

Table 3 present a summary of the PCR results, listing amplicons which correspond to the length of the
target sequence. Amplicons of incorrect size or multiple amplicons are not listed.

   Table 3. Summary of PCR results after amplification with primers targeting selected ARGs (Venter, 2019).

        Gene                        Number of                 Number of                 Total
                                    amplicons                 amplicons
                                  (Whale isolates)          (Seal isolates)
        TetA                              5                       0                       5
        mecA                             10                       1                       11
        nptII                             0                       0                       0
        Erm(B)                            2                       0                       2
        qnrS                              1                       0                       1
        dfrA1                             5                       5                       10
        VanA                             54                       27                      81
        acrB                              7                       27                      34
        mexD                              3                       12                      15

The highest number of amplicons were obtained for vanA, which confers resistance to vancomycin
(Biavasco et al., 2007), which of all the genes tested also had the best association with high MIC values
for the associated antibiotic. The genes coding for efflux pumps, acrB and mexD, which could
potentially confer a degree of resistance to a number of antimicrobial compounds, also produced a
high number of amplicons.

Amplicons of the correct size were generated for all primer sets except nptII (neomycin
phosphotransferase II), which codes for kanamycin resistance. This gene is frequently used as an
antibiotic resistance marker during the development of genetically modified (GM) crops (Nordgård et

                                                                                                              14
al, 2016). Though thought to be virtually ubiquitous in some environments, nptII was not detected in
the present study, nor in Nordgård et al. (2017b) who screened for the presence of the gene in reindeer
faeces.
Association of the presence of amplicons of the expected size with MICs which indicate a level of
resistance to a given antibiotic was not a given. For example, none of the isolates which displayed MIC
values of 8->32 mg/L for tetracycline produced an amplicon of the correct size when amplified with
tetA primers. Of the 5 tetA amplicons of the correct size, three belonged to isolates which came from
the same whale sample (W61), and were associated with MIC values of 2-4 mg/L. However, Venter
(2019) only screened for tetA, and there is a plethora of other genes associated with tetracycline
resistance (Roberts and Schwarz, 2016), including several multidrug efflux pumps such as acrB and
mexD (McArthur et al., 2013). Neither acrB nor mexD amplicons were associated with high tetracycline
MIC values either, however, suggesting that other genes were responsible. Ampicillin and cefotaxime
MIC values were also not closely associated with positive results with any of the primer sets.
The limited association of the selected target genes with the MIC values of the antibiotics suggests that
a wider net should be cast in the detection of ARGs in such samples. Based on the findings by Venter
(2019), we decided to continue with a) molecular characterization: PCR on total DNA, and b) a
metagenomics analysis. In a previous study by Nordgård et al. (2017a), it was demonstrated that such
an untargeted examination of ARGs was very useful in analysing environmental samples. A non-culture
based approach would also compliment the previous culture-based approach, since the limitations of
cultivation in terms of community representation (particularly in cases where environmental samples
had endured periods of freezing at non-ideal temperatures (such as in this project)) can be overcome.
Molecular Characterization: PCR on total DNA from whale faeces
The overall occurrence of the fourteen selected ARGs was determined by ARG specific primers using
DNA extracted directly from ten of the whale faeces samples. Given the difficulties in cultivating a
substantial part of the bacteria from any environment, DNA based techniques, especially PCR, are the
preferred techniques for examination of resistance genes present in total DNA.
The ARG targeted PCR showed that all ten whale faeces samples were negative for the majority of
selected ARGs (mecA, tetA, tetB, tetM, qnrS, erm(B), dfrA1). All ten samples were, however, positive
for one or more of the selected ARGs coding for the RND family of efflux pumps (mexB, mexB, acrB,
acrD) as shown in table 4 (negative results indicated by the – sign, while positive results are noted with
15a + sign). In total, seven of the samples were positive for mexB (W49, W37, W50, W51, W86, W96 and
W105), and acrD (W26, W30, W50, W51, W86, W96 and W105). The bacterial DNA from W50 and W51
showed similar patterns of resistance, as the PCR detected four of the ARGs targeted in this screening.
The three faeces samples from W26, W30 and W36 were only positive for one of the fourteen ARGs in
this assay. These results indicate a low prevalence of enzymatic resistance in the bacteria present in
the ten selected faces samples from minke whales. These results are in accordance with the MIC values
measured on the collected isolates in this study. Unfortunately, vanA was not included in this PCR
screening, although it showed to be detected in 54 isolates cultivated from whale faeces (table 3). The
overall low MIC values for the tested antibiotics, illustrating a general low level of resistance of the
whale gut microbiota, can be described by the presence of the detected genes coding for RND efflux
pumps. The presence of efflux pumps have been reported as the major mechanism of resistance in
previous screening of environmental samples in Norway (Nordgård et al, 2016).
Table 4. Summary of PCR results after amplification from total DNA extraction with primers targeting
selected ARGs.
It is important to keep in mind when interpreting these results, that when screening for ARG in the
natural environment there are numerous variants of any given gene, and the primer specificity is
important in this regard. The potential detection of specific gene variants in a metagenomics approach
could prove important for primer design for further analysis with quantitative PCR.
As with the positive PCRs of the total DNA isolated from bacterial isolates, the positive results need to
be verified by sequencing. Our results do not say anything about the quantities of the different ARGs.
This can be followed up by a quantitative PCR analysis. A quantitative PCR would add more information
about the extent of the total ARG reservoir in the different whale samples.
16Detection of ARG using a metagenomics approach
Metagenomics is a modern approach that overcome the challenges and limitations of culture
dependent methods and amplification (Schmieder & Edwards, 2012). By this approach, direct genetic
analysis of genomes contained with environmental samples is possible (Franzosa et al., 2015; T.
Thomas, Gilbert, & Meyer, 2012).
The RGI algorithm is a freely-available open-source algorithm designed to search the Comprehensive
Antibiotic Resistance Database (CARD) antibiotic resistance ontology (ARO) for the presence of
antimicrobial resistance genes in DNA sequences (McArthur et al., 2013). In this report, a local
installation of the RGI (v. 5.1.0) and accompanying CARD (v.3.0.4) were utilized to search the
metagenomes derived from total DNA isolated from eight of the whale faeces samples (W26, W30,
W36, W49, W51, W86, W96, W105) for the presence of AMR genes. Assembled metagenomes
(contigs) were input as query sequences into the RGI tool for two reasons: 1) assembly reduces the
size of metagenome datasets through contig formation, making AMR gene identification less
computationally intensive, and 2) assembly decreases sequence errors through increased coverage of
individual nucleotide positions.
In total, the RGI was able to identify 237 matches with a cut-off at 75% identity to the CARD (v.3.0.4,
February 2020) reference, among the eight assembled whale metagenome datasets. Of these 237
matches, only three hits had an identity percentage above 90% to the homologues available in CARD.
Two of these matches indicated that the identified resistance was associated with mutations; one of
the 23S rRNA subunit and the other of the rpoB gene, and should be addressed with caution. Moreover,
resistance as a result of mutations were the case for a high number of the hits detected in several of
the metagenomes analyzed. To verify these mutations and that they in fact result in resistance to a
given antibiotic, requires further analysis. The third hit, with a percentage identity above 90%, was the
gene identified as mupA, detected in the metagenome of W30. This gene is a gene conferring
resistance to mupirocin, an antibiotic used in the treatment of skin infections caused by Staphylococcus
haemolyticus (do Carmo Ferreira et al., 2011).
Figure 3 shows a summary of the genes with a percentage identity above 75%. It does not include
resistance caused by mutations. The metagenome of W51 showed to be the most diverse and
numerous, with several genes coding for tetracycline (tet36, tetS, tetW) and vancomycin (vanRG,
vanRI, vanUG) resistance genes. Overall, variants of tet genes, resulting in resistance to tetracycline,
were detected in three of the metagenomes (W26, W30, W51), while variants of van genes, conferring
17resistance to vancomycin, were detected in all six metagenomes reported in Figure 3. This is in
accordance with the results presented in table 3, and the identification of vancomycin resistance in
cultivated isolates from whale faeces.
100
90
80
70
60
Identity score (%)
50
40
30
20
10
0
TaeA
vanRG
vanSG
vanRG
vanRG
vanRG
vanRG
vanUG
vanRG
tetW
macB
efrB
vanRI
tet(W/N/W)
tetS
vanRD
vanRD
tet37
tet37
tet36
vanRA
mupA
patA
vanRA
LlmA
ugd
ugd
mdsB
CRP
LlmA
W26 W30 W36 W49 W51 W96
Figure 3. Overview the ARG (excluding mutations) with an identity score above 75% compared to
homologue in CARD from six of the whale metagenomes.
As illustrated in Figure 4, antibiotic target alterations were found to be the most abundant mechanism
of resistance in the analyzed metagenomes. The high number of van genes present in all datasets is
the probable explanation for this. Additionally, antibiotic efflux, were also one of the more prevalent
modes of antibiotic resistance. Interestingly, several genes related to efflux were detected in the
targeted PCR screening of total DNA from whale faeces. One of the genes associated with antibiotic
efflux identified in the metagenome of W49, namely mdsB, belong to the same gene family as the
mexB gene.
The PCR screening of total DNA from whale faeces showed that the W49 microbiome were positive for
mexB. It would be interesting to investigate the different variants of the antibiotic MDR efflux genes,
as it has been previously noted to play an important part in antibiotic resistance of environmental
bacteria.
18100
Total abundance (%)
80
60
40
20
0
antibiotic inactivation
antibiotic inactivation
antibiotic target alteration
antibiotic target protection
antibiotic target alteration
antibiotic target alteration
antibiotic target alteration
antibiotic target alteration
antibiotic target protection
antibiotic target alteration
antibiotic efflux
antibiotic efflux
antibiotic efflux
antibiotic efflux
W26 W30 W36 W49 W51 W96
Figure 4. Overview of the abundancy of the resistance mechanisms detected at six of the whale
metagenomes identified by RGI compared to CARD.
The metagenome results presented show large differences when using respectively 90% and 75%
identity scores as cut-offs. When analyzing clinical data, the 80% cut-off is recommended. Most of the
ARGs identified in this study, however, lie between 75-85% in identity scores to the homologue in
CARD. It has previously been shown that using a threshold of 90% for identification of resistance genes
in environmental bacteria, may create a large number of false negatives (Arango-Argoty et al., 2018).
The algorithms used to create CARD and similar databases are biased towards clinical isolates, and thus
important data may be lost or not identified when using them to examine environmental microbiomes.
As a result of this, the cut-off was set to 75%, and this needs to be taken into account when interpreting
the results. Additionally, many of the identified hits in CARD referred to mutations leading to
resistance. The data provided here are not sufficient to validate these mutations and needs to be
investigated in more detail. These results have thus been excluded from this report. The data from
metagenomes of W86 and W105 contained resistance genes solely associated with mutations with
identity scores above 75%, explaining the lack of data from these metagenomes in Figures 3 and 4.
The benefits from combining different methodological approaches
The results in this study from the targeted PCR and metagenomic analysis on total microbial DNA
extracted from whale faeces illustrates the importance of combining different methodological
approaches when working with microbiomes of the natural environments.
19In the targeted PCR of total microbial DNA, several of the analyzed samples were positive for one or
more genes coding for antibiotic efflux (mexB, mexD, acrB, acrD), while negative for the tet gene
variants (tetA, tetB). The results of the metagenomics data, however, identified the presence of four
tet variants in three of the analyzed samples. These were tetW, tetS, tet37 and tet36. It would be
interesting to perform sequence analysis of these variants. In regards to genes coding for antibiotic
efflux, these were less numerous in the metagenomics data compared to both PCR assays in this study.
Further analysis investigating the role of MDR efflux pumps in the isolated samples with observed
antibiotic resistance patterns, should be further assessed.
The results from PCR on DNA from isolates showed a high number of vanA present in bacteria
cultivated from whale faeces. This is in consistency with the metagenomics analysis, were variants of
van genes were present in the six metagenomes presented in Figure 3. A follow-up study using qPCR
to measure the abundance of the van variants in the whale microbiome would prove valuable.
Limitations
There are many limitations/uncertainties related to environmental studies and antimicrobial
resistance. Many of the uncertainties arise due to technical limitations, data limitations and lack
of standardized protocols. In this study, some of the listed limitations are also due to the limited project
period and can easily be followed up, while others are connected to sampling procedures and lead
rather to recommendations for future studies. This study represents a snapshot of the samples tested,
and cannot provide all details.
• Sampling and sample preservation: there are practical aspects connected to sampling in the
environment which can mean that sample preservation methods are not ideal. In this case, the
whale samples were collected as part of a larger field study, and could not be returned to the
lab for analysis immediately. See Venter (2019) for further discussion of this limitation.
• Cultivation based methods themselves introduce biases and limitations to a study, and are
only capable of recovering a small percentage of the total community in such diverse samples.
In the part of the study published by Venter (2019) we used a variety of culture media to try
to recover a good representation of the community present.
• Isolation of total DNA for PCR and metagenomic sequencing may need optimization. Low
yields, and issues with amplification suggest the presence of inhibitors which may have
reduced the probability of detecting genes present in those samples. Both the methods for
DNA isolation and for PCR conditions require more optimization.
20• The amplicons obtained through PCR screening for the selected ARGs have not been
sequenced to confirm their identities, this could easily be achieved in follow-up.
• Our results do not say anything about the detection frequencies of the different ARGs. This
can be followed up by a quantitative PCR. A quantitative PCR would add more information
about the total ARG reservoir in the different samples.
• Lack of knowledge about the concentration of antibiotics, biocides and heavy metals in the
environment the whales migrate in. Such information can give us insight into the type of
selective pressure the microorganisms may be facing.
• It is difficult to compare the outcome of this study with other published studies on ARGs in the
environment because there is very little standardization within the field (Huibers et al., 2019).
Cultivation conditions, DNA extraction methods, targeted resistance phenotypes and
genotypes or primers sets used in different environmental studies varies and make it difficult
to compare data. More standardized guidelines for resistance testing in different
environments would enable comparison between different environmental studies worldwide
more easily.
Recommendations for further studies
This study has provided a foundation of results relating to the antimicrobial capabilities and presence
of resistance genes in samples from whales. The whale faeces samples in particular are rare and not
easily obtained, so it is strongly recommended to get the most out of these samples, since they provide
a view into the ARG profiles of highly mobile marine mammals.
Recommendations:
• We have analysed 2 years’ worth of whale samples (this study and the study by Venter
(2019)). More data, provided over a longer time period, would help to fill knowledge gaps
about environmental antimicrobial resistance reservoirs and the directionality of the spread
of ARGs.
• The metagenomics data can be used for the development of more accurate primer sequences
and thus allow for more in-depth analysis of selected genes of interest, such as the various van
and tet genes or genes coding for antibiotic efflux pumps.
• Targeted PCR with more specific primers, followed by amplicon sequencing could provide new
valuable information on the presence and evolution of ARGs in the microbiomes of minke
whales, moreover, in marine environments. Furthermore, the development of more accurate
21primers could make quantitative PCR possible, which would provide information on the
abundancy of ARGs in these environments. This is especially relevant since the targeted PCR
of isolated DNA show low level of resistance.
• A majority of the antibiotic resistance identified by RGI in the analysed metagenomes, were
reported as mutations in CARD. The data provided in this study is not sufficient to draw any
conclusions on these results, and thus more in-depth analysis of mutations could be of interest.
Conclusion
The results of this study reveal a snapshot of the antimicrobial susceptibility and resistance genes
present in isolates collected from whale samples. Venter (2019) found in first part of this study that
for each antibiotic, there were some isolates which were capable of growing at concentrations of ≥ 32
mg/L, the maximum concentration tested in this study.
In this part of the study we found that DNA extracted from whale faeces samples gives insight to the
ARG present in the microbiome of the whale gut through targeted PCR and metagenomics analysis.
One of the main conclusions that can be withdrawn from our data is that different ARGs are prevalent
in samples from marine mammals. By using both culture-dependent and culture-independent
methods the results indicate that the bacteria in the samples are resistant to different antibiotics. The
other conclusion is that the majority of ARG and microbial resistance functional types were encoding
antimicrobial efflux pumps. It was also found that a high number of vanA, possibly encoding resistance
to the antibiotic vancomycin, present in bacteria cultivated from whale faeces. This is in consistency
with the metagenomics analysis, were variants of van genes were present in six metagenomes. In
addition, several variants of tet genes were found. The results might hence indicate that environments
outside the clinical settings also possibly play an important role in the dissemination and spread of
antibiotic resistance.
It is also important to highlight that the present study is limited in terms of scale, and continued
research is required to fully understand the role of marine mammals in the context of maintenance
and spread of antimicrobial resistance.
22References
Arango-Argoty, G., Garner, E., Pruden, A. et al. (2018). DeepARG: a deep learning approach for
predicting antibiotic resistance genes from metagenomic data. Microbiome 6, 23.
https://doi.org/10.1186/s40168-018-0401-z
Aminov, R., Chee-Sanford, J., Garrigues, N., Teferedegne, B., Krapac, I., White, B., & Mackie, R.
(2002). Development, validation, and application of PCR primers for detection of tetracycline efflux
genes of gram-negative bacteria. Applied and Environmental Microbiology, 68(4), 1786-1793.
Berglund, B., Khan, G. A., Weisner, S. E., Ehde, P. M., Fick, J. & Lindgren, P.-E. (2014). Efficient
removal of antibiotics in surface-flow constructed wetlands, with no observed impact on antibiotic
resistance genes. Science of the Total Environment, 476, 29-37.
Biavasco, F., Foglia, G., Paoletti, C., Zandri, G., Magi, G., Guaglianone, E., Sundsfjord, A., Pruzzo, C.,
Donelli, G. & Facinelli, B. (2007). VanA-Type Enterococci from Humans, Animals, and Food: Species
Distribution, Population Structure, Typing and Location, and Virulence Determinants. Applied and
Environmental Microbiology, 73, 3307-3319.
Bolger, A. M., Lohse, M., Usadel, B. (2014). Trimmomatic: a flexible trimmer for Illumina sequence
data. Bioinformatics, 2014 Aug 1;30(15):2114-20. doi: 10.1093/bioinformatics/btu170. Epub 2014
Apr 1.
Börjesson, S., Dienues, O., Jarnheimer, P.-Å., Olsen, B., Matussek, A. & Lindgren, P.-E. (2009).
Quantification of genes encoding resistance to aminoglycosides, β-lactams and tetracyclines in
wastewater environments by real-time PCR. International Journal of Environmental Health Research,
19, 219-230.
Chen, J., Yu, Z., Michel, F. C., Wittum, T. & Morrison, M. (2007). Development and application of real-
time PCR assays for quantification of erm genes conferring resistance to macrolides-lincosamides-
streptogramin B in livestock manure and manure management systems. Applied and Environmental
Microbiology, 73, 4407-4416.
D’costa, V. M., King, C. E., Kalan, L., Morar, M., Sung, W. W., Schwarz, C., Froese, D., Zazula, G.,
Calmels, F. & Debruyne, R. (2011). Antibiotic resistance is ancient. Nature, 477, 457-461.
do Carmo Ferreira, N., Schuenck, R. P., dos Santos, K. R., de Freire Bastos Mdo, C. & Giambiagi-
deMarval, M. (2011). Diversity of plasmids and transmission of high-level mupirocin mupA resistance
gene in Staphylococcus haemolyticus. FEMS Immunology & Medical Microbiology, 61(2):147-52. doi:
10.1111/j.1574-695X.2010.00756.x. Epub 2010 Dec 23.
Finley, R. L., Collignon, P., Larsson, D. J., Mcewen, S. A., Li, X.-Z., Gaze, W. H., Reid-Smith, R.,
Timinouni, M., Graham, D. W. & Topp, E. (2013). The scourge of antibiotic resistance: the important
role of the environment. Clinical Infectious Diseases, cit355.
Franzosa, E., Hsu, T., Sirota-Madi, A. et al. Sequencing and beyond: integrating molecular 'omics' for
microbial community profiling. Nature Reviews Microbiology, 13, 360–372.
https://doi.org/10.1038/nrmicro3451
23Grape, M., Motakefi, A., Pavuluri, S. & Kahlmeter, G. (2007). Standard and real-time multiplex PCR
methods for detection of trimethoprim resistance dfr genes in large collections of bacteria. Clinical
Microbiology and Infection, 13, 1112-1118.
Jia, B., Raphenya, A. R., Alcock, B. et al. (2017). CARD 2017: expansion and model-centric curation of
the comprehensive antibiotic resistance database. Nucleic Acids Research, 45, D1, J D566- D573.
Huijbers, P. M.C. Flach, C-F. & Larsson, D. J. (2019). A conceptual framework for the environmental
surveillance of antibiotics and antibiotic resistance. Environment International, 130, 104880,
https://doi.org/10.1016/j.envint.2019.05.074.
Larsson, D. J. (2014). Antibiotics in the environment. Upsala Journal of Medical Sciences, 119, 108-
112.
Larsson, D. J., Andremont, A., Bengtsson-Palme, J., Brandt, K. K., De Roda Husman, A. M., Fagerstedt,
P., Fick, J., Flach, C.-F., Gaze, W. H., Kuroda, M., Kvint, K., Laxminarayan, R., Manaia, C. M., Nielsen, K.
M., Plant, L., Ploy, M.-C., Segovia, C., Simonet, P., Smalla, K., Snape, J., Topp, E., Van Hengel, A. J.,
Verner-Jeffreys, D. W., Virta, M. P. J., Wellington, E. M. & Wernersson, A.-S. (2018). Critical
knowledge gaps and research needs related to the environmental dimensions of antibiotic
resistance. Environment International, 117, 132-138.
Li, B., Yang, Y., Ma, L. et al. (2015). Metagenomic and network analysis reveal wide distribution and
co-occurrence of environmental antibiotic resistance genes. ISME J 9, 2490–2502
https://doi.org/10.1038/ismej.2015.59
McArthur, A. G., Waglechner, N., Nizam, F., Yan, A., Azad, M. A., Baylay, A. J., Bhullar, K., Canova, M.
J., De Pascale, G. & Ejim, L. (2013). The comprehensive antibiotic resistance database. Antimicrobial
Agents and Chemotherapy, AAC. 00419-13.
McArthur, A. G., Wright, G. D. (2015). Bioinformatics of antimicrobial resistance in the age of
molecular epidemiology. Current Opinion in Microbiology, 27, 45-50.
Nordgård, L., Bjørsvik, M.S., Overballe-Petersen, S., Utnes, A., Pedersen, C., Tømmerås, B. & Nielsen,
K.M. (2016). Prevalence of Antibiotic Resistance Marker Genes (ARMG) in Selected Environments in
Norway M-675|2016. Commissioned by the Norwegian Environment Agency. Tromsø: GenØk -
Centre for Biosafety.
Nordgård, L., Bjørsvik, M. S., Tømmerås, B., Venter, H. J., Olsen, E., Ray, J. L. & Nielsen, K. M. (2017a).
Antimicrobial resistance in selected environments in Norway: Occurrence of antimicrobial resistant
bacteria (ARB) and antimicrobial resistant genes (ARG) associated with wastewater treatment plants
(WWTPS). GenØk - Centre for Biosafety.
Nordgård, L., Furuholmen, I.S., Olsen, E., Nielsen, K.M. & Tryland, M. (2017b). Prevalence of
Antibiotic Resistance Marker Genes (ARMG) in Selected Environments in Norway – Reindeer.
Commissioned by the Norwegian Environment Agency. Tromsø: GenØk - Centre for Biosafety.
Perry, J., Waglechner, N. & Wright, G. (2016). The prehistory of antibiotic resistance. Cold Spring
Harbor Perspectives in Medicine, 6, a025197.
24Risch, D., Castellote, M., Clark, C. W., Davis, G. E., Dugan, P. J., Hodge, L. E., Kumar, A., Lucke, K.,
Mellinger, D. K. & Nieukirk, S. L. (2014). Seasonal migrations of North Atlantic minke whales: novel
insights from large-scale passive acoustic monitoring networks. Movement Ecology, 2, 24.
Roberts, M. C. & Schwarz, S. (2016). Tetracycline and phenicol resistance genes and mechanisms:
importance for agriculture, the environment, and humans. Journal of Environmental Quality, 45, 576-
592.
Schmieder, R. & Edwards, R. (2011). Insights into antibiotic resistance through metagenomic
approaches. Future Microbiology, 7,1, https://doi.org/10.2217/fmb.11.135
Sunde, M., Urdahl, A. M., Norström, M., Madslien, K., Danielsen, A. V., Barstad, A. S., Welde, H.,
Slettemeås, J. S. & Das Neves, C. G. (2018). Antibiotic resistance in terrestrial wild mammal species in
Norway – roe deer and wild reindeer as indicators species. Norway: Norwegian Veterinary Institute.
M-969|2018.
Svanevik, C. S., Grevskott, S. H., Bernssen, L. S., Lunestad, B. T. & Sanden, M. (2018) Kartlegging av
antibiotikaresistens i marine skjel, Rapport fra Havforskningen, nr 10-2018.
Szczepanowski, R., Linke, B., Krahn, I., Gartemann, K.-H., Gützkow, T., Eichler, W., Pühler, A. &
Schlüter, A. (2009). Detection of 140 clinically relevant antibiotic-resistance genes in the plasmid
metagenome of wastewater treatment plant bacteria showing reduced susceptibility to selected
antibiotics. Microbiology, 155, 2306-2319.
Viana, D. S., Santamaría, L. & Figuerola, J. (2016). Migratory birds as global dispersal vectors. Trends
in Ecology & Evolution, 31, 763-775.
Venter, H. (2019). Antimicrobial resistance in the marine environment: MIC profiles of bacteria
isolated from whale and seal faeces. Project report, M-1260|2019, GenØk, Tromsø, Norway.
VKM (by Nielsen, K.M., Gjøen, T., Asare, N., Lunestad, B.-T., Yazdankhah, S., Ytrehus, B., Godfroid, J.,
Jelmert, A., Klein, K., Okoli, A. & Tronsmo, A.) (2018). Antimicrobial resistance in wildlife - potential
for dissemination. Opinion of the Panel on Microbial Ecology, Norwegian Scientific Committee for
Food and Environment. VKM report 2018:07. Oslo, Norway: Norwegian Scientific Committee for
Food and Environment (VKM).
Woegerbauer, M., Zeinzinger, J., Gottsberger, R. A., Pascher, K., Hufnagl, P., Indra, A., et al. (2015).
Antibiotic resistance marker genes as environmental pollutants in GMO-pristine agricultural soils in
Austria. Environmental Pollution, 206, 342-51.
25Appendix 1
Supplementary table 5: information regarding whales from which samples were taken
Whale Sampling Length Diameter Sex F-length Comments
number year
20 2017 760 360
22 2017 790 380 1 37
23 2017 820 420 2 51
24 2017 880 460 2 52
25 2017 830 400 2 42
26 2017 790 400 1 63
28 2017 740 400 1 32
29 2017 900 1 90
30 2017 840 410 2 53
32 2017 860 400 2 60
33 2017 820 400 2 65
35 2017 930 420 1 25
36 2017 800 410 1 57
37 2017 910 450 2 65
38 2017 830 430 2 44
39 2017 850 450 2 78
40 2017 810 430 1 89
41 2017 840 410 2 86
44 2017 920 490 2 86
45 2017 840 450 2 43
46 2017 840 450 1 65
47 2017 820 400
48 2017 710 350
49 2017 840 410 1 19
50 2017 690 340
51 2017 740 400 2 76
52 2017 840 400 1 67
54 2017 910 420 1 71
55 2017 790 400 2 59
56 2017 820 430 1 65
57 2017 810 410 2 76
58 2017 650 340
59 2017 770 410 1 62
60 2017 820 420 Pregnant, but no foetus yet
61 2017 650 350
62 2017 800 360 1 34
63 2017 730 320
64 2017 740 370
65 2017 750 360
86 2018 670 270
2688 2018 800 420 1 78 Liver parasite
90 2018 690 300
92 2018 650 350
93 2018 810 450 2 48
94 2018 850 500 2 139 External abdominal parasite
96 2018 780 440 2 124
97 2018 800 440 1 117
98 2018 820 440 1 120 Liver parasite
99 2018 870 440 2 60
100 2018 810 460 1 131
102 2018 860 460 1 120
103 2018 860 480 2 151
104 2018 820 460 2 149
105 2018 810 470 2 173
107 2018 810 470 2 160
27You can also read