Fraud in highly appreciated fish detected from DNA in Europe may undermine the Development Goal of sustainable fishing in Africa
←
→
Page content transcription
If your browser does not render page correctly, please read the page content below
www.nature.com/scientificreports
OPEN Fraud in highly appreciated fish
detected from DNA in Europe may
undermine the Development Goal
of sustainable fishing in Africa
Carmen Blanco‑Fernandez1,3, Alba Ardura1,3, Paula Masiá1, Noemi Rodriguez2,
Laura Voces1, Marcelino Fernandez‑Raigoso2, Agustín Roca1, Gonzalo Machado‑Schiaffino1,
Eduardo Dopico2 & Eva Garcia‑Vazquez1*
Despite high effort for food traceability to ensure safe and sustainable consumption, mislabeling
persists on seafood markets. Determining what drives deliberate fraud is necessary to improve food
authenticity and sustainability. In this study, the relationship between consumer’s appreciation and
fraudulent mislabeling was assessed through a combination of a survey on consumer’s preferences
(N = 1608) and molecular tools applied to fish samples commercialized by European companies. We
analyzed 401 samples of fish highly consumed in Europe and worldwide (i.e. tuna, hake, anchovy,
and blue whiting) through PCR-amplification and sequencing of a suite of DNA markers. Results
revealed low mislabeling rate (1.9%), with a higher mislabeling risk in non-recognizable products and
significant mediation of fish price between consumer´s appreciation and mislabeling risk of a species.
Furthermore, the use of endangered species (e.g. Thunnus thynnus), tuna juveniles for anchovy,
and still not regulated Merluccius polli hake as substitutes, points towards illegal, unreported and/
or unregulated fishing from African waters. These findings reveal a worrying intentional fraud that
hampers the goal of sustainable seafood production and consumption, and suggest to prioritize
control efforts on highly appreciated species.
For the accomplishment of Goal 12 “Responsible Production and Consumption” (UN Sustainable Development
Goals, SDG, https://s dgs.u
n.o
rg/g oals accessed in January 2021), one of the priorities in food sciences today is the
traceability of the food products to be able to authenticate the species and the geographic origin. It is especially
important to obtain food directly from natural populations, by hunting, fishing or harvesting. Only knowing their
real exploitation level can the natural populations be sustainably managed. When a species is sold for another,
the substitute is exploited without reporting. Moreover, if the substitute species is cheaper, the consumer will
pay an unfair higher price for the product they believe is consumed.
Despite the obvious interest of honest labeling to warrant both the respect of consumers’ rights and resource
sustainability, and increased control efforts, fish mislabeling is still happening in all continents involving species
from all the seas (e.g.1–5. In some marine species as the Atlantic cod Gadus morhua mislabeling is d ecreasing6
while in others like hake it has oscillated over the last decades and seems to be increasing in the last y ears7. DNA
analysis is widely used for becoming increasingly affordable, even when multiple markers are needed1,8,9. Not
always mislabeling is synonymous of fraud. Sometimes it is accidental, for example when different species are
caught together in mixed fisheries and cannot be distinguished easily from morphology, as megrims of the genus
Lepidorhombus or several hakes of the genus Merluccius10. In other cases, however, mislabeling is deliberate so
it can be considered fraudulent. In contrast with accidental mislabeling, deliberate mislabeling is more frequent
in unrecognizable (versus recognizable) p roducts11,12. In recognizable products the head is present and the
whole body contains morphological characteristics that serve to identify the species, while the species cannot be
ascertained visually in unrecognizable products. Often substitute species are cheaper than the original o ne13,14;
fraudulent seafood mislabeling of economic cause happens against the interest of the consumer. Another type
of fraudulent mislabeling occurs as a consequence of illegal, unreported and/or unregulated fishing (IUU); in
1
Department of Functional Biology, University of Oviedo, Oviedo, Spain. 2Department of Education Sciences,
University of Oviedo, Oviedo, Spain. 3These authors contributed equally: Carmen Blanco‑Fernandez and Alba
Ardura. *email: egv@uniovi.es
Scientific Reports | (2021) 11:11423 | https://doi.org/10.1038/s41598-021-91020-w 1
Vol.:(0123456789)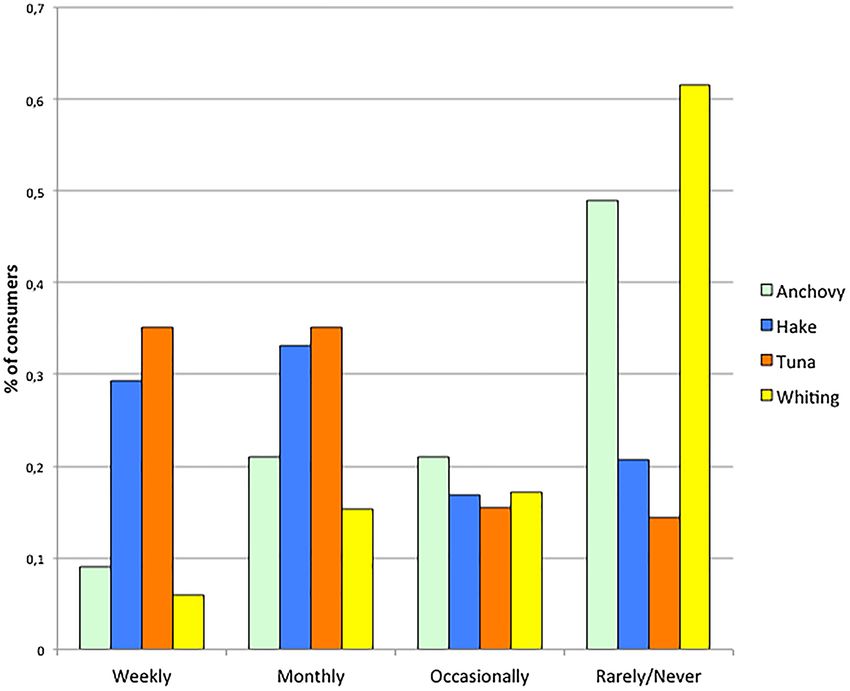
www.nature.com/scientificreports/
those cases the defrauder benefits from selling inadvertently species that are often poorly managed and wild
caught15. Examples are the covered exploitation of protected species, (e.g., high levels of mislabeling concealing
endangered species have reported in s harks16,17, or selling individuals caught over quota as suggested in Miller
et al.18. This is especially pernicious not only for species conservation but also for the society, because selling IUU
catch undermines consumer’s awareness and conscious efforts of sustainable c onsumption19.
In the control of deliberate mislabeling, a priority is to determine the point of the commercial chain and the
type of product where it happens more frequently20; that is to know mislabeling niches for control to be reinforced
therein21. Is there a role of consumer’s appreciation in fish mislabeling? Apparently, it is especially frequent in
highly appreciated products, like sushi22, processed cod products23, scarce and expensive Bluefin tuna Thunnus
thynnus that is commonly replaced by other tuna species24,25. In other words, defrauders sell what the consumer
wants whether the product is real or not. However, fraudulent mislabeling having an important economic com-
ponent, defrauders will substitute preferentially, if not only, expensive species.
In this study we will focus on the relationship between consumer’s appreciation and fraudulent mislabeling
in Spain. This country was chosen for having been identified as one of the countries with highest seafood con-
sumption (42.4 kg/person/year) and also seafood mislabeling in the world14. We considered two species pairs
of blue and white fish, one cheap and one expensive from each type. We analyzed consumer’s appreciation from
self-reported consumption habits, and, using a suite of DNA markers to authenticate seafood samples, we deter-
mined mislabeling in recognizable and unrecognizable fish products.
Expectations were: First, in deliberate mislabeling a higher proportion in not recognizable versus recogniz-
able products and expensive versus cheap species (Hypothesis a). Second, and central to this study, price will
mediate between consumer’s appreciation and % of substitution, more expensive species being more mislabeled
regardless consumer’s appreciation (Hypothesis b).
Results
Fish mislabeling. In total we analyzed genetically 401 fish samples commercialized by European compa-
nies, obtained from 11 stores. DNA extraction and PCR amplification were successful in 365 samples (91% of
success): 83 labeled as anchovy (72 with the scientific name Engraulis encrasicolus, 11 Engraulis sp.), 96 as hake
(40 Merluccius merluccius, 29 M. hubbsi, 27 M. capensis/M. paradoxus), 96 as tuna (57 Thunnus alalunga, 36 T.
albacares, 3 T. obesus) and 90 as blue whiting (Micromessistius poutassou). The sequences of the genetic barcodes
were aligned within species, and the haplotypes (sequence variants) submitted to GenBank, where they are
available with the accession numbers MW557502-MW557516 for control region barcodes and MW549508-
MW549521 for COI barcodes.
Mislabeling was found in seven samples, 1.9% of the total samples analyzed (Table 1): two of anchovy (one
product per sample), two of hake (four products, one in one sample and three in other) and three of tuna (five
products in total: one, two and two per sample). The total proportion of mislabeling was 0% in blue whiting,
2.4% in anchovy, 4.17% in hake and 5.2% in tuna. From the label, five of the 11 mislabeled products were caught
in front of African coasts (Center-NE Atlantic, Central E Atlantic, SE Atlantic), four from European waters (NE
Atlantic, Aegean Sea) and two had no geographic information in the label (Table 2).
Mislabeling was significantly more frequent in not recognizable products (10 out of 11 mislabeled products,
Table 2), and in expensive species that are tuna and hake in this region (only two anchovies and none blue whit-
ing). Mislabeling risk ratio RR of non recognizable versus recognizable products was 1.0369, 95% confidence
[1.005–1.07], being significantly higher than 1 with z = 2.292 and p = 0.022. Similarly, mislabeling RR of expen-
sive versus cheap species was 1.0371, 95% confidence [1.001–1.074], also significant (z = 2.022 with p = 0.043).
A deeper view at the mislabeled products (Table 2) suggests that the mislabeling found in this study could
be compatible with IUU, at least in some cases. Mislabeled anchovies were about 12–13 cm long, and substitute
species were small tuna fry or juveniles, one identified from DNA as yellowfin Thunnus albacares (the capture
region stated on the label was NE Atlantic), and the other as Thunnus alalunga (captured from the Aegean Sea
in the Mediterranean basin). The first one was sold whole, in fresh, eviscerated but with head and tail thus it was
recognizable; the other was frozen headless, tailless and eviscerated. Under European (Regulation EU 850/98
of the European Council of 30 March, 1998) and Spanish laws (Royal Decree 560/1995 of 7 April, 1995), fish
juveniles are protected and these tuna juveniles cannot be caught nor commercialized, thus the origin of these
substitute fish was unequivocally IUU (Table 2). Small tuna fry and adult anchovies are indeed morphologically
different but could be confounded by non-expert consumers, especially when sold headless. Engraulis encra-
sicolus distribution overlaps with spawning areas of Thunnus albacares in northeast African waters, and with
those of Thunnus alalunga in the Mediterranean Sea, thus these substitutions are compatible with capturing tuna
juveniles while fishing anchovy.
All the mislabeled hakes were sold frozen, in fillets or slices, labeled as Merluccius capensis/M. paradoxus
that are South African hakes (Table 2). Three of them were substituted by M. polli that is an African species liv-
ing from tropical and subtropical East Atlantic waters, and overlaps with M. capensis in the southern part of its
distribution. South African M. capensis/paradoxus stocks are fished in a sustainable way certified by the Blue
label of Marine Stewardship Council (https://www.msc.org/home/meet-the-wild-ones/from-sea-to-shelf-wild-
south-african-hake, accessed January 2021), and they should not be caught together with other species. Thus
the cause of this particular substitution is compatible with IUU (without discarding substitution in a later step).
The other mislabeled hake was substituted by north Atlantic cod Gadus morhua which distribution does not
overlap with south African hakes, thus substitution during fishing or landings was not possible in this case and
must have occurred later in the commercial chain (Table 2).
Mislabeled tuna products were all labeled as “bonito del Norte” Thunnus alalunga (longfin or albacore tuna),
which is the most frequently sold tuna species in the region. The three products that were substituted by northern
Scientific Reports | (2021) 11:11423 | https://doi.org/10.1038/s41598-021-91020-w 2
Vol:.(1234567890)
www.nature.com/scientificreports/

                                     Species       Presentation      Store    Selling point   Presentation     N      Mislabeling
                                     Anchovy       Recognizable      A        Supermarket     Unpacked         28     0.036
                                     Anchovy       Recognizable      B        Small shop      Unpacked         9      0
                                     Anchovy       Recognizable      C        Small shop      Unpacked         18     0
                                     Anchovy       Recognizable      J        Small shop      Unpacked         5      0
                                     Anchovy       Unrecognizable    D        Supermarket     Packed           22     0.045
                                     Anchovy       Recognizable      E        Supermarket     Unpacked         1      0
                                     Hake          Recognizable      A        Supermarket     Unpacked         14     0
                                     Hake          Recognizable      K        Small shop      Unpacked         4      0
                                     Hake          Recognizable      C        Small shop      Unpacked         15     0
                                     Hake          Unrecognizable    D        Supermarket     Packed           5      0
                                     Hake          Unrecognizable    E        Supermarket     Packed           21     0
                                     Hake          Unrecognizable    G        Supermarket     Packed           15     0.067
                                     Hake          Unrecognizable    E        Supermarket     Packed           17     0.176
                                     Hake          Unrecognizable    H        Supermarket     Packed           5      0
                                     Tuna          Unrecognizable    A        Supermarket     Unpacked         11     0.091
                                     Tuna          Unrecognizable    C        Small shop      Unpacked         17     0.118
                                     Tuna          Unrecognizable    L        Small shop      Unpacked         2      0
                                     Tuna          Unrecognizable    M        Small shop      Unpacked         8      0
                                     Tuna          Unrecognizable    E        Supermarket     Packed           35     0
                                     Tuna          Unrecognizable    F        Fishmonger      Packed           16     0.125
                                     Tuna          Unrecognizable    N        Small shop      Unpacked         7      0
                                     Whiting       Recognizable      A        Supermarket     Unpacked         25     0
                                     Whiting       Recognizable      O        Small shop      Unpacked         4      0
                                     Whiting       Recognizable      C        Small shop      Unpacked         9      0
                                     Whiting       Unrecognizable    I        Fishmonger      Packed           52     0

                                     Table 1.  Mislabeling found in this study. Presented by species, store, type of selling point and commercial
                                     presentation (as recognizable versus not recognizable).

                           Information on label                   Best match in GenBank–BLAST results
                                                                                     Accession                                                              Mislabeling
Sample           Product   Species             Origin             Species            number            Score       % Identity   Seller        Cause         point
                           Engraulis encra-                       Thunnus albac-
96-BoT           R                             NE Atlantic                           KP298900.1        558         97.26        Superstore    IUU           Ship/FM
                           sicolus                                ares
                           Engraulis encra-
BoCoFAI-33       U                             Aegean Sea         Thunnus alalunga KP412748.1          866         99.26        Superstore    IUU           Ship/FM
                           sicolus
273-Bn1          U         Thunnus alalunga NE Atlantic           Thunnus thynnus EU562888.1           673         98.18        Local store   IUU           Ship/FM
 275-Bn3         U         Thunnus alalunga NE Atlantic           Thunnus thynnus EU562888.1           721         97.85        Local store   IUU           Ship/FM
                                            Center-NE
 276-BnA         U         Thunnus alalunga                       Thunnus thynnus EU562888.1           693         99.22        Superstore    IUU           Ship/FM
                                            Atlantic
                                                                  Thunnus albac-
 BnCBsN-22.2     U         Thunnus alalunga NA                                       AF301199.1        809         99.11        Superstore    IUU           Ship/FM
                                                                  ares
 BnCBsN-22.3     U         Thunnus alalunga NA                    Thunnus obesus     KJ535743.1        472*        88.1         Superstore    IUU           Ship/FM
                           Merluccius capen-
 MCoFMer-2       U                           SE Atlantic          Gadus morhua       MT456169.1        588         100          Superstore    IUU/Economy   FM/SELL
                           sis/paradoxus
                           Merluccius capen- Central E
 Mc-02           U                                                Merluccius polli   EF362877.1        708         100          Superstore    IUU/Economy   FM/SELL
                           sis/paradoxus     Atlantic
                           Merluccius capen- Central E
 Mc-03           U                                                Merluccius polli   EF362877.1        763         99.76        Superstore    IUU/Economy   FM/SELL
                           sis/paradoxus     Atlantic
                           Merluccius capen-
 Mc-04           U                           SE Atlantic          Merluccius polli   EF362877.1        754         99.52        Superstore    IUU/Economy   Ship/FM/SELL
                           sis/paradoxus

                                     Table 2.  Mislabeled and substitute species. Sample code, product type (R: recognizable, U: unrecognizable),
                                     information on the label, BLAST results (species, accession number, score and % of identity with the best
                                     match), selling point (seller), inferred mislabeling cause (IUU as illegal, unreported and unregulated fishing)
                                     and inferred point in the commercial chain where the substitution took place (FM as fishmonger or retailer,
                                     SELL as selling point). Score < 500 marked as *. NA: not available. R, recognizable; U, unrecognizable.

Scientific Reports |   (2021) 11:11423 |                     https://doi.org/10.1038/s41598-021-91020-w                                                                    3

                                                                                                                                                                      Vol.:(0123456789)
www.nature.com/scientificreports/
Figure 1. Consumption of the four species. Presented as the proportion of participants in the survey
consuming a species weekly, monthly, occasionally or rarely/never.
Bluefin tuna Thunnus thynnus (Table 2) were all unrecognizable (slices), but the fish body (without the head) was
visible and slices were cut fresh in front of the customer. They were sold in two different stores. The other two
mislabeled samples did not report the capture region on the label. They were frozen slices, and were identified
from DNA as yellowfin tuna Thunnus albacares and bigeye tuna Thunnus obesus, the last one with lower score
and identity % with the best match in BLAST (Table 2). In the International Union for Conservation of Nature
IUCN red list of threatened s pecies26 Thunnus thynnus appears as globally endangered, T. obesus is vulnerable,
and T. alalunga and T. albacares are near threatened. All the species overlap in the north—center east Atlantic
and the EU has strict fishing quotas T. thynnus within a multiannual recovery plan (Regulation (EU) 2016/1627
of the European Parliament and of the Council of 14 September 2016).
Fish consumption and its relation with mislabeling. In the social survey (N = 1608 participants aged
between 14 and 63 years) the average frequency of fish consumption was 3.13 (SD 0.923), that is, surveyed par-
ticipants declared to eat any fish with a frequency between monthly and weekly (1 being the highest and 5 the
lowest frequency, 3 being weekly), that is, at least monthly. The raw dataset can be found in Rodriguez et al.27.
A clear difference between species was found regarding consumption levels (Fig. 1). Tuna and hake were
consumed weekly and monthly by a much larger proportion of participants than anchovy and whiting. Moreo-
ver, 49% and 61.6% of the participants declared not eating anchovy and blue whiting, respectively, being this
proportion 20.7% for hake and 14.3% for tuna. The difference between species for the pattern of consumption
frequency was highly significant (χ4,42 = 1154.8 with p 2.18, p < 0.05. Mediation effect of price between consumer appreciation and mislabeling was thus signifi-
cant in spite of limited number of species analyzed.
Scientific Reports | (2021) 11:11423 | https://doi.org/10.1038/s41598-021-91020-w 4
Vol:.(1234567890)www.nature.com/scientificreports/
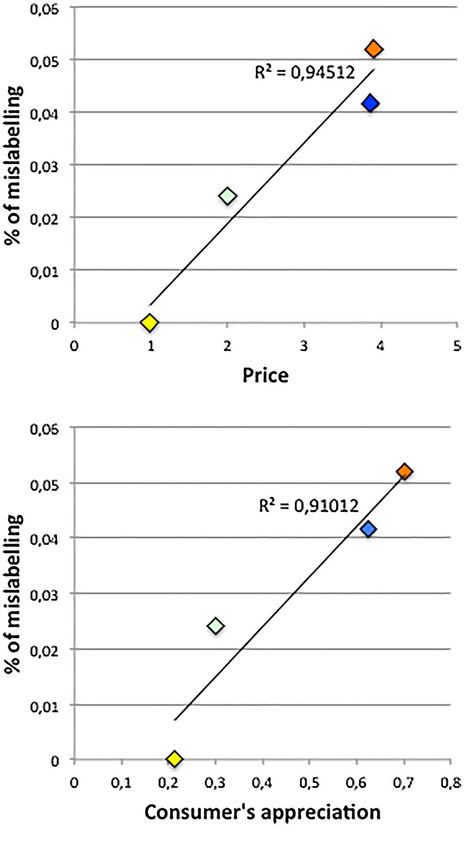
Figure 2. Plots of mislabeling on fish price (above), and on consumer’s appreciation (below). Results of
consumer appreciation are presented as % of weekly and monthly consumers of a species. Linear trends with
their r2 value for slope different from 0 are presented. Color codes: Anchovy = green; hake = blue; tuna = orange;
whiting = yellow.
Figure 3. Model of price as a mediator between consumer’s appreciation price and mislabeling. Arrows
represent relationships between variables. Pearson’s r coefficients and their p-values are given (* for p < 0.05).
Discussion
Combining a suite of molecular tools (three DNA markers and four different protocols) and a social survey
amongst consumers, this work showed several evidences of fraud in appreciated species that are important for
both food sciences and conservation. The mislabeling found in this study was likely fraudulent, since, according
to hypothesis a, its risk was significantly higher in expensive than in cheap species, and in not recognizable than
Scientific Reports | (2021) 11:11423 | https://doi.org/10.1038/s41598-021-91020-w 5
Vol.:(0123456789)www.nature.com/scientificreports/
Variable B SE t p R2
Constant (price) − 0.038 0.407 − 0.092 .935
Species appreciation 5.945 0.806 7.375 .018 0.965
Constant (mislabeling) − 0.012 0.012 1.001 .499
Price 0.015 0.020 0.729 .599 0.941
Species appreciation 0.003 0.122 0.026 .983 0.910
Table 3. Regression analysis of the variables mislabeling (dependent), price (expected mediator) and
consumer’s appreciation (independent). Unstandardized regression coefficients (B) and their standard error
(SE), t statistics and its p-value, and R2 of the partial correlation. Zero-order regression predicting price from
consumer’s appreciation above; below, multiple regression results of the three variables.
in recognizable products. Moreover, according to Hypothesis b it affected principally the species most appreci-
ated by the consumer and amongst them those with higher prices, since price appeared to be a mediator between
consumer’s appreciation (or, directly, consumption of a species) and mislabeling. This result points at the need
of focusing on highly consumed highly priced species as priority mislabeling niche. Inadvertent mislabeling due
to simple morphological confusion between species, frequently reported in previous studies in S pain10, does not
seem the main cause of mislabeling here.
As in other studies, mislabeling occurred in tuna and hake. The level found was comparable to that pub-
lished by other authors in Spain and elsewhere. Sotelo et al.25 found 6.7% mislabeling in fresh and frozen tuna
in European markets of six countries between 2013 and 2014, similar to the 5.2% found here, although in Spain
the level they found (20% in 20 samples) was clearly higher than in our study in which sampling was done six or
five years later. Gordoa et al.24 also found higher levels of tuna mislabeling in Spanish supermarkets in samples
of 2014–2015. It is possible that mislabeling is decreasing in Spain in the last years, following the current trend
of improvement of market operations pointed out by Mariani et al.6 at European level. Thunnus albacares and T.
obesus were the main substitutes in Sotelo et al.25 study, while T. thynnus was the most frequent substitute here.
This reverse substitution (expensive T. thynnus for a cheaper species) has been rare, and when happening it was
interpreted as indicative of illegal o rigin24. All together our results would indicate a change in tuna mislabeling
trends in Spain.
Decrease of hake mislabeling seems to be happening in Europe as well, and the increase of the last years
found in Blanco-Fernandez et al.7 review would be going down in Spain, since the proportion of mislabeled hake
products found here (less than 5%) was low again. A difference with past mislabeling reports was the main sub-
stitute species found here, the Benguela hake Merluccius polli, rarely found as a substitute in other studies7. This
would imply a change in hake substitutes and the unreported introduction of this species in European markets.
Anchovy mislabeling in Europe has been reported b efore28. It affects especially semipreserved products where
it can as high as 16% being Engraulis anchoita the substitute species29. To our knowledge this is the first time
that Thunnus is reported as a substitute of anchovy products. As in hake and tuna, it seems that the mislabeling
trends are changing in this country towards different substitute species.
Although from our data and other s tudies6 fish mislabeling seems to be decreasing in Spain, the substitute spe-
cies of this study are of concern for conservation because they point at the involvement of IUU, one of the causes
of fraud identified by Fox et al.20, in current mislabeling in Spain. Finding small juveniles of near-threatened
Thunnus albacares and T. alalunga sold as anchovy may reveal a serious problem in anchovy fisheries. If they
catch juveniles of other species as by-catch, they are not sufficiently selective of the target species. Being true that
the proportion was small, about 2.4% of the individuals analyzed, multiplying it by the tons of anchovy catch of
Asturias fleet (1 566 059.4 kg in 2019 from official records; https://tematico.asturias.es/dgpesca/fich/992019_Z.
pdf) it would represent about 37,585 kg of unreported tuna fry, more than 35 tons. On the other hand, the use of
endangered Thunnus thynnus (and perhaps the vulnerable Thunnus obesus too) in substitution of less threatened
tuna species is, definitively, a call of attention for the increase of control in European tuna markets, as demanded
by other researchers25. Since the catch areas of label and substitute species overlap, these substitutions would
suggest that Bluefin tuna caught over quota is being sold as another species.
Finally, Merluccius polli –main substitute of M. capensis/paradoxus in hake products here- is now the subject
of sustainable management plan designs in its northern distribution30, while in the center and south the stocks are
largely unknown32. Introducing the species as a substitute in European markets impedes traceability of its catch. It
could be introduced at industrial level (for example to complete a batch of slices or fillets), or be another example
of the use of unregulated fishing products. Selling M. polli from IUU would hamper the efforts of sustainable
management of African hakes, both the currently MSC-certified South African Merluccius capensis/paradoxus
and the future of Benguela hake stocks. introduction of the species as a substitute dustrial.
In conclusion, these results reaffirm a general trend of decreasing mislabeling rates, which is to be expected
as efforts in food sciences for better traceability continue. However, while inadvertent substitutions decrease,
special attention must be directed towards the detection of deliberate fraud. The found substitutes are an indica-
tion for IUUs as a source for fraud. This is a cause for concern and calls for a focus on products that are especially
susceptible to these actions; i.e. highly consumed, expensive products. Monitoring of this type of products must
be reinforced in order to prevent that fraudulent practices reach the consumer’s plate. Moreover, the whole SDG
12 is undermined if conscious consumers cannot be sure of eating really their choice of sustainably caught fish.
Scientific Reports | (2021) 11:11423 | https://doi.org/10.1038/s41598-021-91020-w 6
Vol:.(1234567890)www.nature.com/scientificreports/
Region Expected size Primers Reference Annealing temperature DNA in 20 μl MgCl2 Species
COI-F1
5’- TCAACCAACCACAAAGACATTGGC
Anchovy
AC-3’
COI 655 bp Ward et al. 2004 57 °C 2 μl 1.5 mM Blue whiting
COI-R1
Hake
5’- TAGACTTCTGGGTGGCCAAAGAAT
CA-3’
L15998 2.5 mM Anchovy
5′-TAC CCC AAA CTC CCA AAG CTA-3′
Control region 459 bp Alvarado-Bremer 1994 50 °C 4 μl
CSBDH 2 mM Tuna
5′-TGA ATT AGG AAC CAG ATG CCA G-3′
MmerHK01
5’-GGGGGGGCCGACAGAGTTATA-3’
Control region 436 bp Lundy et al. 2000 55 °C 2 μl 1.5 mM Hake
MmerHK02
5’-CCCGCTAGACTTGCTTACTAA-3’
Table 4. Molecular tools employed in the analysis of fish fraud in this study, per species.
Methods
Ethics statement. This study adheres to good research practices based on the European code of conduct
for research integrity31. Since part of the research required the application of a population survey, the Com-
mittee of Research Ethics of Asturias Principality approved this study with reference 166/19. All methods were
performed in accordance with relevant guidelines and regulations. Prior to the application of the survey, all
participants were provided with an information sheet detailing the objectives of the research and that no per-
sonal data, except age and place of application, would be collected. Informed consent was obtained from all
the participants. Likewise, their willingness to participate in the research was guaranteed. They were invited to
verify their answers, to have access to the study results, and were informed about their right to withdraw from
the process at any time.
Fish sampling. Fresh or frozen commercial products labeled as European anchovy (Engraulis encrasicolus),
hake (genus Merluccius), tuna (genus Thunnus) and blue whiting (Micromessistius poutassou) were purchased
from supermarkets, fishmongers and small shops in the region of Asturias (central south Bay of Biscay, Spain).
Thus, they were products sold to consumers (final points in the commercial chain), all commercialized by Euro-
pean companies. Information about catch and prices of the four fish species in Asturias can be found in the
General Directorate of Fisheries of Asturias Principality, https://tematico.asturias.es/dgpesca/din/estalonj.php
(accessed in January 2021). Official statistics of fish prices in the region in 2019, when the samples were obtained,
gave annual prices of 3.91, 3.89, 2 and 0.98 euro/kg of catch for tuna, hake, anchovy and blue whiting, respec-
tively. Information about life cycles, distribution and spawning areas of these fish, and pictures, are available in
FishBase website32 at www.fishbase.org.
Sampling was designed randomly from the list of stores selling fish in the region. It took place in 2019–2020.
Fish products and labels were photographed and the information annotated in writing for double recording.
Regulations (EU) No 1379/2013 of the European Parliament and of the Council of 11 December 2013 on the
common organization of the markets in fishery and aquaculture products, and (EU) No 1169/2011 of the Euro-
pean Parliament and of the Council of 25 October 2011 on the provision of food information to consumers apply
in Spain. From these regulations, seafood labels must contain at least the following information: common and
scientific names of the species; geographic origin (country of production, or FAO area if from marine fishing);
production method (extractive fisheries or aquaculture).
Products selected were big enough or contained the tail or head, to be sure that each sample corresponded to
one individual. When the product was packed (e.g. fillets or slices) we sampled only one piece by pack. Products
were classed as recognizable (i.e. the head is present and the whole body contains morphological characteristics
that serve to identify the species) or unrecognizable (the species cannot be ascertained visually). Muscle frag-
ments from each sample were cut, preserved in 100% ethanol and stored in the laboratory at 4 °C until analysis.
Molecular analysis. DNA was extracted with Chelex-100 Resine (10%) and 4.5μL proteinase K (20 U/ml,
by EURx) from frozen tissue. Different tools were employed for identification of the different fishes (Table 4).
Cytochrome Oxidase Subunit I gene (COI) was employed for the first identification of blue whiting, anchovy
and hake samples using primers described by Ward et al.33. Tuna was identified using the primer combination
of L15998 with H-strand primer CSBDH, described by Alvarado-Bremer34 and used by Viñas and Tudela35 to
distinguish between the eight Thunnus species from any kind of processed tissue, that amplify a fragment of the
mitochondrial control region.
In some cases, a second marker was necessary to distinguish between different closely related species belong-
ing to the same genus. For anchovy, mitochondrial control region was amplified using the primers described by
Alvarado-Bremer34. Mitochondrial control region was also amplified for the identification of hake samples, but
using primers MmerHK01 and MmerHK02, described by Lundy et al.36.
PCR amplifications were carried out using 10 pmol of each primer, 1.5–2.5 mM MgCl2, 0.25 mM dNTPs,
1 × Buffer GoTaq Promega, 0.15 µl of GoTaq Polymerase (5u/µL) and 2-4µL of DNA in a final volume of 20µL,
with little differences among primers (Table 4).
Scientific Reports | (2021) 11:11423 | https://doi.org/10.1038/s41598-021-91020-w 7
Vol.:(0123456789)www.nature.com/scientificreports/
PCR amplifications were carried out in a thermo cycler ABI PCR 2700 (Applied Biosystems) with the follow-
ing conditions: an initial denaturing step of 90 °C for 5 min, followed by 35 cycles consisting of 30 s of denaturing
at 90 °C, 30 s of annealing at 55 °C for hake-control region amplification and 57 °C for COI, an elongation step
for 45 s at 72 °C, and a final elongation step at 72 °C for 15 min after the cycles for hake-control region, and for
10 min for COI. And an initial denaturing step of 94 °C for 5 min, followed by 35 cycles consisting of 45 s of
denaturing at 94 °C, 45 s of annealing at 50 °C, an elongation step for 1 min at 72 °C, and a final elongation step
at 72 °C for 5 min for anchovy and tuna control region. Resulting amplicons were sent for Sanger sequencing
to Macrogen Inc. (Spain).
Sequences were edited with BioEdit v.7.0.5.3. and Lasergene Seqman software by DNASTAR37. Sequences
obtained from forward and reverse primers separately were combined whenever possible to obtain a more robust
barcode. Edited sequences were compared to GenBank sequence database, using BLAST (Basic Tool Alignment
Search Tool) (https://blast.ncbi.nlm.nih.gov/Blast.cgi) optimized for highly similar sequences (megablast), with
word size = 28, match/mismatch scores of 1 and -2, linear gap costs, threshold 0.05. The best match hit was chosen
as putative species of the sample from DNA.
Survey to investigate consumers’ preferences. To know the habits and preferences regarding fish
consumption, a survey was conducted in urban and rural geographical areas of Asturias. This Spanish province
of 1,000,000 inhabitants has a rich tradition of fishing and seafood is important in its gastronomy. In a face-to-
face format, the researchers went to secondary education centers, university schools/faculties and consumer
centers for its application. Participants were asked to indicate their age, gender and place of residence. Two
questions about fish consumption followed. The first question (five possible choices) was: “How frequently do
you consume fish normally? Please choose one of the following options: (1) More than 5 days a week; (2) Between
2 and 5 days a week; (3) One or two days a week; (4) Monthly; (5) Less than monthly”. Then they were asked for
the frequency of consumption of each of the four target species using the following question: “How frequently do
you eat the following species? Please choose the option that fits best your consumption habits”, with four possible
choices: (1) Weekly; (2) Monthly; (3) Occasionally; (4) Rarely/Never”.
Statistics. To test hypothesis a about fraudulent mislabeling, comparison between different types of samples
(e.g. recognizable versus not recognizable, cheap versus expensive species, etc.) regarding the proportion of mis-
labeled samples was done employing the risk ratio (RR), with z tests and their p Ho being RR = 1.
Differences in consumption between the four fish species based on the number of informers consuming a
species weekly, monthly, occasionally or [rarely + never] (four classes, four species) were tested using Chi-square
of contingency with nine degrees of freedom.
The variable Consumer’s appreciation of a species was estimated based on the average of total fish consump-
tion. The proportion of participants that consume a fish species (anchovy, hake, tuna, blue whiting) at a frequency
at least equal to the average frequency of any fish consumption (first question) was taken as a proxy of regional
consumer’s appreciation of that species. Pairwise correlations between this variable, price and proportion of
mislabeled products were calculated using Pearson’s r. The hypothesis of price as a mediator between consumer’s
appreciation and mislabeling was tested from the distribution of products following MacKinnon et al.38 and
Wuensch39, taking into account the small number of fish species where substitution was measured. Briefly,
β = unstandardized regression coefficient for predicting the mediator (price) from the independent variable
(consumer’s appreciation), and α = partial unstandardized regression coefficient for predicting mislabeling from
price holding constant the consumer’s appreciation were divided by the standard errors to calculate Z β and Zα
scores respectively. For a 0.05 non-directional test the critical value of the statistics Z
α*Zβ is 2.18. Thus, higher
values can be considered significant.
Significance threshold was p < 0.05. Statistics was done with free software PAST version 2.17c40.
Received: 18 February 2021; Accepted: 20 May 2021
References
1. Helyar, S. J. et al. Fish product mislabelling: Failings of traceability in the production chain and implications for Illegal, Unreported
and Unregulated (IUU) fishing. PLoS ONE 9(6), e98691. https://doi.org/10.1371/journal.pone.0098691 (2014).
2. Delpiani, G. et al. Are we sure we eat what we buy? Fish mislabelling in Buenos Aires province, the largest sea food market in
Argentina. Fish. Res. 221, 105373 (2020).
3. Do, T. D. et al. Assessment of marine fish mislabeling in South Korea’s markets by DNA barcoding. Food Control 100, 53–57.
https://doi.org/10.1016/j.foodcont.2019.01.002 (2019).
4. Lamendin, R., Miller, K. & Ward, R. D. Labelling accuracy in Tasmanian seafood: An investigation using DNA barcoding. Food
Control 47, 436–443. https://doi.org/10.1016/j.foodcont.2014.07.039 (2015).
5. Nedunoori, A., Turanov, S. V. & Kartavtsev, Y. P. Fish product mislabeling identified in the Russian far east using DNA barcoding.
Gene Rep. 8, 144–149. https://doi.org/10.1016/j.genrep.2017.07.006 (2017).
6. Mariani, S. et al. Low mislabeling rates indicate marked improvements in European seafood market operations. Front. Ecol. Environ.
13, 536–540 (2015).
7. Blanco-Fernandez, C., Garcia-Vazquez, E. & Machado-Schiaffino, G. Seventeen years analysing mislabelling from DNA barcodes:
towards hake sustainability. Food Control https://doi.org/10.1016/j.foodcont.2020.107723 (2021).
8. Barcaccia, G., Lucchin, M. & Cassandro, M. DNA barcoding as a molecular tool to track down mislabeling and food piracy. Diversity
https://doi.org/10.3390/d8010002 (2016).
9. Pérez, M., Santafé-Muñoz, A. M., Balado, M. & Presa, P. Methodological evaluation of DNA-based molecular keys to identify
categories of mislabelling in commercial products from genus Merluccius spp. Food Chem. 239, 640–648. https://d oi.o
rg/1 0.1 016/j.
foodchem.2017.06.138 (2018).
Scientific Reports | (2021) 11:11423 | https://doi.org/10.1038/s41598-021-91020-w 8
Vol:.(1234567890)www.nature.com/scientificreports/
10. Crego-Prieto, V. et al. Inaccurate labelling detected at landings and markets. The case of European megrims. Fish. Res. 129–130,
106–109. https://doi.org/10.1016/j.fishres.2019.105373 (2010).
11. Garcia-Vazquez, E., Machado-Schiaffino, G., Campo, D. & Juanes, F. Species misidentification in mixed hake fisheries may lead
to overexploitation and population bottlenecks. Fish. Res. 114, 52–55 (2012).
12. Galal-Khallaf, A., Ardura, A., Mohammed-Geba, K., Borrell, Y. J. & Garcia-Vazquez, E. DNA barcoding reveals a high level of
mislabeling in Egyptian fish fillets. Food Control 46, 441–445 (2014).
13. Muñoz-Colmenero, M., Blanco, O., Arias, V., Martinez, J. L. & Garcia-Vazquez, E. DNA authentication of fish products reveals
mislabeling associated to seafood processing. Fisheries 41(3), 130–140 (2016).
14. Muñoz-Colmenero, M., Juanes, F., Dopico, E., Martinez, J. L. & Garcia-Vazquez, E. Economy matters: A study of mislabeling in
salmon products from two regions, Alaska and Canada (Northwest of America) and Asturias (Northwest of Spain). Fish. Res. 195,
180–185 (2017).
15. Pardo, M. A. et al. DNA barcoding revealing mislabeling of seafood in European mass caterings. Food Control 92, 7–16 (2018).
16. Kroetz, K. et al. Consequences of seafood mislabeling for marine populations and fisheries management. Proc. Natl. Acad. Sci.
USA 117(48), 30318–30323 (2020).
17. Pazartzi, T. et al. High levels of mislabeling in shark meat – Investigating patterns of species utilization with DNA barcoding in
Greek retailers. Food Control 98, 179–186. https://doi.org/10.1016/j.foodcont.2018.11.019 (2019).
18. Almerón-Souza, F. et al. Molecular identification of shark meat from local markets in Southern Brazil based on DNA barcoding:
Evidence for mislabeling and trade of endangered species. Front. Genet. 9, 1–12. https://doi.org/10.3389/fgene.2018.00138 (2018).
19. Miller, D., Jessel, A. & Mariani, S. Seafood mislabelling: Comparisons of two western European case studies assist in defining
influencing factors, mechanisms and motives. Fish Fish. 13, 345–358. https://doi.org/10.1111/j.1467-2979.2011.00426.x (2012).
20. Jacquet, J. L. & Pauly, D. Trade secrets: Renaming and mislabeling of seafood. Mar. Policy 32(3), 309–318 (2008).
21. Fox, M., Mitchell, M., Dean, M., Elliott, C. & Campbell, K. The seafood supply chain from a fraudulent perspective. Food Secur.
10, 939–963. https://doi.org/10.1007/s12571-018-0826-z (2018).
22. Muñoz-Colmenero, M. et al. Evolution of hake mislabeling niches in commercial markets. Food Control 54, 267–274 (2015).
23. Willette, D. A. et al. Using DNA barcoding to track seafood mislabeling in Los Angeles restaurants. Conserv. Biol. 31, 1076–1085.
https://doi.org/10.1111/cobi.12888 (2017).
24. Carvalho, D. C., Palhares, R. M., Drummond, M. G. & Gadanho, M. Food metagenomics: Next generation sequencing identifies
species mixtures and mislabeling within highly processed cod products. Food Control 80, 183–186. https://d oi.o
rg/1 0.1 016/j.f oodc
ont.2017.04.049 (2017).
25. Gordoa, A., Carreras, G., Sanz, N. & Viñas, J. Tuna species substitution in the Spanish commercial chain: a knock-on effect. PLoS
ONE 12(1), e0170809. https://doi.org/10.1371/journal.pone.0170809 (2017).
26. Sotelo, C. G. et al. Tuna labels matter in Europe: mislabelling rates in different tuna products. PLoS ONE 13(5), e0196641. https://
doi.org/10.1371/journal.pone.0196641 (2018).
27. IUCN (2020). The IUCN Red List of Threatened Species. Version 2020–3. https://www.iucnredlist.org. Downloaded on January
2021.
28. Rodriguez, N., Fernandez-Raigoso, M., Masia, P., Garcia-Vazquez, E. & Dopico, E. Seafood consumption in north Spain. Mendeley
Data https://doi.org/10.17632/zs5d9grhyr.1 (2021).
29. Jérôme, M. et al. Toward fish and seafood traceability: anchovy species determination in fish products by molecular markers and
support through a public domain database. J. Agric. Food Chem. 56(10), 3460–3469 (2008).
30. Velasco, A., Aldrey, A., Perez-Martin, R. & Sotelo, C. G. Assessment of the labeling accuracy of Spanish semipreserved anchovies
products by FINS (forensically informative nucleotide sequencing). Heliyon 2, e00124. https://d oi.o
rg/1 0.1 371/j ourna l.p one.0 0076
06 (2016).
31. Fernández-Peralta, L., Quintanilla, L. F., & Rey, J. (2017). Overlapping distribution of two sympatric species: the case of black
hakes, Merluccius polli Cadenat 1960 and Merluccius senegalensis Cadenat 1960, off Mauritania. In Deep-Sea Ecosystems Off Mau-
ritania (pp. 241–275). Springer, Dordrecht.
32. FAO (2020). Report of the Twenty-Second Session of the Fishery Committee for the Eastern Central Atlantic, Libreville, Gabon,
17–19 September 2019. FAO Fisheries and Aquaculture Report. No. 1303. Rome. https://doi.org/10.4060/ca8000b
33. ALLEA (2017). The European Code of Conduct for Research Integrity. Revised Edition. - All European Academies: Berlin.
34. Froese, R. & Pauly, D. (eds) FishBase 2000: concepts, design and data sources 344 (ICLARM, 2000).
35. Ward, R. D., Zemlak, T. S., Innes, B. H., Last, P. R. & Hebert, P. D. N. DNA barcoding Australia’s fish species. Philosophical Trans.
Royal Soc. B Biol. Sci. 360, 1847–1857. https://doi.org/10.1098/rstb.2005.17164 (2005).
36. Alvarado Bremer, J.R. (1994). Assessment of morphological and genetic variation of the swordfish (Xiphias gladius Linnaeus):
evolutionary patterns of nucleotide substitution in the mitochondrial genome. Toronto, Ontario, Canada: University of Toronto.
Ph.D. dissertation.
37. Viñas, J. & Tudela, S. A Validated Methodology for Genetic Identification of Tuna Species (Genus Thunnus). PLoS ONE 4(10),
e7606 (2009).
38. Lundy, C. J., Rico, C. & Hewitt, G. M. Temporal and spatial genetic variation in spawning grounds of European hake (Merluccius
merluccius) in the Bay of Biscay. Mol. Ecol. 9, 2067–2079. https://doi.org/10.1046/j.1365-294X.2000.01120.x (2000).
39. Burland T.G. (2000) DNASTAR’s Lasergene Sequence Analysis Software. In: Misener S., Krawetz S.A. (eds) Bioinformatics Methods
and Protocols. Methods in Molecular Biology™, vol 132. Humana Press, Totowa, NJ. https://doi.org/10.1385/1-59259-192-2:71
40. MacKinnon, D. P., Lockwood, C. M., Hoffman, J. M., West, S. G. & Sheets, V. A comparison of methods to test mediation and other
intervening effects. Psychol. Methods 12, 23–44 (2002).
41. Wuensch, K.L. (2012). Screening data. Retrieved from http://core.ecu.edu/psyc/wuenschk/MV/Screening/Screen.docx on January
2021.
42. Hammer, Ø., Harper, D. A. T. & Ryan, P. D. PAST: Paleontological statistics software package for education and data analysis.
Palaeontol. Electron. 4(1), 9 (2001).
Acknowledgements
We are grateful to Marta Rodríguez (Asturpesca SL) for help with sampling, and to the Environmental Health
and Consumer Agency of the Principality of Asturias for their collaboration in the social survey. Ana Palacio,
Celia Delgado, Pablo Alba and Sara Rodríguez de Diego contributed to laboratory tasks.
Author contributions
CBF and GMS led molecular analysis, AA coordinated sampling and laboratory work, ED coordinated the
social survey, AR worked crucially on sampling, LV contributed to DNA analysis, NR and PM conducted the
social survey where MFR contributed significantly, EGV designed the study and coordinated data analysis and
manuscript writing, all the authors contributed to writing and manuscript preparation.
Scientific Reports | (2021) 11:11423 | https://doi.org/10.1038/s41598-021-91020-w 9
Vol.:(0123456789)www.nature.com/scientificreports/
Funding
Funding was provided by Ministerio de Ciencia e Innovación grant number PID2019-108347RB-I00 and Gobi-
erno del Principado de Asturias grant number GRUPIN IDI-2018-000201.
Competing interests
The authors declare no competing interests.
Additional information
Correspondence and requests for materials should be addressed to E.G.-V.
Reprints and permissions information is available at www.nature.com/reprints.
Publisher’s note Springer Nature remains neutral with regard to jurisdictional claims in published maps and
institutional affiliations.
Open Access This article is licensed under a Creative Commons Attribution 4.0 International
License, which permits use, sharing, adaptation, distribution and reproduction in any medium or
format, as long as you give appropriate credit to the original author(s) and the source, provide a link to the
Creative Commons licence, and indicate if changes were made. The images or other third party material in this
article are included in the article’s Creative Commons licence, unless indicated otherwise in a credit line to the
material. If material is not included in the article’s Creative Commons licence and your intended use is not
permitted by statutory regulation or exceeds the permitted use, you will need to obtain permission directly from
the copyright holder. To view a copy of this licence, visit http://creativecommons.org/licenses/by/4.0/.
© The Author(s) 2021
Scientific Reports | (2021) 11:11423 | https://doi.org/10.1038/s41598-021-91020-w 10
Vol:.(1234567890)You can also read