Flow and wake characteristics associated with large wood to inform river restoration
←
→
Page content transcription
If your browser does not render page correctly, please read the page content below
www.nature.com/scientificreports
OPEN Flow and wake characteristics
associated with large wood
to inform river restoration
Isabella Schalko1,2*, Ellen Wohl3 & Heidi M. Nepf1
Wood is an integral part of a river ecosystem and the number of restoration projects using log
placements is increasing. Physical model tests were used to explore how the wood position and
submergence level (discharge) affect wake structure, and hence the resulting habitat. We observed
a von-Kármán vortex street (VS) for emergent logs placed at the channel center, while no VS formed
for submerged logs, because the flow entering the wake from above the log (sweeping flow) inhibited
VS formation. As a result, emergent logs placed at the channel center resulted in ten times higher
turbulent kinetic energy compared to submerged logs. In addition, both spatial variation in time-mean
velocity and turbulence level increased with increasing log length and decreasing submergence level.
Submerged logs and logs placed at the channel side created a greater velocity deficit and a longer
recirculation zone, both of which can increase the residence time in the wake and deposition of organic
matter and nutrients. The results demonstrate that variation in log size and degree of submergence
can be used as a tool to vary habitat suitability for different fish preferences. To maximize habitat
diversity in rivers, we suggest a diverse large wood placement.
Over the past centuries, human interventions have significantly impacted the characteristics of rivers, such as
flow regime or channel g eometry1. Due to these actions, many rivers worldwide exhibit sediment deficit as well
as hydraulic and morphological degradation2,3. The imbalance of flow, sediment, and wood discharge has severe
effects on the river ecosystem such as loss of fish spawning habitat or channel incision1,4. The restoration of river
habitat has become a critical problem throughout the world, with prominent activities in Europe, Australia, and
the USA, representing projects worth billions of US d ollars5,6. The majority of river projects focus on restoring
the flow and sediment regimes4. However, consideration of the natural wood regime is also crucial, because wood
provides habitat and contributes to nutrient cycling by trapping fine material4. The number of river restoration
projects including wood has increased within the past d ecades7,8, as the perception of wood in rivers is shifting
from a hazard towards a beneficial and valuable part of a river ecosystem7,9,10. Wood plays an essential role for
a river ecosystem, as it can create heterogeneous flow conditions and morphological s tructures11,12. Individual
pieces (Fig. 1) through large accumulations of multiple pieces can create different, distinctive, local- to reach-scale
hydraulic and geomorphic features13. Similar to a vegetation patch or boulder14, ecologically beneficial dead-water
zones, a region characterized by low flow velocity and reduced mixing, may form up- or downstream of logs,
in which nutrients, organic matter, or sediments can be d eposited15–19. In addition, wood increases the vertical
connectivity and residence time of hyporheic exchange fl ow20,21 and provides habitat for fi
sh7,22,23.
A common restoration method using wood is an engineered log jam (ELJ), defined as a groyne-like structure
anks24, or stabilize an incised c hannel25. Design guidelines on ELJs
installed to alter the flow, protect the river b
have been summarized in several publications ( Brooks24, Abbe and B rooks26, USBR & E RDC8), with special
focus on Australia and the US Pacific Northwest. The majority of previous studies focused on emergent ELJs
with different designs27,28, discharge c onditions29, and p orosity30. For ELJs with increasing porosity, the flow
passing through the ELJ into the downstream wake (bleed flow) reduced the downstream turbulence levels and
scour29,30. Emergent ELJs located at the channel wall created reduced velocity just downstream of the structure,
a lateral mixing layer extending about one-half of the structure’s width into the flow, and enhanced velocity at
the center of the channel, extending to the opposite b ank27. Individual logs that span the channel or logjams of
multiple logs are also used in restoration and may induce an increase in upstream water depth (backwater rise)
due to the blocked flow cross-section. As the backwater effect is proportional to the obstruction ratio, defined as
the ratio of log dimensions with respect to the channel width and flow depth31,32, an emergent logjam will lead to
1
Department of Civil and Environmental Engineering, Massachusetts Institute of Technology, Cambridge, MA,
USA. 2Laboratory of Hydraulics, Hydrology and Glaciology, ETH Zurich, Zurich, Switzerland. 3Department of
Geosciences, Colorado State University, Fort Collins, CO, USA. *email: ischalko@mit.edu
Scientific Reports | (2021) 11:8644 | https://doi.org/10.1038/s41598-021-87892-7 1
Vol.:(0123456789)
www.nature.com/scientificreports/
Figure 1. Side channel with wood placements at the Trinity River, California, USA (photo: I. Schalko).
larger backwater rise and pool formation. Most logjams have some flow through or below them, although some
jams are effectively impermeable and have flow only over the top33.
To plan and evaluate river restoration projects that aim to create habitat for fish, it is crucial to anticipate the
changes in flow velocity and turbulence characteristics. Smith et al.34 hypothesized that fish select their habitat
based on turbulence attraction and avoidance. Fish sense increased turbulence due to flow separation and use
this to locate roughness elements such as wood for cover (i.e., attraction)34. Within the wake of wood, fish then
select a region with lower turbulence level (i.e., avoidance)34, which can provide velocity s helters34,35. Other stud-
ies on fish locomotion demonstrated that fish seek areas of increased turbulence to reduce locomotory c osts35–37
and alter their body kinematics to match the vortex shedding frequency of a structure37,38. According to Tullos
and Walter39, wood can establish both regions of reduced velocity (wake), which provide shelter for resting,
and also regions of increased velocity (next to wood placement), which provide higher drift densities for more
efficient feeding and higher rates of energy gain. However, flow characteristics such as vorticity and eddy length
can also affect the swimming capabilities of fish. Fish tend to lose their postural control when the length-scales
of shear and turbulent eddies are comparable to the body dimensions of the fish40,41. The flow around a single
log is similar to flow around a bluff body, producing a wake with reduced velocity and transverse shear that may
enhance turbulence production at the scale of the body.
Previous studies on engineered wood for restoration have mainly focused on emergent ELJs. In prototype, a
wood placement may be submerged during higher discharges, while being emergent during lower discharges.
When a log is submerged, flow passing over the log and into the wake (sweeping flow) may suppress the formation
of the von-Kármán vortex street (VS), as observed for submerged vertical cylinders42, groynes42, porous vegeta-
tion patches43, and porous E
LJ30. The magnitude of sweeping flow will depend on both the degree of submergence
and the length of the log (cross-channel length-scale), but these dependencies have not yet been defined. The sup-
pression of the VS will have implications for the extent of the recirculation zone, magnitude of turbulent kinetic
energy, and spatial footprint of reduced velocity in the channel. The flow structures governing fish behavior are
known, but knowledge is missing on the flow and wake structures of different wood placements. Therefore, we
conducted physical model tests to study the flow and wake structures due to different wood placements on a
solid bed. The time-mean velocity, turbulent kinetic energy, and turbulence integral length-scale were analyzed
for various wood placements and relative submergence levels and compared to the approach flow condition. The
different wood placements were characterized by different log lengths, log diameters, log orientation relative to
the flow, and location of wood placement at the channel center versus at the channel sidewall. The experiments
presented here considered individual logs that partially spanned the channel, thereby representing a sub-set of
natural and engineered conditions. The results from physical model tests were compared to field observations.
Finally, the implications for fine particles deposition and fish habitat creation were considered.
Method
The flume experiments were conducted at the Massachusetts Institute of Technology in a 12.2 m long, 1.2 m wide,
and 0.70 m deep glass-walled channel with a fixed bed. The test setup and notation are illustrated in Fig. 2. The
flow discharge Q was controlled by a variable-speed pump and measured with a flow meter. The cross-sectional
averaged velocity was defined as U = Q/(B h) with B = channel width, and h = flow depth. The approach flow
(AF) conditions were measured 1 m upstream of the log placement. A single log was modeled using a PVC pipe
with a roughness coat (equivalent sand roughness in prototype of ks = 5 mm) to imitate bark. The log diameters
were d = 0.06 m, 0.09 m, and 0.11 m, and the log lengths were L = 0.13 m, 0.25 m, 0.50 m, and 0.75 m. The log
was placed at the channel center (Fig. 2a) and at the side (Fig. 2b). The log orientation angles to the flow in the
horizontal plane were γ = 90° (perpendicular to the flow), 45°, and 30°. The experiments were designed based on
both Reynolds number (R = U h/v, RL = U L/v) and Froude number (F = U/(g h)0.5) similitude, with g = gravita-
tional acceleration. Specifically, R = 104 and R
L > 104, ensuring fully turbulent flow and turbulent wake structures.
Scientific Reports | (2021) 11:8644 | https://doi.org/10.1038/s41598-021-87892-7 2
Vol:.(1234567890)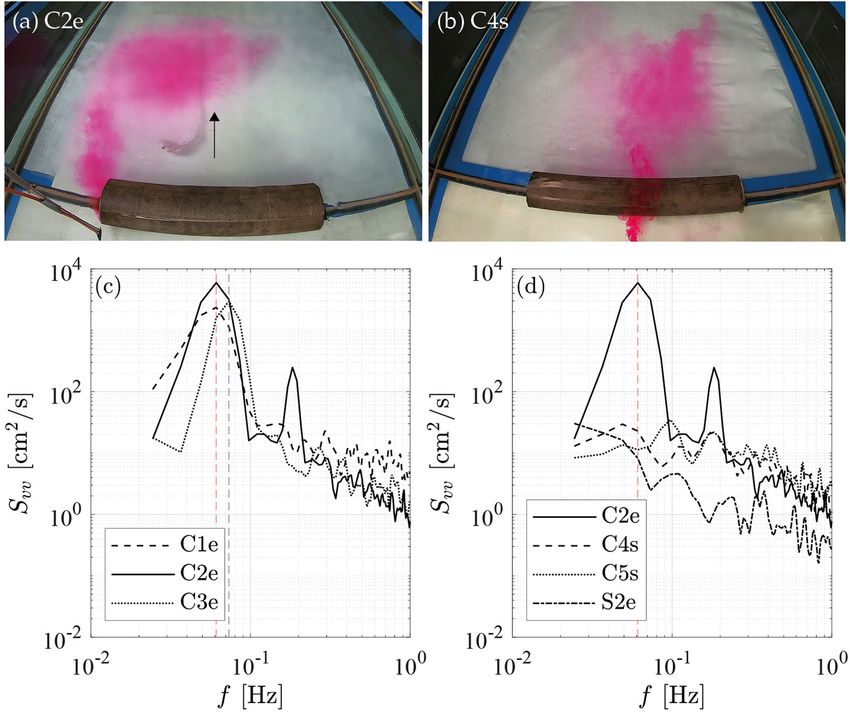
www.nature.com/scientificreports/
Figure 2. (a) Plan view of test setup with log positioned at channel center, denoted by “C” and (b) side, denoted
by “S”, with U = cross-sectional averaged flow velocity, Q = discharge, d = log diameter, L = log length, γ = log
orientation angle, B = channel width, and h = flow depth; (c) side view of emergent and submerged log; (d) photo
of flume experiment looking downstream. Note that x = 0 was defined at the downstream trailing edge of the log.
The flow velocity (streamwise u, lateral v, and vertical w) was measured along vertical, lateral, and longitudinal
profiles up- and downstream of the log using Acoustic Doppler Velocimetry (Nortek Vectrino). A downward
looking probe was used with 200 Hz sampling rate measured for a duration of 240 s to reach convergence.
The velocity records were despiked and filtered according to Goring and Nikora44. Each velocity record was
decomposed into the time-mean (u, v, w) and fluctuating (u′, v′, w′) components using a MATLAB script. The
turbulent kinetic energy was
kt = (u′2 + v ′2 + w ′ 2)/2. (1)
The longitudinal profile at log center was used to evaluate the location of the minimum and maximum value
of u and kt and to characterize the wake and recirculation zone dimensions.
The wake length Lw was defined as the distance from the trailing edge of the log to the position at which u = U
or d u/dx = 0 (± 10%). The length of the reattachment zone Lr was set as the distance from the log trailing edge
to the position at which the recirculating flow recovered and u ≥ 0. For selected tests, dye was added to the flow
to visualize the vortex structures. The integral length scale Lx was determined from the autocorrelation function
of the local streamwise velocity at multiple positions downstream of the log. For this method, only positions
for which u > 0 (i.e., not in a recirculation zone), and turbulence strength urms small compared to u could be
considered (see details in Supplementary Information). For tests with an observed VS, the integral length scale
Λpeak associated with the peak frequency fpeak, v of the power spectra of the lateral velocity component Svv was also
estimated, as this reflects the size of the coherent VS structures. The procedures to determine the integral length
scales are described in detail in the Supplementary Information. The test program is summarized in Table 1.
Experiments with the log at the channel center (C1–C7) were conducted for emergent logs with various lengths
(C1e–C3e, L), and for submerged logs with two diameters (C4s–C5s, d) and different log orientations to the flow
(C6e–C7e, γ). The experiments with the log placed at the channel side (S1–S7) were performed for emergent
logs (S1e–S3e) and submerged logs (S4s–S7s) with various lengths.
Approach flow characteristics. The approach flow was defined 1 m upstream of the log. The vertical
profiles of time-averaged velocity u followed the logarithmic distribution characteristic for quasi-uniform open-
channel flows (Fig. 3a)
Scientific Reports | (2021) 11:8644 | https://doi.org/10.1038/s41598-021-87892-7 3
Vol.:(0123456789)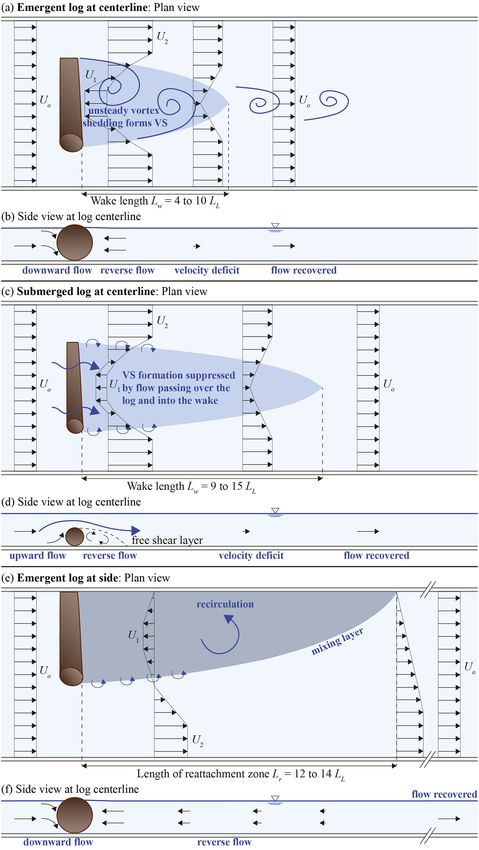
www.nature.com/scientificreports/

                                             Log        Log        Relative                                                 Reattach-     TKE
                      Test       Discharge   length     diameter   submergence     Log angle          Wake length           ment length   length     Integral length scale
                      #          Q (l/s)     L (m)      d (m)      h/d (–)         γL (°)             Lw (m)                Lr (m)        LTKE (m)   x (m)        peak(m)
                      C1e        12.72       0.75       0.11       0.91            90                 3.50                  –             2.00        1.3 ± 0.7    0.77
                      C2e        12.72       0.50       0.11       0.91            90                 2.00                                1.50       0.16 ± 0.08   0.46
                      C3e        12.72       0.25       0.11       0.91            90                 2.50                                0.23       0.04 ± 0.01   0.20
                      C4s        12.72       0.50       0.09       1.63            90                 4.50                                0.27       0.08 ± 0.05   –
                      C5s        12.72       0.50       0.06       1.17            90                 6.00                                0.19       0.07 ± 0.07
                      C6s        12.72       0.50       0.09       1.17            45                 5.50                                0.18       0.06 ± 0.03
                       C7s       12.72       0.50       0.09       1.17            30                 3.50                                0.27       0.04 ± 0.04
                       S1e       12.72       0.50       0.11       0.91            90                 –                     6.50          5.00       0.23          –
                       S2e       12.72       0.25       0.11       0.91            90                                       3.50          3.50       0.23 ± 0.10
                       S3e       12.72       0.13       0.11       0.91            90                                       1.50          1.50       0.09 ± 0.07
                       S4s       12.72       0.50       0.09       1.17            90                                       3.00          0.27       0.05 ± 0.04
                       S5s       12.72       0.25       0.09       1.17            90                                       2.50          0.18       0.11 ± 0.08

                                             Table 1.  Test program with flow depth h = 0.10 m and cross-sectional average velocity U = 0.10 m/s (C = log
                                             at center, S = log at side, e = emergent, s = submerged). The measured wake length Lw and reattachment length
                                             Lr exhibit a consistent uncertainty of Ο(L) due to measurement spacing. Longitudinally averaged x with
                                             standard deviation (except for S1e, which is a single measurement point). For cases with a VS (C1e–C3e), the
                                             peak integral length scale peak is also listed.

                                                       0.1                                   1

                                                    0.075                               0.75

                                                      0.05                                  0.5

                                                    0.025                               0.25

                                                        0                                    0
                                                             0     0.05          0.1              0            0.6   1 1.2

                                             Figure 3.  Vertical profiles of (a) approach flow velocity (solid line represents logarithmic law, Eq. 2) and (b)
                                             relative turbulent shear stress (dashed line represents linear profile, Eq. 3).


                                                                                                          2.3u∗             z
                                                                                                  ū(z) =       log10            ,                                            (2)
                                                                                                            κ               z0
                                             with u* = shear velocity, z0 = characteristic roughness, and κ = 0.40 is the von-Kármán’s constant. Both u* and z0
                                             were estimated by fitting the velocity profiles using Eq. (2). In addition, the measured vertical profiles of the
                                             turbulent shear stress −u′ w ′ (Fig. 3b) follow the expected linear trend
                                                                                                              z
                                                                                             −u′ w ′ = u∗2 1 −     .                                        (3)
                                                                                                               h
                                                The value for u* was estimated by fitting the turbulent shear stress profiles using Eq. (3). For the subsequent
                                             analysis, u* was determined by averaging the results of Eqs. (2) and (3) with u* = 0.0039 m/s. Based on u* and U
                                             we can define the quadratic-law bed friction parameter Cf = 2 (u*/U)2 = 0.0035.

                                             Results and discussion
                                             Wake characteristics and spectral analysis. For an emergent log, the approach flow was deflected later-
                                             ally around the log, creating a lateral gradient in velocity, i.e., a shear layer, at the ends of the log. Downstream of
                                             the log, a turbulent wake was generated, including a recirculation zone. For emergent logs placed at the channel
                                             center, a von-Kármán vortex street (VS) was formed, characterized by the periodic detachment of vortices from
                                             alternating ends of the log (Fig. 4a; note that only one vortex is illustrated as the dye was injected on one side).
                                             The vortex street results from an unstable interaction of the shear layers generated at either end of the log. In con-
                                             trast, no VS was formed by a log placed at the channel side, because it generated a single shear layer, for which the
                                             shear-layer instability leading to a VS does not occur. In addition, no VS was formed for submerged logs, due to
                                             the suppression of vortex shedding by the flow passing above the log and into the wake (sweeping flow, Fig. 4b).

          Scientific Reports |    (2021) 11:8644 |                  https://doi.org/10.1038/s41598-021-87892-7                                                                 4

Vol:.(1234567890)
www.nature.com/scientificreports/
Figure 4. (a) and (b) Photos of C2e with 50-cm long emergent log and C4s with 50-cm long submerged log
with tracer injected upstream of log to illustrate the presence (a) and absence (b) of a von-Kármán vortex street.
When present, the vortex street was unsteady, with vortices forming and shedding from either end of the log
in a regular alternating pattern. (a) illustrates the formation of a single vortex on the left-side of the log, and
subsequently a vortex forms on the right-hand side; (c) and (d) Power spectra of lateral flow velocity component
measured at log center at maximum kt.
This has also been observed for submerged vertical cylinders (with the relative submergence defined as flow
depth h to cylinder height hc) with 1.8 < h/hc ≤ 4, while a VS was formed for slightly submerged and emergent
cylinders with 0.7 < h/hc ≤ 1.145,46. For emergent obstacles (h/hc = 1) with low aspect ratio, i.e., cylinder height to
width near one, the shape does not affect the wake structure, whereas shape is important to submerged obstacles
(1 < h/hc < 5.5)47. Considering a log, the aspect ratio is defined as the log diameter to log length, resulting in very
low aspect ratios (d/L = 0.09, 0.12, and 0.15) that significantly differ from classic cylinder studies.
The presence/absence of the VS was also confirmed with the power spectra of the lateral velocity component
Svv (Fig. 4c,d). Spectra were evaluated at the location of maximum kt at the log center. For all emergent logs placed
at the channel center there was a peak in Svv at frequency f = 0.06 to 0.07 Hz (Fig. 4c; C1e–C3e), confirming the
presence of VS. The log Reynolds number was RL = U L/ν = 1.2 to 7.0 × 10⁴ for all tests. For the shortest emer-
gent log, C3e, with L = 0.25 m, f = 0.07 Hz, resulting in Strouhal number StL = (f L)/U = 0.18. This was similar to
the vortex shedding of a vegetation p atch43 or an unconfined solid c ylinder48. For the two longer logs (0.5 and
0.75 m), the observed Strouhal numbers (0.31 and 0.46, respectively) were higher than the unconfined value
(0.18). Based on previous studies, this was attributed to the high flow blockage in these cases, (L/B = 0.42 and
0.63). Previous studies have shown that when a shedding structure is confined by walls, velocity enhancement
adjacent to the structure increases in shedding frequency, i.e., increases the Strouhal n umber49,50.
In contrast to the emergent, centered logs, there was no peak in Svv for either the submerged logs at the chan-
nel center or the emergent logs at the channel side (Fig. 4d; C4s, C5s, S2e). The suppression of the VS was not
associated with bed friction. In shallow flow, a wake can be stabilized by bed friction, Cf, if the wake stability
parameter S = Cf L/h > 0.250. In our experiments, S = 0.0043 to 0.026, which was significantly smaller than the
critical values defined by Chen and J irka51. Therefore, the bed friction was not large enough to suppress the vortex
shedding process. Instead, the fact that a VS was not observed behind the submerged logs was attributed to the
presence of flow over the log that entered the wake (sweeping flow) and suppressed the interaction of the two
Scientific Reports | (2021) 11:8644 | https://doi.org/10.1038/s41598-021-87892-7 5
Vol.:(0123456789)www.nature.com/scientificreports/
shear-layers, thus suppressing the formation VS (see discussion in Zong and Nepf43). The log placed at the side
generated only one shear layer, which does not produce a VS.
It is useful to consider whether bed friction could influence wake structure in the field. Using a scale factor
of λ = 5, the flow depth h and log lengths L of the flume experiments were upscaled to field conditions (subscript
f) to hf = 0.50 m and Lf = 1.25, 2.5, and 3.75 m. Using the critical stability parameter Sc = 0.2, the critical bed fric-
tion required to suppress VS was determined to be Cf = 0.08, 0.04, 0.03 for Lf = 1.25, 2.5, 3.75 m, respectively. The
sediment size ds producing these bed friction coefficients was derived by applying the semi-empirical equation
in Julien52:
1
Cf =
2 ,
(4)
5.75log 2h
ds
which resulted in ds = 0.25, 0.14, 0.09 m for Lf = 1.25, 2.5, 3.75 m, respectively (Sc = 0.2), i.e., to suppress the VS
the grain size must be of the scale of large gravel or greater.
Turbulent structures within the wake may impede the swimming capabilities of fish, if the size of the eddy is in
the range of the fish length40,41,53. For emergent logs positioned at the centerline, which generated a VS, the most
meaningful turbulence length-scale is that of the VS coherent structures, described by peak . As expected for a
VS, peak scaled with log length, and specifically, �peak /L = 0.92 ± 0.09 (SD, see Table 1). The scale peak ≈ L was
also illustrated with tracer, which visualized the VS eddy (Fig. 4a). For submerged logs at the channel centerline,
which did not form a VS, the eddy size was significantly reduced compared to the emergent logs and scaled with
the water depth. Averaging across all measurements in submerged-center-log placements (C4, C5, C6, C7),
x = 0.06 ± 0.04 m (SD across all measurements). For the side placements, the eddy-scale behind an emergent
log, x = 0.18 ± 0.09 m was again larger than those behind a submerged log, x = 0.08 ± 0.06 m. The key points
were that for emergent logs, eddy size can depend on log length, and that the eddy size decreased significantly
when logs transitioned from emergent to submerged.
Longitudinal profiles of u and kt were measured at the midpoint of log length and at z = d/2 (Fig. 5). The
downstream trailing edge of the log was at x/L = 0. Compared to the approach flow (measured 1 m upstream
of the log), normalized velocity, u/U, decreased, whereas normalized kt/U2 increased in the log wake (Fig. 5).
Similar to previous studies, log placement increased the spatial variability in the fl ow27,28, but our results also
demonstrated that variation in log size and positioning can significantly alter the velocity and turbulence in the
wake, in some cases by an order of magnitude. As log length (L) increased, the minimum velocity in the wake
umin decreased, but kt increased (Fig. 5a,b). For L = 0.75 m, umin was located x/L = 2 downstream of the log and
for L = 0.25 m and 0.50 m (C3e and C2e) at x/L = 0.5. For submerged logs, umin was two-times larger than that
observed for emergent logs with the same L (C2e compared to C4s and C5s; Fig. 5c). For logs at the channel
center, the wake length Lw scaled with the log length and was longer for submerged logs with Lw,s = (9 to 15) L
compared to Lw,e = (4 to 10) L for emergent logs (Fig. 5a,c,e; Table 1). The slower recovery of velocity (longer Lw)
for submerged logs can be attributed to the weaker turbulence in the wake of a submerged versus an emergent
log (compare Fig. 5b,d). Turbulence was weaker in the wake of the submerged logs because the flow passing over
the log and into the wake suppressed the production of VS (Fig. 4d). Specifically, for log length L = 0.50 m, Lw was
1.6 (± 0.5) times longer for submerged compared to emergent logs. The longer wake for submerged logs (Fig. 5c)
can provide a longer downstream region that promotes the deposition of organic matter and n utrients15,19 in
contrast to the shorter, more energetic wake for emergent logs.
The degree of log submergence impacted both the position and magnitude of peak turbulence. For the
emergent cases (h/d < 1), the distance from the log to the point of maximum kt scaled with L, which was associ-
ated with the observed formation of the VS. Specifically, peak kt occurred at (2.2 ± 1.1) L (Table 1). Because of
the coherent VS, the turbulence in an emergent log wake was 10 × higher than that in a submerged log wake
(compare 5b and 5d). For submerged cases, the distance to the maximum kt scaled with d, associated with the
vertical recirculating eddy formed directly downstream form the log. Specifically, peak kt occurred at ≈ 3 d for all
submerged log lengths (Table 1). For the deeper submergence, h/d = 1.63, the flow over the log (sweeping flow)
entered the wake, disrupting the interaction between the two shear layers, thereby suppressing the VS, which
resulted in low turbulence downstream of the first peak (Fig. 5d). In contrast, for mild submergence, h/d = 1.17,
a hybrid case with two peaks in turbulence was observed. The first peak was directly behind the log and at the
same point as that observed for the higher submergence (≈ 3 d). The second, smaller peak was at 4 L, which was
consistent with the emergent cases, suggesting this peak was associated with a weak VS.
The effect of the log angle γ on wake structure can be represented by the projected log length, Le = sin(γ) L.
Specifically, the wake-length scaled with Le, i.e., Lw = (12.8 ± 3.4) Le (Table 1 and Fig. 5e,f). The angled logs were
all submerged with h/d = 1.17 (C6s and C7s), for which two turbulence peaks were observed, consistent with case
C4s (Fig. 5f). The magnitude of maximum kt decreased with decreasing angle (γ) and Le (C4s with L = Le = 0.50 m
versus C6s with Le = 0.35 m).
Additional experiments were performed with the log at the channel sidewall, including both emergent
(S1e–S3e) and submerged cases (S4s–S5s). The reattachment length Lr was defined as the distance at which the
sidewall boundary layer reattached to the channel wall. For the side log placement, mixing between the outer
flow and the wake was restricted to one side, and no VS was generated (Fig. 4d). As a result, logs placed at the
channel side produced a larger and more pronounced recirculation zone and total wake length, compared to the
center log placement. The greater length of recirculation can increase the residence time of organic matter and
nutrients in the wake, enhancing deposition processes. For emergent cases, Lr was (13 ± 1) L (Fig. 5g; Table 1),
which was similar to the range of reattachment lengths observed for emergent groynes, (11 to 17) L54. For the
submerged cases, Lr was smaller than the emergent cases, with Lr = (8 ± 3) L (Fig. 5g; Table 1).
Scientific Reports | (2021) 11:8644 | https://doi.org/10.1038/s41598-021-87892-7 6
Vol:.(1234567890)www.nature.com/scientificreports/
2 2
1 1.5
0 1
-1 0.5
-2 0
-5 0 5 10 15 20 -5 0 5 10 15 20
1.5 0.2
1 0.15
0.5 0.1
0 0.05
-0.5 0
-5 0 5 10 15 20 -5 0 5 10 15 20
1.5 0.2
1 0.15
0.5 0.1
0 0.05
-0.5 0
-5 0 5 10 15 20 -5 0 5 10 15 20
1.5 0.1
1 0.075
0.5 0.05
0 0.025
-0.5 0
-5 0 5 10 15 20 25 30 -5 0 5 10 15 20 25 30
Figure 5. Longitudinal profiles of normalized time-mean velocity and turbulent kinetic energy along log
centerline. (a), (b), and (c) logs positioned at the channel center and (a) emergent logs of different length, (b)
submerged logs of different diameter and relative submergence, h/d, (c) submerged logs with different log angle.
Le is the projected log length. (d) Emergent and submerged logs positioned at the sidewall. Vertical lines mark
the average wake length, Lw , for tests C1-7 and average length of reattachment zone, Lr , for tests S1-5.
For logs placed at the side, the position of kt was similar to that observed for logs placed at the channel center.
Specifically, for submerged cases LTKE scaled with the log diameter, LTKE = (2.5 ± 0.7) d, and for emergent cases
with the log length, LTKE = (12 ± 2) L (Table 1). However, side log placement produced significantly weaker tur-
bulence. Specifically, the peak kt for sidewall placement was 10% and 50% of that observed for center-channel
placement, for emergent and submerged conditions, respectively. Further, for the hybrid condition with two kt
peaks, the second peak was less pronounced for side log placement (S4s and S5s; Fig. 5h) compared to the center
log placement (C4s; Fig. 5d).
The flume experiments were conducted with a fixed bed, comparable to an incised bedrock channel, thereby
neglecting local suspended sediment and bedload transport processes associated with log placement in real riv-
ers. Given a mobile bed, these processes are governed by the ratio of the shear velocity u* to the sediment settling
velocity ws (suspended sediment) and the critical shear velocity u*c (bedload). The observations described above
for a fixed bed can be used to infer changes in log wakes when a mobile bed causes a log to become buried. For
example, erosion around the log could decrease the log frontal area exposed to the flow, which in turn would
affect the wake characteristics. For a submerged log, a decrease in exposed log diameter would increase the flow
over the log (sweeping flow), suppressing the generation of the VS, resulting in weaker turbulent mixing, and an
increase in wake length. Depending on the degree of erosion, an emergent log may become submerged, which
Scientific Reports | (2021) 11:8644 | https://doi.org/10.1038/s41598-021-87892-7 7
Vol.:(0123456789)www.nature.com/scientificreports/
4 3 2
2 2
1
0 1
-2 0 0
-0.5 -0.25 0 0.25 0.5 -0.5 -0.25 0 0.25 0.5 -0.5 -0.25 0 0.25 0.5
4 3 0.1
2 2
0.05
0 1
-2 0 0
0 0.25 0.5 0.75 1 0 0.25 0.5 0.75 1 0 0.25 0.5 0.75 1
Figure 6. Lateral profiles of time-mean velocity normalized by the channel average velocity (a,d), ratio of vrms
to urms (b,e) and turbulent kinetic energy normalized by the square of channel average velocity (c, f) for logs
placed at center (a–c) and at the side (d–f). Approach flow conditions (AF) included for reference; log center at
y/B = 0 (placed at channel center) and channel wall at y’/B = 0 (placed at channel side). B is the channel width.
Note that the range on the vertical axis in (c) is 20 times greater than in (f). The vertical lines indicate the log
ends. For (a,b) and (d–e) (u and vrms/urms), the lateral profile was taken at the x-location at which flow velocity
was minimum. For (c) and (f) (kt), the x-location corresponded to the peak kt.
would result in an increased wake length due to the sweeping flow. If the log remains emergent, the wake will
not change, because the wakes of emergent logs are governed by the log length or projected length.
Changes in bed morphology can be anticipated based on the wake dynamics. For example, the increased
shear at the log ends and the enhanced kt downstream of an emergent center log (Fig. 5a,b) may produce scour
to the sides and downstream of the log. In comparison, submerged logs would only create scour directly behind
the log, associated with the plunging overflow, similar to step-pool channels31,55,56. In addition, the recirculation
and velocity deficit zones associated with the submerged and side log placement would be regions of reduced u*,
which would enable sediment deposition. According to field observations, backwater and scour effects tend to
decrease with increasing submergence level and increase with increasing d ischarge56–58. The deposition of fine
sediment in the backwater as well as the scour of sediment from the downstream plunge pool also decrease with
submergence level and increase with d ischarge57. Recent flume and field studies on emergent side logs showed
that while single logs increased erosion rates, logs placed in series did not increase erosion rates, as the wake
interference between the logs reduced the near-bank velocity59–61.
The spatial footprint of the wake and the influence of a VS were further illustrated by the lateral profiles of
u , relative turbulence strength vrms/urms, and kt (Fig. 6). All measurements were made at z = d/2. For logs at the
channel center, the lateral coordinate was zero at the channel and log centerline (y/B = 0). But for the logs placed
at the channel wall, the lateral coordinate was zero at the wall (y’/B = 0). First, consider the velocity variation
around the log. As the fraction of channel cross-section blocked by the log increased, the velocity enhancement
around the side of the log also increased. For case C1e (emergent, center log, L = 0.75 m, grey dots) a full lateral
profile was collected, which confirmed that the log center acted as a line of symmetry (Fig. 6a). To decrease the
measurement effort, the subsequent measurements were made for just one side of the log. The increased velocity
at the side of the log was greatest for the widest log, test C1e (L = 0.75 m), which reached u/U = 3.2 compared to
u/U = 2.1 for the shorter log C2e (L = 0.5 m) and u/U = 1.8 for the submerged log C4s (L = 0.5 m). In comparison,
the increase in velocity around a log of the same length but placed at the channel side was smaller, reaching only
u/U = 1.6 for S2e (L = 0.25 m) and u/U = 1.3 for S5s (L = 0.25 m, Fig. 6d).
Because the VS preferentially enhanced the lateral component of fluctuating velocity, the presence of the VS
was correlated with an increase in lateral turbulence intensity, reflected in the ratio vrms/urms (Fig. 6b,e), and this
ratio further illustrates the differences between the emergent center logs (with VS), and submerged and sidewall
logs (without VS). For logs positioned at the channel center, the lateral profiles of normalized kt (Fig. 6c) show
that the peak turbulence level occurred at the centerline of the log and wake (y/B = 0). The lateral profiles also
confirmed the results shown in Fig. 5 that kt increased with increasing log length L, and that kt was ten times
higher for emergent logs (grey and black symbols in Fig. 6c), compared to submerged logs (white symbols in
Scientific Reports | (2021) 11:8644 | https://doi.org/10.1038/s41598-021-87892-7 8
Vol:.(1234567890)www.nature.com/scientificreports/
Fig. 6c). For logs positioned at the sidewall (Fig. 6f), the turbulence within the wake was significantly diminished
and more uniform compared to the logs positioned at the channel center (Fig. 6c). In addition, at the edge of the
sidewall wake (y’/B = 0.2, Fig. 6c), the turbulence dropped off more rapidly to approach flow (AF) conditions
(crosses in Fig. 6f), for the submerged sidewall log (S5s) than for the emergent sidewall log (S2e), which mir-
rored the sharper spatial transition in time-mean velocity (Fig. 6d). Both the time-mean and turbulent profiles
with sidewall logs (Fig. 6d,f) showed that the submerged log produced a narrower wake than the emergent log.
Implications for river restoration using wood. The three log placements differently impacted the
velocity field (Fig. 7). Emergent logs placed at the channel center produced the highest turbulent kinetic energy,
kt, and the strongest recirculation (negative velocity) downstream of the log (Fig. 7a). In contrast, submerged
center logs and sidewall logs produced wakes with ten times smaller kt (Fig. 7b,c), but these wakes were signifi-
cantly longer in the streamwise extent (Fig. 7b,c). First, consider the impact of the wake on deposition. Similar to
the wake behind other vegetation patches, a log wake may act as a region of enhanced deposition of fine particles,
such as organic matter and nutrients, that in turn could promote vegetation growth18,62. Considering the wakes
behind patches of vegetation, Shi et al.62 described the preferential accumulation of fine particles in the wake
as a function of the channel shear velocity u* and the critical shear velocity u*c, which is a function of sediment
size. Specifically, deposition was enhanced in the wake, relative to the adjacent channel, only for u*/u*c = 0.7 to
3. In this range, resuspension in the main channel provided material to the wake, and the velocity reduction
in the wake was sufficient to promote the retention of this material. We anticipate that a similar range of flow
conditions would also promote deposition in the wake of a log. Given three different particles with diameters
dm1 = 24 μm, dm2 = 0.63 mm (sand), and dm3 = 6.3 mm (gravel), we can estimate the critical shear velocity u*c from
the critical Shields parameter θc = 0.047 to (e.g., Julien52)
θc g(ρs − ρ)dm
u∗c = , (5)
ρ
with ρs = 2650 kg/m3, resulting in u*c1 = 4.3 mm/s, u*c2 = 21.9 mm/s, and u*c3 = 69.2 mm/s. The shear velocity of the
present experiments can be upscaled to field conditions with λ = 5 to u*f = 8.8 mm/s. We then obtained u*/u*c = 2.1
for dm1, u*/u*c = 0.4 for dm2, and u*/u*c = 0.1 for dm3. Preferential accumulation of fine particles in the log wake
would, therefore, occur for dm1. For dm2 and dm3, the channel shear velocity is too low compared to the critical
velocity, corresponding to uniform high net deposition in the entire channel.
Second, consider the potential for the log to create fish habitat. This depends on both the size of the eddies
formed in the wake and the associated turbulence magnitude. Previous studies suggest that the swimming
capabilities of fish are reduced if the eddy size is larger than 75% of the fish length40,41,53. As an illustration, let’s
compare eddy size to a fish length of 0.2 m63 for juvenile (salmonids or cyprinids) and 0.7 m63 for adult fish.
Focusing on the 0.5 m experimental log, the measured eddy scales (Table 1) were upscaled to the field with a scale
factor of λ = 5, i.e., field log length Lf = 2.5 m. For an emergent center log, the VS eddies scale with the log length,
2.5 m, which would exceed 75% of both the juvenile and adult fish lengths, suggesting poor habitat. However,
if the center log was submerged, x = 0.3 ± 0.2 m, which would be smaller than 75% of the adult fish length, but
larger than 75% of the juvenile fish length, i.e., providing good habitat for adult fish only. For a log placed at the
side, x = 1.1 m for an emergent log and x = 0.2 ± 0.2 m for a submerged log. The emergent log would be unsuit-
able for both adult and juvenile, and the submerged log would be suitable only for adult fish. However, previous
studies41,53,63 have noted that, in addition to eddy size, turbulence magnitude is also important for fish habitat,
and this might expand the suitability of the side-log and submerged-log conditions. For example, emergent center
logs, which produce a VS, increased the turbulence within the wake by a factor of 167 above the background
turbulence in the open channel (Fig. 5). In contrast, submerged-center logs and both submerged and emergent
side logs, none of which produce a VS, only elevated turbulence by a factor of 15 above the background. This
difference in turbulence level will affect the fish habitat. Emergent logs may establish a downstream flow region
that is preferred by larger or adult fish due to the larger eddies, stronger turbulence, and higher drift densities due
to increased velocity next to the log, while submerged or side logs may create flow regions preferred by smaller
or juvenile fish with smaller eddies and weaker t urbulence38–40,63. This illustrates how by varying log sizes and
degree of submergence, habitat suitability for different fish preferences can be created.
Summary
The wake and flow structures associated with different log placement were experimentally investigated. For emer-
gent logs placed at the channel center, a von-Kármán vortex street (VS) was formed, characterized by the unsteady
detachment of vortices from alternating ends of the log, which subsequently migrated downstream. In contrast,
no VS was formed for submerged logs, due to the suppression of vortex formation by the flow passing over the
top of the log and into the wake. The formation of a VS elevated the turbulence within the wake by a factor of 10,
compared to the turbulence observed without VS formation. Due to their significantly lower turbulent mixing,
the wakes behind submerged center logs required a much greater distance to exchange momentum with the
outer flow and recover velocity within the wake. As a result, the wakes generated by submerged center logs were
two to three times longer than the wake generated by emergent center logs. We further observed a hybrid case
for h/d = 1.17 with two peaks in kt, with the first peak associated with the increased flow above the log (sweeping
flow), and the second, smaller peak present due to the lateral shear. Logs positioned at the channel sidewall had
the lowest turbulence levels and greatest streamwise extent, which can increase the residence time and deposi-
tion of fine particles such as organic matter and nutrients. Finally, the eddy scale and turbulence magnitude in
the wakes depend on the log size, placement and submergence, which can be selected to target specific species
Scientific Reports | (2021) 11:8644 | https://doi.org/10.1038/s41598-021-87892-7 9
Vol.:(0123456789)www.nature.com/scientificreports/
Figure 7. Illustration of resulting flow structures for different log placements; (a) emergent log at centerline, (b)
submerged log at centerline, and (c) emergent log at side. VS = von-Kármán vortex street.
Scientific Reports | (2021) 11:8644 | https://doi.org/10.1038/s41598-021-87892-7 10
Vol:.(1234567890)www.nature.com/scientificreports/
and fish ages. Given the heterogeneity of piece size, location, orientation, and submergence of naturally occur-
ring large wood in r ivers63, we suggest that river restoration would benefit from equally diverse characteristics
in deliberately placed large wood in order to maximize habitat diversity in rivers.
Data availability
Data sets for this research are available at https://doi.org/10.5281/zenodo.4665770.
Received: 11 February 2021; Accepted: 6 April 2021
References
1. Wohl, E. et al. The natural sediment regime in rivers: broadening the foundation for ecosystem management. Bioscience 65, 358–371
(2015).
2. Surian, N. & Rinaldi, M. Morphological response to river engineering and management in alluvial channels in Italy. Geomorphol-
ogy 50, 307–326 (2003).
3. Madej, M. A., Sutherland, D. G., Lisle, T. E. & Pryor, B. Channel responses to varying sediment input: a flume experiment modeled
after Redwood Creek, California. Geomorphology 103, 507–519 (2009).
4. Wohl, E. et al. The natural wood regime in rivers. Bioscience 69, 259–273 (2019).
5. Bernhardt, E. S. et al. Synthesizing U.S. river restoration efforts. Science 308, 636 (2005).
6. Wohl, E., Lane, S. N. & Wilcox, A. C. The science and practice of river restoration: the science and practice of river restoration.
Water Resour. Res. 51, 5974–5997 (2015).
7. Roni, P., Beechie, T., Pess, G. & Hanson, K. Wood placement in river restoration: fact, fiction, and future direction. Can. J. Fish.
Aquat. Sci. 72, 466–478 (2015).
8. Bureau of Reclamation & U.S. Army Engineer Research and Development Center (USBR & ERDC). National Large Wood Manual:
Assessment, Planning, Design, and Maintenance of Large Wood in Fluvial Ecosystems: Restoring Process, Function, and Structure.
(2016).
9. Gurnell, A. M., PiéGay, H., Swanson, F. J. & Gregory, S. V. Large wood and fluvial processes: large wood and fluvial processes.
Freshw. Biol. 47, 601–619 (2002).
10. Piégay, H. et al. Public perception as a barrier to introducing wood in rivers for restoration purposes. Environ. Manage. 36, 665–674
(2005).
11. Keller, E. A. & Swanson, F. J. Effects of large organic material on channel form and fluvial processes. Earth Surf. Process. 4, 361–380
(1979).
12. Gippel, C. J. Environmental hydraulics of large woody debris in streams and rivers. J. Environ. Eng. 121, 388–395 (1995).
13. Dixon, S. J. A dimensionless statistical analysis of logjam form and process: a Dimensionless Statistical Analysis of Logjam Form
and Process. Ecohydrology 9, 1117–1129 (2016).
14. Crowder, D. W. & Diplas, P. Evaluating spatially explicit metrics of stream energy gradients using hydrodynamic model simula-
tions. Can. J. Fish. Aquat. Sci. 57, 1497–1507 (2000).
15. Bilby, R. E. Role of organic debris dams in regulating the export of dissolved and particulate matter from a forested watershed.
Ecology 62, 1234–1243 (1981).
16. Faustini, J. M. & Jones, J. A. Influence of large woody debris on channel morphology and dynamics in steep, boulder-rich mountain
streams, western Cascades, Oregon. Geomorphology 51, 187–205 (2003).
17. McClain, M. E. et al. Biogeochemical hot spots and hot moments at the interface of terrestrial and aquatic ecosystems. Ecosystems
6, 301–312 (2003).
18. Skalak, K. & Pizzuto, J. The distribution and residence time of suspended sediment stored within the channel margins of a gravel-
bed bedrock river. Earth Surf. Process. Landf. n/a-n/a https://doi.org/10.1002/esp.1926 (2010).
19. Beckman, N. D. & Wohl, E. Carbon storage in mountainous headwater streams: the role of old-growth forest and logjams. Water
Resour. Res. 50, 2376–2393 (2014).
20. Sawyer, A. H., Bayani Cardenas, M. & Buttles, J. Hyporheic exchange due to channel-spanning logs. Water Resour. Res. 47, (2011).
21. Doughty, M., Sawyer, A. H., Wohl, E. & Singha, K. Mapping increases in hyporheic exchange from channel-spanning logjams. J.
Hydrol. 587, 124931 (2020).
22. Warren, M. L., Haag, W. R. & Adams, S. B. Forest linkages to diversity and abundance in lowland stream fish communities. 168–182.
23. Wohl, E. et al. Management of large wood in streams: an overview and proposed framework for hazard evaluation. JAWRA52,
315–335 (2016).
24. Brooks, A. P. Design Guideline for the Reintroduction of Wood into Australian Streams. 85 http://reefcatchments.com.au/files/2013/
02/Design-Guideline-for-the-reintroduction-of-wood-into-Australian-streams1.pdf.
25. Shields, F. D., Morin, N. & Cooper, C. M. Large woody debris structures for sand-bed channels. J. Hydraul. Eng. 130, 208–217
(2004).
26. Abbe, T. & Brooks, A. Geomorphic, engineering, and ecological considerations when using wood in river restoration. In Geophysical
Monograph Series (eds Simon, A. et al.) 419–451 (American Geophysical Union, 2013). https://doi.org/10.1029/2010GM001004.
27. Gallisdorfer, M. S. et al. Physical-scale model designs for engineered log jams in rivers. J. Hydro-Environ. Res. 8, 115–128 (2014).
28. Bennett, S. J. et al. Flow, turbulence, and drag associated with engineered log jams in a fixed-bed experimental channel. Geomor-
phology 248, 172–184 (2015).
29. L’Hommedieu, W., Tullos, D. & Jones, J. Effects of an engineered log jam on spatial variability of the flow field across submergence
depths. River Res. Appl. 36, 383–397 (2020).
30. Ismail, H., Xu, Y. & Liu, X. Flow and scour around idealized porous engineered log jam structures. J. Hydraul. Eng. 147, 04020089
(2021).
31. Curran, J. H. & Wohl, E. E. Large woody debris and flow resistance in step-pool channels, Cascade Range, Washington. Geomor-
phology 51, 141–157 (2003).
32. Follett, E., Schalko, I. & Nepf, H. Momentum and Energy Predict the Backwater Rise Generated by a Large Wood Jam. Geophys.
Res. Lett. 47, (2020).
33. Wohl, E. Bridging the gaps: an overview of wood across time and space in diverse rivers. Geomorphology 279, 3–26 (2017).
34. Smith, D. L., Goodwin, R. A. & Nestler, J. M. Relating turbulence and fish habitat: a new approach for management and research.
Rev. Fish. Sci. Aquac. 22, 123–130 (2014).
35. Fausch, K. D. Experimental analysis of microhabitat selection by juvenile steelhead (Oncorhynchus mykiss) and coho salmon (O.
kisutch) in a british columbia stream. Can. J. Fish. Aquat. Sci. 50, 1198–1207 (1993).
36. Gerstner, C. L. & Webb, P. W. The station-holding performance of the plaice Pleuronectes platessa on artificial substratum ripples.
Can. J. Zool. 76, 260–268 (1998).
Scientific Reports | (2021) 11:8644 | https://doi.org/10.1038/s41598-021-87892-7 11
Vol.:(0123456789)www.nature.com/scientificreports/
37. Liao, J. C., Beal, D. N., Lauder, G. V. & Triantafyllou, M. S. Fish exploiting vortices decrease muscle activity. Science 302, 1566–1569
(2003).
38. Liao, J. C., Beal, D. N., Lauder, G. V. & Triantafyllou, M. S. The Karman gait: novel body kinematics of rainbow trout swimming
in a vortex street. J. Exp. Biol. 206, 1059–1073 (2003).
39. Tullos, D. & Walter, C. Fish use of turbulence around wood in winter: physical experiments on hydraulic variability and habitat
selection by juvenile coho salmon, Oncorhynchus kisutch. Environ. Biol. Fishes 98, 1339–1353 (2015).
40. Lupandin, A. I. Effect of flow turbulence on swimming speed of fish. Biol. Bull. 32, 461–466 (2005).
41. Tritico, H. M. & Cotel, A. J. The effects of turbulent eddies on the stability and critical swimming speed of creek chub (Semotilus
atromaculatus). J. Exp. Biol. 213, 2284–2293 (2010).
42. Uijttewaal, W. S. Effects of groyne layout on the flow in groyne fields: laboratory experiments. J. Hydraul. Eng. 131, 782–791 (2005).
43. Zong, L. & Nepf, H. Vortex development behind a finite porous obstruction in a channel. J. Fluid Mech. 691, 368–391 (2012).
44. Goring, D. G. & Nikora, V. I. Despiking acoustic doppler velocimeter data. J. Hydraul. Eng. 128, 117–126 (2002).
45. Sadeque, M. A., Rajaratnam, N. & Loewen, M. R. Flow around cylinders in open channels. J. Eng. Mech. 134, 60–71 (2008).
46. Sadeque, M. A., Rajaratnam, N. & Loewen, M. R. Effects of bed roughness on flow around bed-mounted cylinders in open chan-
nels. J. Eng. Mech. 135, 100–110 (2009).
47. Hajimirzaie, S. M., Wojcik, C. J. & Buchholz, J. H. J. The role of shape and relative submergence on the structure of wakes of low-
aspect-ratio wall-mounted bodies. Exp. Fluids 53, 1943–1962 (2012).
48. Roshko, A. Experiments on the flow past a circular cylinder at very high Reynolds number. J. Fluid Mech. 10, 345–356 (1961).
49. Rees, W. G. & Wilby, W. A. Vortex Shedding Frequencies for a Cylinder in Confined Flow. (1981).
50. Sahin, M. & Owens, R. G. A numerical investigation of wall effects up to high blockage ratios on two-dimensional flow past a
confined circular cylinder. Phys. Fluids 16, 1305–1320 (2004).
51. Chen, D. & Jirka, G. H. Experimental study of plane turbulent wakes in a shallow water layer. Fluid Dyn. Res. 16, 11–41 (1995).
52. Julien, P. Y. Erosion and Sedimentation (Cambridge University Press, 2010).
53. Muhawenimana, V., Wilson, C. A. M. E., Ouro, P. & Cable, J. Spanwise Cylinder wake hydrodynamics and fish behavior. Water
Resour. Res. 55, 8569–8582 (2019).
54. Chen, F.-Y. & Ikeda, S. Horizontal separation flows in shallow open channels with spur dikes. J. Hydrosci. Hydraul. Eng. 15, 15–30
(1997).
55. Comiti, F., Cadol, D. & Wohl, E. Flow regimes, bed morphology, and flow resistance in self-formed step-pool channels: flow resist-
ance in step-pool channels. Water Resour. Res. 45, (2009).
56. Wilcox, A. C., Wohl, E. E., Comiti, F. & Mao, L. Hydraulics, morphology, and energy dissipation in an alpine step-pool channel:
step-pool hydraulics. Water Resour. Res. 47, (2011).
57. Thompson, D. M. The influence of lee sediment behind large bed elements on bedload transport rates in supply-limited channels.
Geomorphology 99, 420–432 (2008).
58. Manners, R. B., Doyle, M. W. & Small, M. J. Structure and hydraulics of natural woody debris jams. Water Resour. Res. 43, (2007).
59. Zhang, N., Rutherfurd, I. & Ghisalberti, M. Effect of instream logs on bank erosion potential: a flume study with a single log. J.
Ecohydraulics 5, 43–56 (2020).
60. Zhang, N., Rutherfurd, I. D. & Ghisalberti, M. The effect of instream logs on bank erosion potential: a flume study with multiple
logs. J. Ecohydraulics 5, 57–70 (2020).
61. Zhang, N. & Rutherfurd, I. D. The effect of instream logs on river-bank erosion: Field measurements of hydraulics and erosion
rates. Earth Surf. Process. Landf. 45, 1677–1690 (2020).
62. Shi, Y., Jiang, B. & Nepf, H. M. Influence of particle size and density, and channel velocity on the deposition patterns around a
circular patch of model emergent vegetation: vegetation patch on deposition patterns. Water Resour. Res. 52, 1044–1055 (2016).
63. Golpira, A., Baki, A. B. & Zhu, D. Z. Higher-order velocity moments, turbulence scales and energy dissipation rate around a boulder
in a rock-ramp fish passage. Sustainability 12, 5385 (2020).
Acknowledgements
Rovi Porter is acknowledged for her laboratory assistance. The first author is funded by the Swiss National Sci-
ence Foundation (SNSF) [Early Postdoc Mobility Fellowship; Project: P2EZP2_184263].
Author contributions
I.S. and H.N. planned the flume experiments and setup. I.S. performed the flume experiments and data analysis.
I.S., E.W., and H.N. discussed and wrote the paper.
Competing interests
The authors declare no competing interests.
Additional information
Supplementary Information The online version contains supplementary material available at https://doi.org/
10.1038/s41598-021-87892-7.
Correspondence and requests for materials should be addressed to I.S.
Reprints and permissions information is available at www.nature.com/reprints.
Publisher’s note Springer Nature remains neutral with regard to jurisdictional claims in published maps and
institutional affiliations.
Open Access This article is licensed under a Creative Commons Attribution 4.0 International
License, which permits use, sharing, adaptation, distribution and reproduction in any medium or
format, as long as you give appropriate credit to the original author(s) and the source, provide a link to the
Creative Commons licence, and indicate if changes were made. The images or other third party material in this
article are included in the article’s Creative Commons licence, unless indicated otherwise in a credit line to the
material. If material is not included in the article’s Creative Commons licence and your intended use is not
permitted by statutory regulation or exceeds the permitted use, you will need to obtain permission directly from
the copyright holder. To view a copy of this licence, visit http://creativecommons.org/licenses/by/4.0/.
© The Author(s) 2021
Scientific Reports | (2021) 11:8644 | https://doi.org/10.1038/s41598-021-87892-7 12
Vol:.(1234567890)You can also read