EFFECTS OF AQUARIUM AND POND NOISE ON HEARING SENSITIVITY IN AN OTOPHYSINE FISH
←
→
Page content transcription
If your browser does not render page correctly, please read the page content below
Bioacoustics
The International Journal of Animal Sound and its Recording, 2011, Vol. 20, pp. 117–136
© 2011 AB Academic Publishers

EFFECTS OF AQUARIUM AND POND NOISE ON
HEARING SENSITIVITY IN AN OTOPHYSINE FISH

MONIKA GUtSCHER, LIDIA EVA WYSOCKI AND FRIEDRICH LADICH*
Department of Behavioural Biology, University of Vienna, Althanstrasse 14, A-1090
Vienna, Austria

ABSTRACT

Several studies on fishes have shown that behaviour and auditory sensitivity are
often affected by underwater noise. The current investigation concentrates on noise
encountered by fish kept for leisure in aquaria and ponds. Noise spectra showed
that all aquarium filters measured created a high amount of low-frequency noise,
while the water outflow above the surface created additional high-frequency noise
components. Audiograms of the Goldfish Carassius auratus, a species possessing
hearing specializations, were determined between 0.1 and 4kHz using the non-invasive
auditory evoked potential (AEP) recording technique. The amount of masking was
determined in the presence of four different noise-types (broadband LLeq, 1min): aquaria
with external filter with outflow above the water surface (119dB re 1 mPa), external
filter with outflow below the water surface (115dB), internal filter with outflow below
the water surface (114dB), and an unfiltered pond (95dB). The goldfish’s hearing was
masked by all filter noise types and most affected at 0.1 and 0.3kHz by the external
filter noise (threshold shifts of 15-19dB). Pond noise had no effect on the hearing
threshold. The results indicate that fish with hearing specializations are considerably
masked under common holding conditions found in aquaria but probably not in ponds.
Thus, using a quieter filter setup with a quiet outflow might help to improve holding
conditions in aquaria without compromising aeration of the water.

Keywords: Sound pressure level; aquarium noise; hearing; fish; auditory evoked
potentials, masking

INTRODUCTION

Sound is an important carrier of information for communication and
orientation in aquatic environments because it propagates five times
faster than in air and is not attenuated as quickly as other signals.
There are numerous noise sources in the underwater environment,
and some information is available about the effects of noise on hearing
thresholds of fish species having different auditory capacities (Amoser
& Ladich 2005; Ladich 2008; Codarin et al. 2009; Popper & Hastings
2009; Slabbekoorn et al. 2010).
*Corresponding author. Email: friedrich.ladich@univie.ac.at

118

       Fish live in an environment where the acoustic background
varies greatly due to the influence of currents, waves, the prevailing
weather conditions and other factors. This ambient noise is the
ubiquitous acoustic background consisting of abiotic (wind, waves,
rain, surf) and biotic (animal vocalizations, feeding sounds) sources
(Hawkins & Chapman 1975; Hawkins & Myrberg 1983; Wysocki et
al. 2007a; Amoser & Ladich, 2010). Many fish species are able to
produce sounds via numerous sound generating mechanisms and
communicate acoustically (Ladich & Fine 2006). Their acoustic signals
have a certain stability in their amplitude, temporal and frequency
characteristics. In order to extract relevant information from the
auditory scene and to facilitate orientation and intraspecific acoustic
communication, the fish ear should be specialized for hearing signals
in different background noises (Ladich 2008; Fay 2009). Knowledge
about the ability of fish to discriminate signals from noise improves
our understanding of the adaptive mechanisms of this sensory organ.
It also provides crucial insights into the mechanisms that process
acoustic information (Sorokin 1989; Popper & Fay 1993).
       Several studies on fishes showed that behaviour and auditory
sensitivity can be affected by underwater noise (Myrberg 1990). Fish
are exposed to a wide range of waterborne, anthropogenic noise under
both natural and cultured conditions. In natural aquatic environments,
such noise is generated by machinery, propulsion systems of ships and
by-flow (Vasconcelos et al. 2007, Codarin et al. 2009). Other sources of
sounds include air guns, aircraft, sonic booms, sonar systems, shock
tests, boat repairs, underwater explosions and car traffic (Popper
2003, Popper & Hasting 2009).
       An even greater amount of noise is generated in an aquaculture
environment because aquaculture systems continue to intensify.
Intensification requires the use of aerators, air and water pumps,
tractors, harvesters, water circulation, as well as feeding and
maintenance machinery. Consequently, fish in aquaculture facilities
are chronically exposed to noise levels that are well within their
hearing ranges (Wysocki et al. 2007b).
       Noise exposure can variously affect fishes, including temporary
hearing loss (Scholik & Yan 2001, 2002; Amoser & Ladich 2003;
Smith et al. 2003; Popper et al. 2005), impaired sound detection and
temporal resolution ability (Wysocki & Ladich 2005a, b), damage to
the sensory epithelia of the inner ear (Hastings et al. 1996; McCauley
et al. 2003), and endocrinological and physiological stress responses
(Smith et al. 2003; Wysocki et al. 2006; Anderson 2009). Banner
and Hyatt (1973) analyzed the effects of such noise on the eggs and
larvae of two estuarine species, Cyprinodon variegatus and Fundulus
similis. These authors showed that a 20 dB increase of sound level in
the 40 to 1000 Hz frequency range reduced the viability of eggs and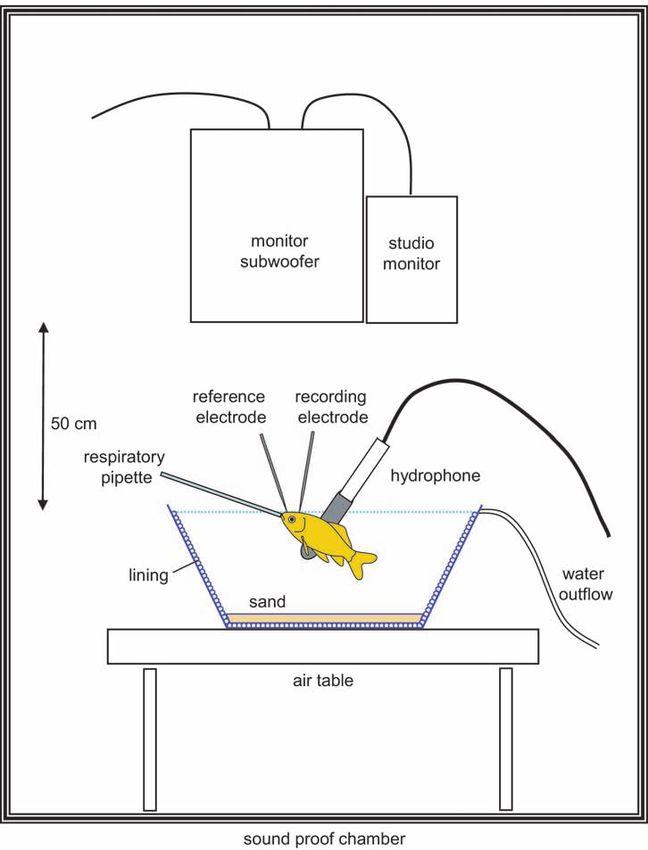
119

larvae in C. variegatus. Terhune et al. (1990) showed that noise levels
may influence Atlantic Salmon smolting rates in tanks. There was a
general tendency for smolting rates to be higher in fibreglass than in
the noisier concrete tanks.
       Artificial holding conditions are often noisier than natural
habitats. In holding tanks, high-frequency underwater noise is produced
mainly by oscillating and collapsing air bubbles, electric generators,
as well as electric air and filter pumps, whereas low-frequency noise
is mainly generated by water flows, ground vibrations, aquarium wall
vibrations and electrical pumps (Bart et al. 2001; Davidson et al. 2007;
Anderson 2009). Kratochvil & Schwammer (1997) showed that the well-
being of fish in public aquaria requires minimizing noise levels.
       The major goals of the present study were (1) to characterize
various aquarium noise types resulting from different filtering
techniques typically used in private ornamental fish keeping as
compared to the ambient noise in a pond with no water-maintaining
device and (2) to investigate the effects of these various noise conditions
on hearing sensitivity in a species possessing well-developed hearing
abilities due to accessory hearing structures (hearing specialist).
An otophysine species having Weberian ossicles which connect the
swimbladder to the inner ear was chosen because prior studies showed
that noise had major effects on hearing in otophysines and none or
only minor ones in species having no known hearing specializations
such as perciforms and salmoniforms (Amoser & Ladich 2005;
Wysocki & Ladich 2005a; Wysocki et al. 2007b). (3) A final goal of
the study was to determine better acoustical holding conditions for
fishes kept for leisure. The Goldfish Carassius auratus (Cyprinidae)
was chosen because its hearing abilities have been well characterized
in numerous studies.

MATERIALS AND METHODS

Animals

The test subjects were six Goldfish Carassius auratus (92-128 mm
standard length (SL), 20-60 g body weight (BW) from a pond near
Vienna. All animals were kept at 23 ± 1°C in planted aquaria whose
bottoms were covered with sand, equipped with half flower pots as
hiding places, filtered by external filters, and maintained at a 12L:12D
cycle. The fish were fed commercially prepared pond or flake food
(Tetrapond® or Tetramin®).
       All experiments were performed with the permission of the
Austrian Federal Ministry for Education, Science and Culture (GZ
66.006/0002-BrGT/2006).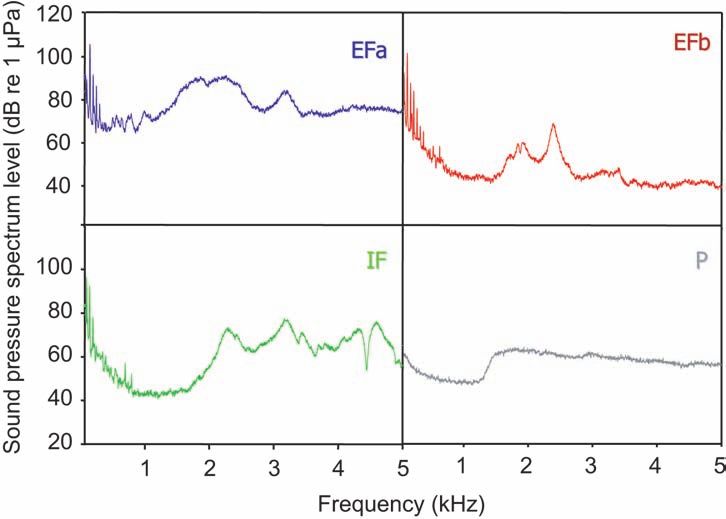
120

Noise recording and sound pressure level measurements

The different noise types were recorded using a DAT recorder (Sony
TCD-D100, Sony Corporation, Tokyo, Japan). Representative sound
pressure level (SPL) values of lab, pond, and aquarium noise types
were measured using a sound level meter (Brüel and Kjær 2238
Mediator) and a hydrophone (Brüel and Kjær 8101, Nærum, Denmark;
frequency range: 1 Hz-80 kHz ±2 dB; voltage sensitivity: -184 dB re
1 V/µPa), both connected to a power supply (Brüel and Kjær 2804).
For that purpose the L-weighted (5 Hz-20 kHz) equivalent continuous
SPL (LLeq) averaged over 1 min of measuring time was determined.
The LLeq is a measure of the averaged energy in a varying sound
field and is commonly used to assess environmental noise (ISO 1996,
2003). The whole system was calibrated using a Brüel and Kjær 4229
calibrator.
       Aquarium noise was recorded in an aquarium (water temperature:
23 ± 1°C) at the animal keeping facilities in the Department of
Behavioural Biology at the Biocenter in Vienna. The aquarium was
1 × 0.5 × 0.5 m in size with approximate 200 l of freshwater and
sand on the bottom (Fig. 1). It was placed on 2 cm of styrofoam, a
3 cm wooden board and a metal frame. The hydrophone was placed
in the middle of the aquaria. An external (Eheim Ecco 2232) and an
internal filter (Eheim Aquaball 2212) with variable water outflow were
tested. The end of the outflow pipe of the external filter was either
plugged or unplugged. The internal filter possessed an adjustable
water outflow rate and a diffuser which made it possible to regulate
the amount of air added to the water (aeration).
       The pond is located in Prellenkirchen, southeast of Vienna
(geographical position: 48.1°N, 17.0°E; altitude: 163 m above sea
level), measures 32 × 22 m with an approximate depth of 1.8 m,
and is populated by cyprinids. The ambient noise was a mixture of
biological activity, natural water movement due to wind, and small
surface waves characteristic for the summer season. The underwater
noise was recorded on 29 July 2005 at two different places. It was
a warm (water-temperature: 26.2°C) and slightly windy day. The
hydrophone was positioned approximately 0.5 m below the surface.
Before and after each noise recording, the SPL (LLeq) of the ambient
noise was measured and then averaged.
       Lab noise was recorded in the water tub where the auditory
evoked potential (AEP) recordings took place.

Noise spectra calculations

All noise recordings (sampling frequency of 44.1 kHz) were analysed
using the acoustic analysis software S_TOOLS-STx 3.7 (Acoustics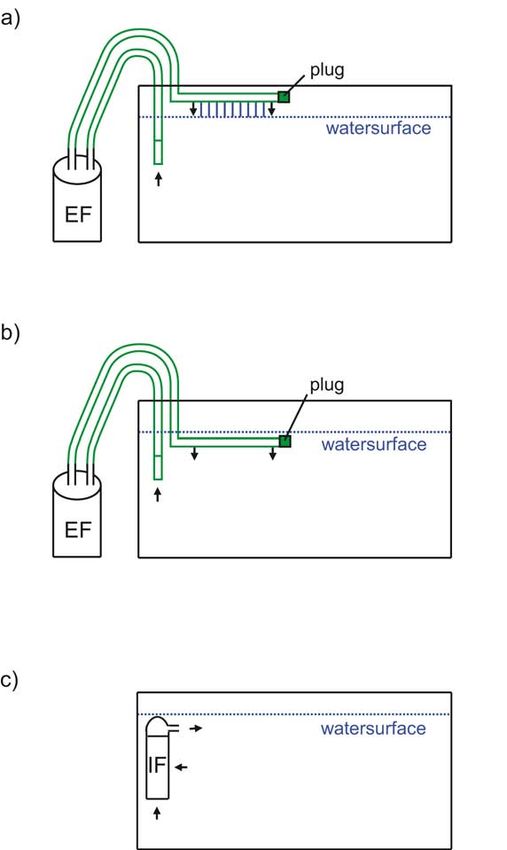
121

Research Institute, Austrian Academy of Sciences, Vienna, Austria).
Averaged sound spectra of pond, aquarium and lab noise were
calculated according to Amoser et al. (2004) and Wysocki & Ladich
(2005a).

Auditory evoked potential recordings

The AEP recording protocol followed was developed by Kenyon et
al. (1998) and modified by Wysocki & Ladich (2005a, b). During the
experiments, the fish were mildly immobilized with Flaxedil (gallamine
triethiodide; Sigma-Aldrich, Vienna, Austria). The dosage used was
0.88 ± 0.25 µg g-1. This dosage allowed the fishes to retain slight
opercular movements during the experiments but without significant
interference of myogenic noise. Test subjects were secured in a bowl-
shaped plastic tub (diameter: 33 cm, water depth: 13 cm, 1.5 cm layer
of sand) lined on the inside with acoustically absorbent material (air-
filled packing wrap) in order to reduce resonances and reverberations
(for the illustration of the effect, see Fig. 1 in Wysocki & Ladich
2002). Fishes were positioned below the water surface (except for the
contacting points of the electrodes, which were up to 1 mm above the
surface) in the centre of the plastic tub (Ladich & Wysocki 2009). A
respiration pipette was inserted into the fish’s mouth and respiration
was achieved through a simple temperature-controlled (23 ± 1°C),
gravity-fed water system. The AEPs were recorded by using silver
wire electrodes (0.38 mm diameter) pressed firmly against the skin.
The portion of the head above the water surface was covered by a
small piece of Kimwipes® tissue paper to keep it moist and to ensure
proper contact during experiments. The recording electrode was placed
in the midline of the skull over the region of the medulla and the
reference electrode cranially between the nares. Shielded electrode
leads were attached to the differential input of an a.c. pre-amplifier
(Grass P55C, Grass Instruments, West Warwick, RI, USA). A ground
electrode was placed in the water. The plastic tub was positioned
on an air table (TMC Micro-g® 63-540, Technical Manufacturing
Corporation, Peabody, MA, USA), which rested on a vibration-isolated
concrete plate. The entire setup was enclosed in a walk-in soundproof
room, which was constructed as a Faraday cage (interior dimensions:
3.2 m × 3.2 m × 2.4 m) (Figure 1).
       Both, sound stimulus presentation and AEP waveform
recordings were accomplished using a Tucker-Davis Technologies
(TDT, Gainesville, FL, USA) modular rack-mount system (TDT System
3) controlled by a Pentium PC containing a TDT digital processing
board and running TDT BioSig RP Software.
122 Figure 1. AEP recording and sound (noise) presentation setup showing both speakers (monitor subwoofer and studio monitor), the plastic tub lined on the inside with acoustically absorbent material, and the fish position. The arrow indicates the distance between the water surface (stippled line) and the speakers (modified from Ladich and Wysocki 2009).
123

Sound stimuli

Sound stimuli waveforms were created using TDT SigGen RP software
and fed to two speakers (Fostex Professonial Monitor Subwoofer
PM-0.5 Sub and Professional Studio Monitor PM-0.5 MKII, Fostex
Corporation, Tokyo, Japan) mounted 0.5 m above test subjects in the
air (Figure 1). Sound stimuli consisted of tone bursts presented at a
repetition rate of 21 per second. Hearing thresholds were determined
at frequencies of 0.1, 0.3, 0.5, 0.8, 1, 2, 3 and 4 kHz. Frequencies were
presented in a random order under normal laboratory conditions, as
well as in the presence of continuous masking noise. The duration
of sound stimuli increased from two cycles at 0.1 and 0.2 kHz, up
to eight cycles at 4 kHz. Rise and fall times were one cycle at 0.1
and 0.2 kHz, and two cycles at all other frequencies. All bursts were
gated using a Blackman window.
       For each test condition, stimuli were presented at opposite
polarities (180° phase shifted), and the corresponding AEPs averaged
by the BioSig RP software in order to eliminate stimulus artefacts.
The sound pressure level (SPL) of the tone bursts was reduced in 4
dB steps until the AEP waveform was no longer apparent. The lowest
SPL for which a repeatable AEP trace could be obtained, as determined
by overlaying replicate traces, was considered the threshold (Kenyon
et al. 1998). All hearing thresholds are given in dB re 1µPa because
otophysine fish are pressure sensitive due the connection of the gas-
filled swimbladder to the inner ear (Ladich & Popper 2004; Popper
& Fay in press).
       A hydrophone (Brüel and Kjær 8101, Nærum, Denmark;
frequency range: 1 Hz - 80 kHz ± 2dB; voltage sensitivity: -184 dB
re 1 V µPa-1) was placed close to the right side of the animals (2 cm
apart) in order to determine absolute SPL values underwater in the
immediate vicinity to the subjects.

Masking noise

For playback of aquarium and pond noise during AEP recordings,
30 s of three aquarium noise recordings with the hydrophone in the
middle of the aquarium were chosen: a) an external filter with vertical
outflow (end of pipe plugged) 3 cm above the water surface (EFa),
b) external filter with vertical outflow (end of pipe plugged) below the
water surface (EFb) and c) with an internal filter (IF) with horizontal
outflow below the water surface representing aquarium conditions
(Figure 2), and one recording of the pond noise (P) representing a
typical seminatural habitat of fish kept for leisure.
      These recordings were played back in a continuous loop during
the AEP-recordings. Noise, as well as tone bursts, were presented
124 Figure 2. Filter and water flow setups: a) External filter (EFa) with outflow above water surface, b) External filter (EFb) with outflow below surface, c) Internal filter (IF) with outflow below surface. Arrows indicate water flow in different filter setups.
125

through two speakers (Fostex PM-0.5 Sub and PM-0.5 MKII, Fostex
Corporation, Tokyo, Japan). These were positioned 0.5 m above the
water surface to achieve low-frequency noise spectral amplitudes
similar to those of the aquaria and pond recordings (Figure 1). Noise
stimuli waveforms were generated using TDT Sig-Gen RP software
sent to a 30-band equalizer (Alesis MEQ 230, Alesis Corp., Los
Angeles, CA, USA) and adjusted to ensure that the spectra in the
experimental tub were similar in frequency content and level to the
original noise recorded in the pond and aquaria. For this purpose, the
playback noises were recorded with a hydrophone (Brüel and Kjær
8101) suspended in the AEP recording tub at the position of the fish.
The average equivalent continuous SPLs (LLeq, 1min) measured using
the same equipment as for the noise recordings in the aquaria and
the pond. Absolute sound spectra of the playback noises were then
calculated as described in Wysocki and Ladich (2005a) and compared
to the original recordings.
       Using external or internal filters with different outflow positions
in relation to the water surface represents snapshots of the noise
situation in aquaria, since the acoustic characteristics of filter systems
tend to vary depending on the filter type used, its location relative
to the aquarium and the position of the water outflow relative to the
water surface. Nevertheless, the broad range of both, the level and
spectral composition of the selected noise types fits our purpose to
test the hearing abilities and the degree of masking in fishes kept for
leisure in aquaria and ponds based on representative examples.

Statistical analysis

All audiograms obtained in the presence of the different noise types
(lab-, pond- and three aquarium-noises) were compared by a two-
factor analysis of variance (ANOVA) using a general linear model
where one factor was masking noise and the other was frequency.
The noise factor alone should indicate overall differences between
masking conditions and, in combination with the factor frequency,
reveal whether different tendencies exist at different frequencies of the
audiograms. This was followed by Bonferroni’s multiple comparison
procedures to test under which noise conditions the audiograms
differed from each other.
       Parametric statistical tests were applied because the data
were normally distributed and showed homogeneity of variances. All
statistical tests were run using SPSS 15.0.
126
RESULTS
Diversity in noise levels and spectra
The continuous equivalent sound pressure levels (LLeq, 1 min) of aquaria
and the ponds, as well as the noise spectra, differed considerably
(Table 1, Figure 3).
The investigations of diverse filter types and outflow setups
in aquaria revealed different noise levels. The external filter with
the outflow of the plugged outlet pipe above the water surface was
approximately 3 dB louder than with the underwater outflow. The
SPL of the outflow of the outlet pipe with a plug at the end was
up to 5.5 dB higher than without such a plug (Table 1). The SPL
(LLeq) of the internal filter with the outflow below the water surface
increased when maximizing the aeration rate (119 dB). In the pond
outside Vienna, the SPL of the two different testing sites was almost
identical (95.4 dB and 94.9 dB) and about 20 dB lower than in the
aquarium.
Different locations of the external filter relative to the aquarium
were also investigated (Table 2). The SPL was lowest when the filter
had no contact to the frame of the aquarium (111-113 dB). There was
nearly no difference when the filter was located below the aquarium
TABLE 1
Mean continuous equivalent sound pressure levels
(LLeq, 1 min) of different aquarium noise types and the pond
at different places. The water flow and the amount of
aeration can be regulated in the internal filter. EFa, external
filter with outflow above surface; EFb, external filter with
outflow below water surface; IF, internal filter.
Noise types SPL (LLeq)
dB re 1 µPa
EFa (outflow vertical to surface; with plug) 118.9
EFa (outflow vertical to surface; without plug) 113.4
EFa (outflow 45° to surface; with plug) 116
EFa (outflow 45° to surface; without plug) 113.9
EFb (outflow below surface; with plug) 114.2
EFb (outflow below surface; without plug) 113.9
IF (max. water flow, max. aeration) 117.2
IF (max. water flow, min. aeration) 117.2
IF (min. water flow, max. aeration) 119
IF (min. water flow, min. aeration) 113.5
pond (first site) 95.4
pond (second site) 94.9127
Figure 3. Sound power spectra and cepstra of the different aquarium noise
types and of the pond. EFa, external filter with outflow above water surface;
EFb, external filter with outflow below surface; IF, internal filter; P, pond.
Note the linear frequency axis scaling in this figure and the logarithmic
scaling in figure 4.
TABLE 2
Mean continuous equivalent sound pressure levels (LLeq, 1 min) of different positions
of the external filter relatively to the aquarium. EFa, external filter with outflow
above surface; EFb, external filter with outflow below water surface
Filter position EFa EFb
dB re 1 µPa dB re 1 µPa
below aquarium on 2 or 5 cm of
styrofoam (same frame as aquaria) 113.3 112
on a chair (no contact with aquarium) 113.1 113.1
on the floor (no contact with aquarium) 111 110.7
on a wooden board (left of aquarium) 114 112
on soft tissue (left of aquarium) 113.5 112.4128
on 2 cm or 5 cm of styrofoam (113 dB) versus standing directly next
to the aquarium on a wooden board or on a soft tissue (114 dB).
Four noise types were chosen to investigate the masking effect
on fishes. These types are frequently encountered by fish kept for
leisure: noise types of aquaria with either an external filter with a
vertical outflow above the water surface (EFa) and an external filter
with outflow below the water surface (EFb), an internal filter (IF)
with the outflow below the water surface with minimized outflow and
aeration, and the noise of the pond (P) outside Vienna representing
a semi-natural habitat.
Among the four filter noise types chosen, EFa was the noisiest
(119 dB), whereas the filters with the underwater outflows (EFb, IF)
were quieter. Noise spectra showed that all filters created abundant
low-frequency noise, but the spectral levels differed considerably
at frequencies above 1.5 kHz (Figure 3). EFa showed the highest
spectral levels among all aquarium noise types (> 60 dB re 1 µPa)
and a major noise boost from 1 to 2.5 kHz. EFb revealed a moderate
decline towards higher frequencies, but also featured an energy
rise like EFa from 1.5 to 3 kHz with a peak about 2.4 kHz (68 dB
re 1 µPa). IF showed a similar decline as EFb until 1.5 kHz, but
then sound energy increased to 69 dB re 1 µPa. IF had, at higher
frequencies, unsteady sound energy (54-70 dB re 1 µPa). The pond
(P), representing a semi-natural habitat, showed lower spectral levels
than the aquarium noise types in the low frequency range (129
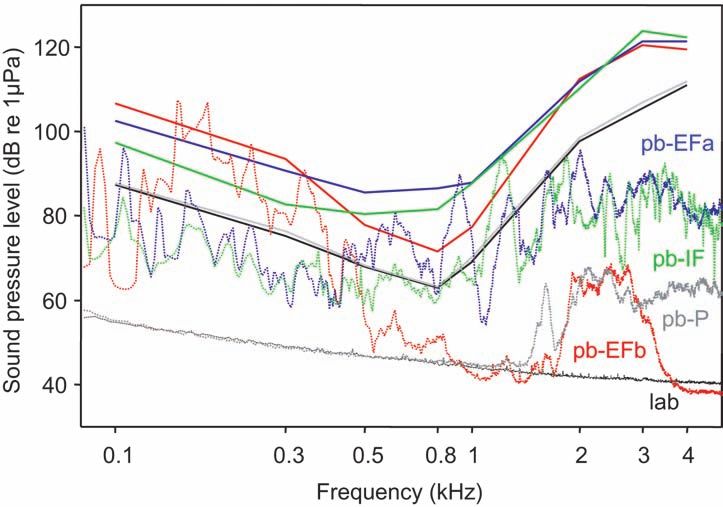
noise (Table 3, Figure 4). In the low frequency range (0.1 and 0.3
kHz), thresholds did not differ in the presence of both EF noise types.
At higher frequencies (0.8 and 1 kHz), thresholds with EFa were
higher than with EFb noise. Hearing thresholds were masked by up
to 20 dB (EFb at 0.1 kHz) and up to 24 dB (EFa at 0.5 kHz). In the
presence of IF, the mean sensitivity at 0.1 and 0.3 kHz declined by
maximally 10 dB, whereas it decreased above 1 kHz up to 13 dB. In
the best hearing range of goldfish (0.5, 0.8 and 1 kHz) the amount
of threshold shift compared to the worse hearing range decreased for
EFb and increased for EFa and IF (Figure 5).
DISCUSSION
Diversity in noise conditions
Ambient noise in different habitats is highly diverse in terms of both
noise levels and energy distribution (Wysocki et al. 2007a; Amoser
& Ladich 2010). The natural habitats of species possessing no
specializations often have relatively high ambient noise levels (Lugli &
Fine 2003). SPLs in creeks and streams are usually above 110 dB re
1 µPa (LLeq), whereas ambient noise levels in stagnant habitats with
high percentages of species possessing hearing specializations (such as
backwaters and lakes) are typically below 100 dB re 1 μPa (Wysocki
et al. 2007a; Amoser & Ladich 2010). This is consistent with current
results, where the noise level in the pond outside Vienna was 95 dB
re 1 µPa LLeq, 1 min, and with data of Anderson (2009).
Human-made holding conditions are often noisier than natural
habitats. A wide range of waterborne noise has been observed during
TABLE 3
Mean (± S.E.M.) hearing threshold values of Carassius auratus measured under
the different background noise conditions. S.E.M., standard error of means; EFa,
external filter with outflow above surface; EFb, external filter with outflow below
water surface; Freq, frequency; IF, internal filter; P, pond.
Freq Baseline EFa EFb IF P
kHz dB re 1 µPa dB re 1 µPa dB re 1 µPa dB re 1 µPa dB re 1 µPa
0.1 87.33 ± 1.43 102.50 ± 1.86 106.67 ± 2.08 97.33 ± 1.48 87.67 ± 1.59
0.3 75.17 ± 2.30 90.67 ± 2.23 93.50 ± 2.23 82.67 ± 1.17 76.33 ± 2.33
0.5 68.00 ± 1.98 85.50 ± 1.03 77.83 ± 2.47 80.33 ± 1.50 68.33 ± 2.38
0.8 63.00 ± 2.25 86.50 ± 2.08 71.50 ± 1.91 81.50 ± 1.54 63.33 ± 2.47
1 69.17 ± 2.06 87.83 ± 2.02 77.33 ± 1.48 87.67 ± 1.12 70.17 ± 1.85
2 97.67 ± 2.14 111.83 ± 3.11 112.50 ± 1.61 110.17 ± 1.38 98.50 ± 1.93
3 105.50 ± 2.67 121.33 ± 2.50 120.50 ± 2.38 123.83 ± 1.66 106.83 ± 2.64
4 111.00 ± 2.58 121.33 ± 2.17 119.50 ± 1.41 122.33 ± 1.65 111.83 ± 1.52130 Figure 4. Mean hearing thresholds of Carassius auratus under laboratory conditions (baseline) and in the presence of the different artificial noise types (solid lines) and the sound power spectra of the corresponding noise types played back during hearing thresholds determinations (broken lines). pb- EFa, playback of the noise from the external filter with outflow above water surface; pb-EFb, playback of the noise from the external filter with outflow below surface; pb-IF, playback of the noise from the internal filter; pb-P, playback of the noise from the pond. surveys of underwater ambient noise measurements in aquaculture systems. Bart et al. (2001) found that mean broadband SPLs differed across various intensive aquaculture systems. These levels varied from
131

Figure 5. Differences in hearing thresholds between the baseline audiogram
and the masked audiograms. Values are means ± S.E.M. (N=6). Bar types
indicate the differences for the respective noise type according to Fig. 3.
Broad bar in background = EFb (external filter with outflow below surface);
oblique striped bar = EFa (external filter with outflow above water surface);
horizontally striped bar = IF (internal filter); plain narrow bar in foreground
= P (pond).

       The noise levels encountered in different filter setups in the
present study varied between 113.4 to 119 dB and thus are generally
lower than in most public aquaria. The setup of the filtration system
influenced SPLs. The noise level created by the internal filter with
the outflow below the water surface increased when the aeration rate
was maximized (114-119 dB). The external filter with the terminally
plugged, above-water outflow (water exited the pipe only via lateral
holes) was louder than with the underwater outflow. The SPL of the
plugged outflow was higher than without a plug because numerous
small water jets are louder than a large single outflow. This means
that the SPL will always be higher if more air gets into the water.
       Furthermore, higher frequency and more complex spectral
components were observed in the aquaria with different filtering
conditions than in the pond. Spectral levels of the EFa setup were
higher above 0.5 kHz than those of EFb and IF setup because of more
oscillating and collapsing air bubbles.
132
There was a maximum difference in noise levels of more than
40 dB between the spectral levels of EFa and the others (maximum
difference between EFa and P (∆EFa-P): 46 dB at a frequency of 0.15
kHz; ∆EFa-IF: 43 dB at 1.7 kHz; ∆EFa-EFb: 41 dB at 1.6 kHz). The
maximum difference of the spectral noise levels in a concrete and
fibreglass tank was about 15 dB at 250 Hz (Terhune et al. 1990),
whereas differences of up to 40 dB at 800 Hz were found in public
aquaria (Anderson 2009).
Low-frequency noise is generated by water flows, ground
vibrations, aquarium wall vibrations and electrical pumps and filter
motors (Bart et al. 2001; Davidson et al. 2007). Lower-frequency sound,
below 0.1 kHz, with spectral levels of 74-110 dB in the aquaria and
60-83 dB in the pond were detected. Bart et al. (2001) measured SPLs
of 125-135 dB re 1 µPa below 400 Hz.
In summary, minimizing the aeration of an internal filter with
the outflow below the water surface decreased the SPL. In order to
lower noise levels in aquaria, the following measures could be taken:
(1) the water outflow pipe of the external filter should be close to
or below the water surface and not plugged. (2) If the outflow is
above the surface, it should not be vertically steered into the water
(Table 1). (3) External filters should have no contact to the table on
which the aquarium is standing. It proved advantageous to place the
external filter on the floor (Table 2). Thus, using a quiet filter setup
can help to reduce noise levels in the water.
Hearing under noise conditions
Hearing in our study animals was affected differently by the four
noise conditions. The goldfish did not show masking effects during the
presentation of pond noise. Noise levels in the pond were low (LLeq
< 100 dB) because it lacked an aerator or filtering system. Ponds
represent seminatural habitats in which goldfish and other cyprinids
such as koi carps are often kept for leisure all over the world. The
good hearing capabilities of otophysans are well adapted to quiet
habitats, and these fish can detect low-level sound produced by prey
or food items and by con- or heterospecifics (Amoser & Ladich 2005;
Wysocki & Ladich 2005a).
Contrary to the pond, aquarium noise had pronounced effects
on auditory sensitivity. Hearing in goldfish was heavily masked under
all aquarium noise conditions. Hearing thresholds at every measured
frequency were masked by at least 8 dB. In the low-frequency range
(0.1 and 0.3 kHz), thresholds were highly masked because of the
abundant low-frequency noise. In the best hearing range of goldfish
(0.5, 0.8 and 1 kHz), the amount of threshold shift decreased when
a quieter water outflow, e.g. below the surface, was used; spectral133
analyses also showed a reduced spectral noise level in this frequency
range.
The extent of threshold shift increased for EFa and IF noises
because of the higher spectral noise levels caused by the stronger
aeration, i.e. by oscillating and collapsing air bubbles. Above 1 kHz,
all hearing thresholds were masked by about 13 dB because of the
strong high-frequency underwater noise generated by splashing water
noise and by oscillating and collapsing air bubbles. As indicated by the
two-way ANOVA, the various types presented had different masking
effects at the various frequencies tested. This can be explained by
spectral differences among noises.
Hearing specialists are masked to a larger extent; they cannot
exploit their excellent hearing abilities in environments with high
SPLs (Popper & Fay 1993; Scholik & Yan 2001; Ladich & Popper
2004; Amoser & Ladich 2005, 2010; Wysocki et al. 2005a; Scholz &
Ladich 2006). The results of the current study indicate that hearing
specialists such as the goldfish are considerably masked under
artificial holding conditions either in private aquaria or in aquaculture
facilities. Wysocki et al. (2006) showed that cyprinids are susceptible
to noise-induced stress response.
Species lacking accessory hearing structures (air-filled cavities
connected to the inner ear) to enhance auditory abilities essentially
respond to low-frequency sounds (and only below 1 kHz) at relatively
high sound intensities (Hawkins & Myrberg 1983; Ladich & Popper
2004; Popper & Fay, in press). They exhibit their best hearing range at
lower frequencies than specialists, and have worse hearing thresholds
throughout the audiogram. According to prior findings (Amoser &
Ladich 2005; Wysocki & Ladich 2005a), non-specialists would be only
moderately or not at all masked in the presence of different aquarium
noise types found in the present study. Wysocki & Ladich (2005a)
showed that masking was low in the presence of white noise. The
European Perch Perca fluviatilis, a non-specialist, was barely masked
by quite different ambient noise types in any aquatic habitat due to
its low hearing sensitivity (Amoser & Ladich 2005). Similarly, tank
noise had no influence on the development of hearing thresholds in
Rainbow Trout Oncorhynchus mykiss reared in 115 dB versus 150 dB
tanks (Wysocki et al. 2007b). Despite the lower hearing sensitivities
of species lacking accessory hearing structures, Wysocki et al. (2006)
and Anderson (2009) observed physiological stress response in percids
and syngnathids under noisy conditions.
Anthropogenic noise not only masks hearing under artificial
holding conditions in aquaria and aquaculture facilities, it is also
increasing in natural habitats of fishes and affects different fish
species. Noise emanating from ships masks hearing in a number
of non-related fish groups in several coastal regions. Low-frequency
ship noise masks hearing and therefore the detection of conspecific134
sounds in representatives of Sciaenidae (Sciaena umbra) and
Pomacentridae (Chromis chromis) in the Adriatic Sea (Codarin et al.
2009) and of Batrachoididae (Halobatrachus didactylus) in the coastal
regions near Lisbon (Vasconcelos et al. 2007). These two studies are
the first indication that anthropogenic noise also impacts acoustic
communication in marine fish families inhabiting the European coast.
These and our results show that anthropogenic noise apparently
impairs fish hearing in all aquatic environments.
CONCLUSION
Fishes kept for leisure are exposed to different levels and spectra of
background noise. We observed higher and more complex noise spectra
in filtered aquaria than in the pond. Low-frequency underwater noise
was generated mostly by the motors of the filters, whereas high-
frequency noise was probably due to oscillating and collapsing air
bubbles (Bart et al., 2001).
Current data show that goldfish are heavily masked under
artificial holding conditions and cannot exploit their excellent hearing
abilities in environments with high noise levels. Aerators and other
sound sources in aquaculture systems can be configured in a way that
only minimally affects fish physiology (masking, stress) and growth.
Decreasing the SPLs requires minimizing the splashing of water,
positioning the outflow pipe close to or below the water surface, and
not plugging the end of the pipe. These arrangements considerably
lowers masking in the best hearing range of the goldfish (0.5-1 kHz).
The filter should not be in contact with the aquarium table. It is
advisable to place the filter below the aquarium on styrofoam or on
other soft material rather than positioning it directly next to the
aquarium.
ACKNOWLEDGEMENTS
We want to thank Heinz Tunner for providing goldfish and enabling
us to measure and record ambient noise in his pond, Sonja Amoser for
her help with sound recordings and Michael Stachowitsch for scientific
English proof reading. This study was supported by the Austrian
Science Fund (FWF grants No. P 17263 and 22319 to F.L.).
REFERENCES
Amoser, S. & Ladich, F. (2003). Diversity in noise-induced temporary hearing loss in
otophysines fishes. J. Acoust. Soc. Am. 113, 2170-2179.135 Amoser, S. & Ladich, F. (2005). Are hearing sensitivities of freshwater fish adapted to the ambient noise in their habitats? J. Exp. Biol. 208, 3533-3542. Amoser, S., Wysocki, L. E. & Ladich, F. (2004). Noise emission during the first powerboat race in an Alpine lake and potential impact on fish communities. J. Acoust. Soc. Am. 116, 3789-3797. Amoser, S. & Ladich, F. (2010). Year-round variability of ambient noise in temperate freshwater habitats and its implications for fishes. Aquat. Sci. 72, 371-378. Anderson, P. A. (2009). The functions of sound production in the lined seahorse Hippocampus erectus, and effects of loud ambient noise on its behaviour and physiology in captive environments. Ph. D. thesis, Univ. of Florida, FL. Banner, A. & Hyatt, M. (1973). Effects of noise on eggs and larvae of two estuarine fishes. Trans. Amer. Fish. Soc. 1, 134-136. Bart, A. N., Clark, J., Young, J. & Zohar, Y. (2001). Underwater ambient noise measurements in aquaculture systems: a survey. Aquac. Eng. 25, 99-110. Codarin, A., Wysocki, L. E., Ladich, F. & Picciulin, M. (2009). Effects of ambient and boat noise on hearing and communication in three fish species living in a marine protected area (Miramare, Italy). Mar. Poll. Bull. 58, 1880-1887. Davidson, J., Frankel, A. S., Ellison, W., Summerfelt, S. T., Popper, A. N., Mazik, P. & Bebak, J. (2007). Minimizing noise in fiberglass aquaculture tanks: noise reduction potential of various retrofits. Aqua. Eng. 37, 125-131. Fay, R. R. (2009). Sound scapes and the sense of hearing in fishes. Integr. Zool. 4, 26-32. Hastings, M. C., Popper, A. N., Finneran, J. J. & Lanford, P. J. (1996). Effects of low- frequency underwater sound on hair cells of the inner ear and lateral line of the teleost fish Astronotus ocellatus. J. Acoust. Soc. Am. 99, 1759-1766. Hawkins, A. D. & Chapman, C. J. (1975). Masked auditory thresholds in the cod. L. J. Comp. Physiol. A 103, 209-226. Hawkins, A. D. & Myrberg, A. A. (1983). Hearing and sound communication under water. In Bioacoustics: A Comparative Approach. (Ed. by B. Lewis), pp. 37-405. London: Academic Press. ISO (1996, 2003). Acoustics: Description, measurement and assessment of environmental noise. International Organization for Standardization. Kenyon, T. N., Ladich, F. & Yan, H.Y. (1998). A comparative study of hearing ability in fishes: the auditory brainstem response approach. J. Comp. Physiol. A 182, 307-318. Kratochvil, H. & Schwammer, H. (1997). Reducing acoustic disturbances by aquarium visitors. Zoo Biol. 16, 349-353. Ladich, F. (2008). Sound communication in fishes and the influence of ambient and anthropogenic noise. Bioacoustics 17, 35-37. Ladich, F. & Popper, A. N. (2004). Parallel evolution in fish hearing organs. In Evolution of the Vertebrate Auditory System (Ed. by G. Manley, A. N. Popper & R.R. Fay), pp. 95-112. New York: Springer-Verlag. Ladich, F. & Fine, M. L. (2006). Sound generating mechanisms in fishes: a unique diversity in vertebrates. In Communication in Fishes. Vol. 1. (Ed. by F. Ladich, S. P. Collin, P. Moller & B. G. Kapoor), pp. 3-43, Enfield, NH: Science Publishers. Ladich, F. & Wysocki, L. E. (2009). Does speaker presentation affect auditory evoked potential thresholds in goldfish? Comp. Biochem. Physiol. A, 154, 341-346. Lugli, M. & Fine, M. L. (2003). Acoustic communication in two freshwater gobies: ambient noise and short-range propagation in shallow streams. J. Acoust. Soc. Am. 114, 512-521. McCauley, R. D., Fewtrell, J. & Popper, A. N. (2003). High intensity anthropogenic sound damages fish ears. J. Acoust. Soc. Am. 113, 638-642. Myrberg, A. A. (1990). The effects of man-made noise on the behaviour of marine animals. Environ. Int. 16, 575-586.
136

Popper, A. N. & Fay, R. R. (1993). Sound detection and processing by fish: critical
   review and major research questions. Brain, Behav. Evol. 41, 14-38.
Popper, A. N. & Fay, R. R. (2011) Rethinking sound detection by fishes. Hear. Res.
   273, 25–36.
Popper, A. N. (2003). Effects of anthropogenic sounds on fishes. Fish. Res. 28, 24-31.
Popper, A. N. & Hastings M. C. (2009). The effects of human-generated sound on fish.
   Integr. Zool. 4, 43-52.
Popper, A. N., Smith, M. E., Cott, P. A., Hanna, B. W., MacGillivray, A. O.,
   Austin, M. E. & Mann, D. A. (2005). Effects of exposure to seismic airgun use on
   hearing of three fish species. J. Acoust. Soc. Am. 117, 3958-3971.
Scholik, A. R. & Yan, H. Y. (2001). Effects of underwater noise on auditory sensitivity
   of a cyprinid fish. Hear. Res. 152, 17-24.
Scholik, A. R. & Yan, H. Y. (2002). The effects of noise on the auditory sensitivity of
   the bluegill sunfish, Lepomis macrochirus. Comp. Biochem. Physiol. A 133, 43-52.
Scholz, K. & Ladich, F. (2006). Sound production, hearing and possible interception
   under ambient noise conditions in the topmouth minnow Pseudorasbora parva. J.
   Fish Biol. 69, 892-906.
Slabbekoorn, H., Bouton, N, van Opzeeland, I., Coers, A., ten Cate, C. &
   Popper, A. N. (2010). A noisy spring: the impact of globally rising underwater
   sound levels on fish. TREE 1243. Doi: 10.1016/j.tree.2010.04.005.
Smith, M. E., Kane, A. S. & Popper, A. N. (2003). Noise-induced stress response and
   hearing loss in goldfish. J. Exp. Biol. 207, 427-435.
Sorokin, M. A. (1989). Detection of acoustic signals in noise by fish (in Russian). Biol.
   Nauki 6, 35-40.
Terhune, J. M., Friars, G. W., Bailey, J. K. & O’Flynn, F. M. (1990). Noise levels may
   influence Atlantic salmon smolting rates in tanks. J. Fish Biol. 37, 185-187.
Vasconcelos, R. O., Amorim, M. C. P. & Ladich, F. (2007). Effects of ship noise on
   the detectability of communication signals in the Lusitanian toadfish. J. Exp. Biol.
   210, 2104-2112.
Wysocki, L. E. & Ladich, F. (2002). Can fishes resolve temporal characteristics of
   sounds? New insights using auditory brainstem responses. Hear. Res. 169, 36-46.
Wysocki, L. E. & Ladich, F. (2005a). Hearing in fishes under noise conditions. J.
   Assoc. Res. Otolaryngol. (JARO) 6, 28-36.
Wysocki, L. E. & Ladich, F. (2005b). Effects of noise exposure on click detection and
   temporal resolution ability of the goldfish auditory system. Hear. Res. 201, 27-36.
Wysocki, L. E., Dittami, J. P. & Ladich, F. (2006). Ship noise and cortisol secretion in
   European freshwater fishes. Biol. Conserv. 128, 501-508.
Wysocki, L. E., Amoser S. & Ladich, F. (2007a). Diversity in ambient noise in
   European freshwater habitats: Noise levels, spectral profiles, and impact on fishes.
   J. Acoust. Soc. Am. 121, 2559-2566.
Wysocki, L. E., Davidson, J. W., Smith, M. E., Frankel, A. S., Ellison, W. T.,
   Mazik, P. M., Popper, A. N. & Bebak, J. (2007b). Effects of aquaculture production
   noise on hearing, growth, and disease resistance of rainbow trout Oncorhynchus
   mykiss. Aquaculture 272, 687-697.

Received 23 March 2010, revised 30 June 2010 and accepted 9 July 2010
You can also read