Possibly Invasive New Bioenergy Crop Silphium perfoliatum: Growth and Reproduction Are Promoted in Moist Soil
←
→
Page content transcription
If your browser does not render page correctly, please read the page content below
agriculture

Article
Possibly Invasive New Bioenergy Crop Silphium perfoliatum:
Growth and Reproduction Are Promoted in Moist Soil
L. Marie Ende * , Katja Knöllinger, Moritz Keil, Angelika J. Fiedler and Marianne Lauerer

                                           Ecological Botanical Gardens, Bayreuth Center for Ecology and Environmental Research (BayCEER), University
                                           of Bayreuth, 95447 Bayreuth, Germany; katja.knoellinger@uni-bayreuth.de (K.K.);
                                           moritz.keil@uni-bayreuth.de (M.K.); angelika.j.fiedler@uni-bayreuth.de (A.J.F.);
                                           marianne.lauerer@uni-bayreuth.de (M.L.)
                                           * Correspondence: marie.ende@uni-bayreuth.de

                                           Abstract: The cup plant (Silphium perfoliatum) is a new and promising bioenergy crop in Central
                                           Europe. Native to North America, its cultivation in Europe has increased in recent years. Cup plant
                                           is said to be highly productive, reproductive, and strongly competitive, which could encourage inva-
                                           siveness. Spontaneous spread has already been documented. Knowledge about habitat requirements
                                           is low but necessary, in order to predict sites where it could spontaneously colonize. The present
                                           experimental study investigates the growth and reproductive potential of cup plant depending on soil
                                           moisture, given as water table distance (WTD). In moist soil conditions, the growth and reproductive
                                           potential of cup plant were the highest, with about 3 m plant height, 1.5 kg dry biomass, and about
                                           350 capitula per plant in the second growing season. These parameters decreased significantly in
                                           wetter, and especially in drier conditions. The number of shoots per plant and number of fruits per
                                           capitulum were independent of WTD. In conclusion, valuable moist ecosystems could be at risk for
                                           becoming invaded by cup plant. Hence, fields for cultivating cup plant should be carefully chosen,
                                 and distances to such ecosystems should be held. Spontaneous colonization by cup plant must be

                                           strictly monitored in order to be able to combat this species where necessary.
Citation: Ende, L.M.; Knöllinger, K.;
Keil, M.; Fiedler, A.J.; Lauerer, M.       Keywords: bioenergy crop; cup plant; groundwater; growth; invasive potential; reproductive
Possibly Invasive New Bioenergy            potential; Silphium perfoliatum; soil moisture; water table distance
Crop Silphium perfoliatum: Growth
and Reproduction Are Promoted in
Moist Soil. Agriculture 2021, 11, 24.
https://doi.org/10.3390/
                                           1. Introduction
agriculture11010024
                                                 In Europe, biogas is being increasingly produced as a renewable energy source to
Received: 18 November 2020                 replace fossil fuels [1]. Currently maize (Zea mays L.) is the most dominant biogas crop,
Accepted: 28 December 2020                 though its cultivation goes along with great ecological damage from the high application of
Published: 1 January 2021                  machines, fertilizer, and pesticides. Therefore, alternative bioenergy crops are being sought
                                           that are more ecologically agreeable [2–5].
Publisher’s Note: MDPI stays neu-                One promising alternative crop in this context is the cup plant (Silphium perfoliatum L.) [2].
tral with regard to jurisdictional clai-   This perennial, yellow-flowering C3-plant belongs to the Asteraceae family. It develops
ms in published maps and institutio-       stems and flowers from the second year onwards and persists many years [6]. Native in
nal affiliations.                          the prairies of eastern North America, cup plant was introduced to Europe in the 18th
                                           century as an ornamental plant [6]. Since 2004 it has been used as a bioenergy crop in
                                           Germany [2], and as of 2019 about 4500 ha have been cultivated there [7]. Many other
Copyright: © 2021 by the authors. Li-
                                           European countries are cultivating this crop for bioenergy as well [3].
censee MDPI, Basel, Switzerland.
                                                 Cup plant has many ecological advantages over maize [2]: It can be harvested prof-
This article is an open access article
                                           itably for more than 15 years [8], and the application of machines and pesticides is much
distributed under the terms and con-       lower compared to maize, an annual plant [2]. In soil, higher portions of microbial biomass,
ditions of the Creative Commons At-        higher microbial diversity, and higher biological activity comparative to maize have been
tribution (CC BY) license (https://        proven [4]. Benefits for many pollinator species have also been detected: Insects are
creativecommons.org/licenses/by/           strongly attracted to the flowers of cup plant, which have a long flowering period relatively
4.0/).                                     late in the year when most other floral resources have already finished blooming [9–11].

Agriculture 2021, 11, 24. https://doi.org/10.3390/agriculture11010024                                    https://www.mdpi.com/journal/agriculture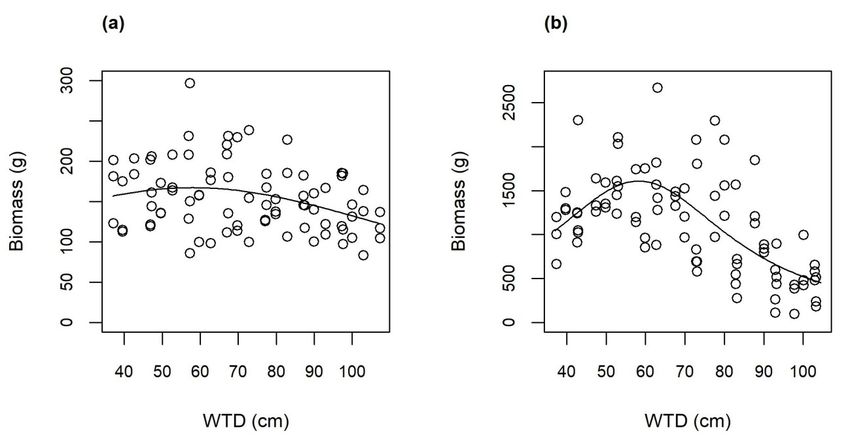
Agriculture 2021, 11, 24                                                                                           2 of 13

                                Furthermore, cup plant is easy to cultivate, highly productive with a high biogas
                           yield, and it is competitive and very reproductive [2,6]. These traits make it an attractive
                           bioenergy crop. However, in combination with the fact that harvest in agriculture usually
                           takes place after flowering, they carry the risk of spontaneous spreading and settlement out
                           from the fields. Spontaneous colonization was already documented in Upper Franconia
                           (Germany) [12] and other parts of Germany as well as in other European countries (e.g.,
                           Austria, Switzerland, Poland) [13–16]. In the Netherlands and Russia, cup plant has already
                           been graded as “potentially invasive” [17,18]. Studies on the invasive potential of this
                           species are essential and should be of interest for all involved stakeholders before cup plant
                           is cultivated on a large scale.
                                For this purpose, comprehensive knowledge about site requirements is necessary
                           to allow predictions about where cup plant might establish itself. However, little is
                           known about its site preferences in Europe, especially regarding soil moisture. It is as-
                           sumed that cup plant prefers soils with good moisture provision but is also fairly drought
                           tolerant [3,5,19,20]. So far, there are mainly empirical data or assumptions and only few
                           experimental studies about the yield of cup plant in Central Europe depending on soil
                           moisture. In its native range in North America, cup plant colonizes moist bottomlands
                           and floodplains near streambeds [6]. Assuming that cup plant grows and reproduces in
                           Central Europe in the same way that it does in its native range, it carries a special risk of
                           invasion on moist sites. It is known that these are often ecosystems of high value for nature
                           conservation in Central Europe. To assess the risk of these ecosystems becoming colonized
                           by cup plant, we executed a growth experiment with cup plant over two years in tanks
                           similar to those of Ellenberg’s Hohenheimer groundwater table experiment [21–23] at the
                           Ecological Botanical Gardens of the University of Bayreuth, Germany. The question was:
                           How do growth and reproductive potential of cup plant differ depending on groundwater
                           level? This study will not only provide insights into the demands and autecology of cup
                           plant for the first time; the approach is also innovative because the findings are of great
                           interest for nature conservation as well for agriculture.

                           2. Materials and Methods
                           2.1. Experimental Setup
                                 The experiment was carried out from May 2018 to September 2019 in tanks similar to
                           those of Ellenberg’s Hohenheimer groundwater table experiment [21–23] at the Ecological
                           Botanical Gardens of the University of Bayreuth (Germany, Bavaria). Temperature in the
                           first growing season (May to August 2018) ranged from 1 ◦ C to 35 ◦ C (mean 18 ◦ C) and
                           precipitation sum was 151 mm, and in the second growing season (May to August 2019)
                           between −3 ◦ C and 37 ◦ C (mean 17 ◦ C) and 195 mm, respectively. Seeds of cup plant
                           (Metzler & Brodmann Saaten GmbH, Ostrach, Germany, harvested 2016, pretreated) were
                           sown on 5 March 2018. Seedlings were pricked out three weeks later and cultivated in a
                           greenhouse. On 7 May 2018 the experiment started by planting the saplings into four tanks.
                           For pricking and planting we chose vital plants of equal and mean size.
                                 Each of the four tanks was a south-exposed, 6.4◦ inclined concrete tank (8 m × 4 m),
                           with a constant soil depth of 90 cm (Figure 1). Substrate was a homogeneous mixture of
                           40% native soil, 40% compost and 20% quartz sand. In the lower part of each tank water
                           was supplied via a garden hose and a perforated plastic pipe. Excess water could drain
                           through a hole in the tank wall (Figures 1 and 2). The water table was held constant by
                           hand in the first season and automatically by a float switch in the second growing season.
                           Therefore, the plants in the tanks had different water table distances (WTD). In each tank,
                           plants were arranged in nine rows indicating different WTD and in each row, there were
                           nine plants. Distance between rows was 90 cm and between plants in a row 30 cm. For
                           data collection we excluded all margin plants, resulting in seven rows of 28 plants each,
                           divided across the four tanks. After the first growing season, we harvested in each row and
                           in each tank the aboveground biomass of the second, the fourth and the sixth plant (seen
                           from west), resulting in n = 12 per treatment (= row) (Figure 2). Afterwards, we removed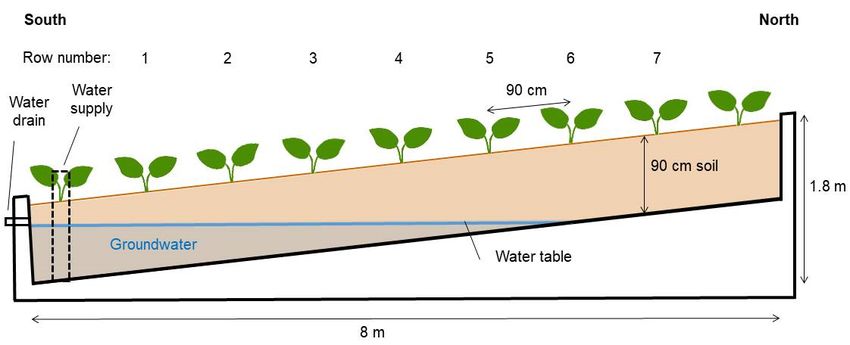
data collection we excluded all margin plants, resulting in seven rows of 28 plants ea
divided across the four tanks. After the first growing season, we harvested in each r
data collection we excluded all margin plants, resulting in seven rows of 28 plants each
and in each
divided tankthe
across thefour
aboveground
tanks. Afterbiomass
the first of the second,
growing season, thewefourth and the
harvested sixthrow
in each pl
(seen
and infrom
eachwest), resulting
tank the in n = biomass
aboveground 12 per treatment (= row)
of the second, (Figureand
the fourth 2). the
Afterwards,
sixth plant
Agriculture 2021, 11, 24 3 of 13
removed
(seen from west), resulting in n = 12 per treatment (= row) (Figure 2). Afterwards,Con
the central part of the rootstock of these three and of the eighth plant. we
quently, in the second growing season five plants per row were left
removed the central part of the rootstock of these three and of the eighth plant. Conse- with distances of
cm between
quently, the second
in the plants. growing
Excluding the margin
season plants,
five plants per we
rowhadweren =left
12 with
per treatment
distances of (= ro
60
the central part of the rootstock of these three and of the eighth plant. Consequently, in the
again.
cm between the plants.
second growing seasonExcluding the row
five plants per margin
wereplants,
left withwe had n of
distances = 12 perbetween
60 cm treatmentthe (= row)
again.
plants. Excluding the margin plants, we had n = 12 per treatment (=row) again.
Figure 1. Scheme of of
1. Scheme a groundwater tank in longitudinal section.
Figure
Figure 1. Scheme of a agroundwater
groundwater tank
tankininlongitudinal section.
longitudinal section.
Figure 2. Top 2.
view
Top of a groundwater tank indicating the plantarrangement,
arrangement,thethe harvesting scheme, and the measuring
Figure
Figure 2. Top view ofview of a groundwater
a groundwater tanktank indicatingthe
indicating the plant
plant arrangement, harvesting scheme,
the harvesting and the
scheme, measuring
and the measuring
points for soilfor
water content and and
water table.
points for points
soil watersoil water
contentcontent
and waterwater table.
table.
2.2. Data
2.2. Data Collection
Collection
2.2. Data In Collection
In thethe first
first year,we
year, we harvested
harvested the
theliving aboveground
living biomass
aboveground on 9 August
biomass 2018, 2018
on 9 August
◦ C until weight was constant, and measured the biomass with
dried
In ittheit in an oven at 70
dried in first
an ovenyear,at we
70 °Charvested the living
until weight aboveground
was constant, biomass the
and measured on biomass
9 Augustwith
scales (PM 4600 Delta Range, Mettler-Toledo GmbH, Greifensee, Switzerland, same scales
20
dried
scalesit (PM
in an4600ovenDelta
at 70Range,
°C untilMettler-Toledo
weight was constant, and measured
GmbH, Greifensee, the biomass
Switzerland, w
same
scales
scales (PM
for all4600
furtherDelta Range,
weight Mettler-Toledo
measurement unless GmbH,
otherwiseGreifensee,
noted). TwoSwitzerland, sa
samples of two
scales for all further weight measurement unless otherwise noted). Two samples of t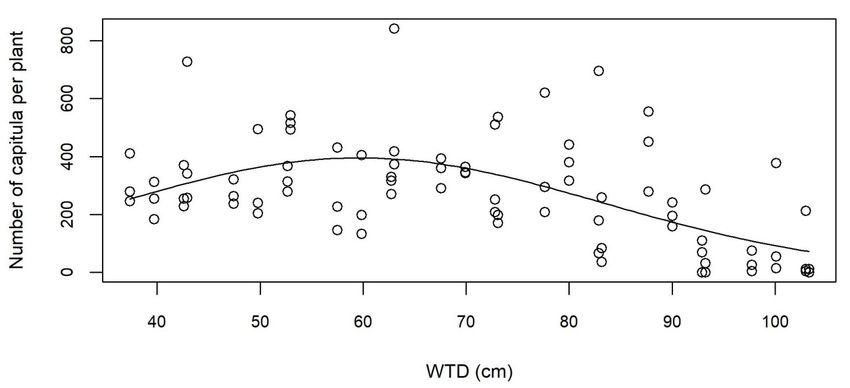
Agriculture 2021, 11, 24                                                                                          4 of 13

                           for all further weight measurement unless otherwise noted). Two samples of two different
                           treatments had to be discarded because of plant material loss; consequently, the sample
                           number for biomass of the first growing season was 82 instead of 84. In November 2018,
                           the number of shoots higher than 15 cm of the individuals left in the tanks was counted.
                                 In the second year, sampling and harvesting were carried out between 10 and 13
                           September 2019. We measured plant height by calculating the mean of the five highest
                           shoots. The number of shoots higher than 50 cm was counted for each plant and was
                           assigned to one of the three stages (1) dead, when more than 50% of biomass was brown,
                           (2) vegetative, without capitula or with buds less than 1 cm in diameter, and (3) generative,
                           with buds of at least 1 cm diameter or flowering or fruiting capitula, respectively. We har-
                           vested a representative subsample of the shoots, noting the shoot stages of the subsample,
                           which included at a minimum one-third of the shoots from the original sample. Rosette
                           leaves and shoots lower than 50 cm were harvested completely. The subsamples of the
                           shoots higher than 50 cm were split in compartments of dead and living biomass whose
                           fresh weights were measured. If necessary, again a subsample was taken and its fresh
                           weight was measured before the biomass was dried in an oven at 90 ◦ C until constant
                           weight. Dry weight of biomass was measured and extrapolated to total biomass per plant.
                           Before drying, capitula of the subsets were counted, assigned to the three phenological
                           stages (1) budding, from a diameter of 1 cm on, (2) flowering, when ray florets were
                           visible, and (3) fruiting, when ray florets were fallen off (comprising beginning of fruit
                           development until fallen-off fruits) and extrapolated to the whole plant.
                                 Additionally, we harvested three ripe capitula of the remaining shoots of each plant
                           and dried them separately in paper bags at room temperature. We counted their num-
                           ber of fruits and weighed them with scales (AE 240, Mettler-Toledo GmbH, Greifensee,
                           Switzerland).
                                 Since 12 July 2018, water table was automatically recorded in a perforated pipe
                           in the lower part of each of the four tanks (Figure 2) every 10 minutes by a pressure
                           sensor (BayEOS HX711 Board, BayCEER, Bayreuth, Germany). For data analyses, we
                           averaged water table for the time from the beginning of the water table measurement to
                           particular data sampling for each tank. WTD was calculated using the mean water table,
                           the inclination of the tanks (6.4◦ ), and the distances to water table sensor for each row of
                           each tank. Because soil depth was only 90 cm, plants with a calculated WTD larger than
                           90 cm had no vertical water access.
                                 Soil water content was measured weekly in the second growing season (May to
                           September 2019) with a TDR probe (TRIME® -FM3, IMKO Micromodultechnik GmbH,
                           Ettlingen, Germany) in plastic pipes on three positions (Figure 2) and two depths (5–25 cm
                           and 40–60 cm) in each tank. In November 2019, we took soil samples in 30 cm soil depth
                           on two positions of each tank to assess the relationship between soil water content and
                           soil water tension. We took an undisturbed soil sample with a core cutter of 100 cm3 and
                           a disturbed soil sample of about 200 cm3 . The undisturbed soil samples were saturated
                           with water over five days and afterwards dried in an oven at 105 ◦ C until constant weight.
                           The disturbed soil samples were filled each in two sampling rings of 20 cm3 , placed in a
                           pressure pot for 26 days at −15,000 hPa (pF = 4.2), and dried until constant weight. Before
                           and between these steps, all soil samples were weighed each time (PB 3002 DeltaRange,
                           Mettler-Toledo GmbH, Greifensee, Switzerland). After these steps, soil samples were
                           weighed again (PG 503-S DeltaRange, Mettler-Toledo GmbH, Greifensee, Switzerland).
                                 Meteorological data were obtained by a weather station in the Ecological Botanical
                           Gardens 310 m away from the experimental site operated by the Micrometeorology group,
                           Prof. Dr. Thomas, BayCEER, University of Bayreuth.
                                 The data on which calculations in this study are based are available in the supplemen-
                           tary materials (Tables S1–S7).
Agriculture 2021, 11, 24                                                                                                 5 of 13

                           2.3. Statistics
                                Data analysis and plot presentation were executed with R version 3.6.1 [24]. Cal-
                           culating means of data by treatment, we used the function “ddply” from the R package
                           “plyr” version 1.8.4 [25]. To read climate data and groundwater level data we used the R
                           package “bayeos” version 1.4.6 [26]. We used linear models (LM) and checked the diag-
                           nostic plots. In case of non-normal distribution or heteroscedasticity of residuals we tried
                           generalized linear models (GLM). If both LM and GLM were not possible, we executed
                           Spearman’s rank correlation analysis or the Kruskal–Wallis rank sum test (Kruskal test)
                           with the post-hoc test multiple comparison test after Kruskal–Wallis (KruskalMC) of the R
                           package “pgirmess” version 1.6.9 [27]. The four tanks were considered as four blocks in a
                           block design. We checked the influence of block (tank) with an LM respectively a GLM. In
                           case of non-significance we eliminated the block for the final model. In case of a significant
                           effect of block we exerted a mixed effect model with block as random factor using the R
                           package “lme4” version 1.1–21 [28]. Fits of mixed effect models were built using the mean
                           of intercepts. Level of significance was always 0.05.

                           3. Results
                           3.1. Soil Water Conditions
                                The treatments of the experiment created by the rows in the tanks with increasing
                           water table distance (WTD) described a wide range of soil water conditions (Table 1).
                           Because soil depth was only 90 cm the two driest rows (6 and 7, Figure 1) had no direct
                           vertical access to water table. Logically, soil water content decreased with increasing WTD,
                           as well near soil surface as in deep soil layer. Water content of waterlogged soil was
                           50 ± 2% vol (mean ± standard deviation). Permanent wilting point (pF-value = 4.2) was
                           reached at 9 ± 2%vol water content.

                           Table 1. Soil water conditions depending on the treatments. Row number in tank is counted from
                           the bottom up (Figure 2). Water table distance (WTD) is given as mean ± standard deviation for both
                           years separately. Soil depth was 90 cm. Soil water content was measured weekly only in the second
                           growing season (year 2019) at three positions in the tanks (see Figure 2). Given values for each row
                           were calculated by the models described in Figure 3.

                                                First Year
                                                                           Second Year (2019)
                                                  (2018)
                             Row Number                                       Soil Water Content (%vol)       Classification
                               in Tank                                               in Depths
                                                WTD (cm)      WTD (cm)
                                                                               5–25 cm          40–60 cm
                                    1             41 ± 7        40 ± 11           38               57               wet
                                    2             51 ± 7        50 ± 11           31               48           very moist
                                    3             61 ± 7        60 ± 11           26               40         slightly moist
                                    4             71 ± 7        70 ± 11           22               33              fresh
                                    5             81 ± 7        80 ± 11           18               28          slightly dry
                                    6             91 ± 7        90 ± 11           15               23          medium dry
                                    7            101 ± 7       101 ± 11           12               19           rather dry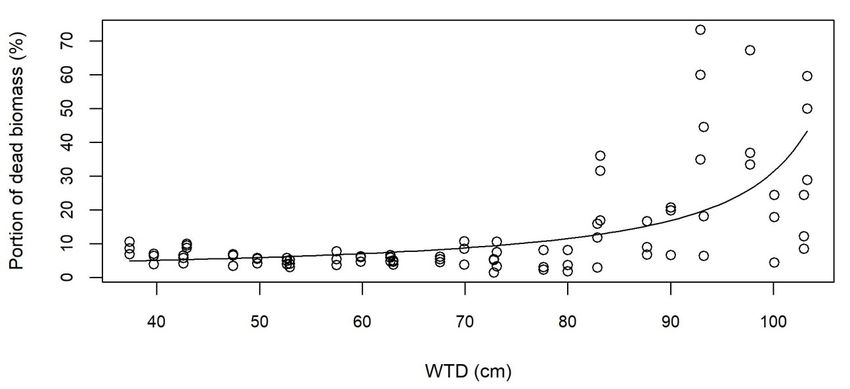
Agriculture
Agriculture 2021, 11, x24FOR PEER REVIEW                                                                                                                 66 of
                                                                                                                                                            of 13
                                                                                                                                                               13

     Figure 3.
     Figure       Soilwater
              3. Soil   watercontent
                                content  in in  5–25
                                             5–25  cmcm(a) (a)
                                                            andand  40–60
                                                                 40–60  cm cm    (b) soil
                                                                            (b) soil depthsdepths   depending
                                                                                               depending           on water
                                                                                                             on water   table table
                                                                                                                              distancedistance
                                                                                                                                         (WTD).  (WTD).
                                                                                                                                                    Data
     were
     Data collected    weeklyweekly
            were collected        in the in
                                          second    growing
                                              the second       season season
                                                            growing    from May fromtoMay
                                                                                      September      2019 at 2019
                                                                                            to September       threeat
                                                                                                                     positions   in each tank
                                                                                                                       three positions          (Figure
                                                                                                                                          in each   tank
     2). Lines2).
     (Figure   areLines
                    fitted byfitted
                         are   mixed  byeffect
                                          mixedLM:    random
                                                  effect         effect =effect
                                                         LM: random       tank number     (a): ln(y)
                                                                                = tank number     (a):= ln(y)
                                                                                                        4.39 −=0.02
                                                                                                                4.39x,−p0.02
                                                                                                                         < 0.001,
                                                                                                                             x, p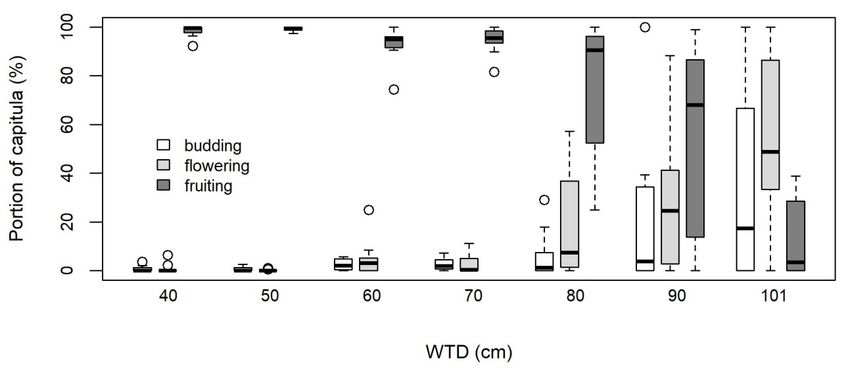
Agriculture 2021,
Agriculture 11,11,
2021, x FOR
24 PEER REVIEW 7 of713
of 13
Agriculture 2021, 11, x FOR PEER REVIEW 7 of 13
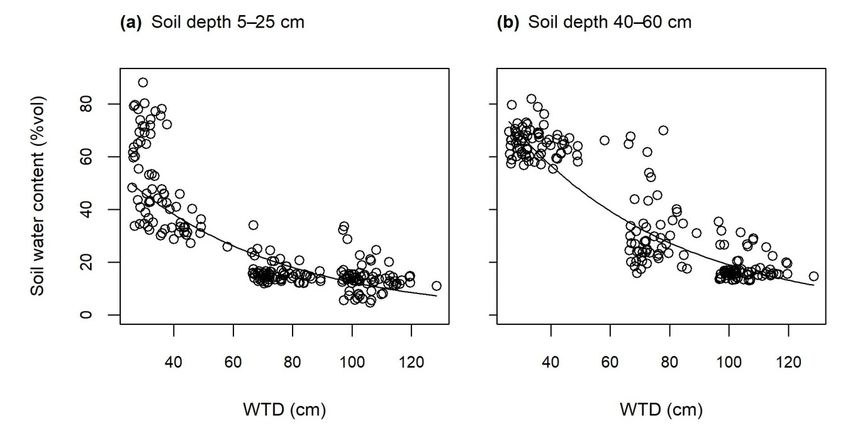
Figure 4.4.4.
Figure
Figure Living aboveground
Living
Living abovegroundbiomass
aboveground biomass(dry
biomass (drymass)
mass) per
per plant
plant of
plant of cup
of cup plant,
cupplant, harvested
plant,harvested
harvested(a): (a):atat
(a): atthe
theend
the end
end of
ofof the
the first
first
the growing
growing
first growing
season
season(August
season(August 2018)
(August 2018) and (b):
and (b):
2018) and at
(b):at the
atthe end
theend of the
endofofthe
thesecond
second
second growing
growing
growing season
season
season (September
(September
(September 2019)
2019)2019) depending
depending
depending on water
on water
on water table dis-
table dis-
table distance
tance (WTD).
tance (WTD).
(WTD). GLM:
GLM:GLM: Gamma-distributed
Gamma-distributed
Gamma-distributed residuals,
residuals,
residuals, square
squaresquare function,
function,
function, (a):
(a): p =(a): p = 0.007,
p =n0.007,
0.007, n
= 82; n = 82;
= 82;
(b): (b):
pAgriculture 2021, 11, x FOR PEER REVIEW 8 of 13
Agriculture 2021, 11, 24 8 of 13
Figure 6. 6.
Figure Portion
Portionofofdead
deadbiomass
biomassof
ofcup
cup plant
plant at the end
end of
ofthe
thesecond
secondgrowing
growingseason
season (September
(September 2019)
2019) depending
depending on on
water table distance (WTD). GLM: Gamma- distributed residuals, p < 0.001, n
water table distance (WTD). GLM: Gamma- distributed residuals, p < 0.001, n = 84. = 84.
3.3.
3.3.Reproductive
Reproductive Potential
Potential
Therewas
There was aa significant
significant effect
effect of
ofWTD
WTDon onthe
thenumber
numberofof capitula
capitula at at
thethe
endend
of the
of the
secondgrowing
second growing season
season (Figure
(Figure 7).
7). The
Theplants
plantsgrowngrownininveryverymoist
moist soil conditions
soil conditions(WTD (WTD
around50
around 50 cm)
cm) had
had the
the most
mostcapitula (mean±±standard
capitula(mean standard deviation
deviation was 349349
was ± 156), whereas
± 156), whereas
in wet soil conditions they developed slightly less (322 ± 143)
in wet soil conditions they developed slightly less (322 ± 143) and in rather dry soil and in rather dry soil
con-
conditions only a fifth (66 ± 115). In maximum one single plant developed
ditions only a fifth (66 ± 115). In maximum one single plant developed 841 capitula (Fig- 841 capitula
(Figure 7). The number of fruits per capitulum was not affected by WTD (LM, p = 0.734)
ure 7). The number of fruits per capitulum was not affected by WTD (LM, p = 0.734) and
and was in mean 27 ± 4. The thousand grain weight was also not affected by WTD (mixed
was in mean 27 ± 4. The thousand grain weight was also not affected by WTD (mixed
effect LM, p = 0.115) and was in mean 18.1 ± 3.9 g. Summing up, the plants grown in
effect LM, p = 0.115) and was in mean 18.1 ± 3.9 g. Summing up, the plants grown in very
very moist to fresh soil conditions had a higher reproductive potential than those in dry or
moist to fresh
wet soil soil conditions
conditions because ofhad a higher
a higher reproductive
number potential
of capitula. than those
The number in drywas
of capitula or wet
soil
significantly correlated with plant height (Spearman’s rho = 0.64, p < 0.001) and not withsig-
conditions because of a higher number of capitula. The number of capitula was
nificantly
number ofcorrelated with plant
shoots (Spearman’s rhoheight
= −0.02,(Spearman’s
p = 0.849). rho = 0.64, p < 0.001) and not with
number of shoots (Spearman’s
In September 2019, more thanrho =90%−0.02,
of pcapitula
= 0.849).of the plants grown in wet to fresh
soil In September
conditions had2019, more than
completed their90% of capitula
flowering periodofandthewere
plants growndeveloping
already in wet to fresh
fruitssoil
conditions
(Figure 8). had
Therecompleted their flowering
was no significant difference period
betweenandthese
werefouralready developing
treatments regarding fruits
developmental
(Figure 8). Therestages of capitula
was no significant differencep between
(KruskalMC, > 0.05). With
theseincreasing WTD theregarding
four treatments devel-
opment slowedstages
developmental down.ofThe drier the
capitula soil, the lower
(KruskalMC, p >was theWith
0.05). portion of fruiting
increasing WTDcapitula
the de-
at the timeslowed
velopment of harvest and The
down. the higher
drier thewas thethe
soil, portion
lower ofwas
budding and flowering
the portion capitula.
of fruiting capitula
atRegarding
the time of allharvest
treatments,
andthere were significant
the higher correlations
was the portion betweenand
of budding rowflowering
in tank and the
capitula.
portion of the three developmental stages of capitula (Spearman’s rho
Regarding all treatments, there were significant correlations between row in tank and the for budding = 0.40,
flowering = 0.68, fruiting = −0.76, p always < 0.001). Thus, plants on drier soil conditions
portion of the three developmental stages of capitula (Spearman’s rho for budding = 0.40,
not only produced less capitula (Figure 7) but took also longer to develop them.
flowering = 0.68, fruiting = −0.76, p always < 0.001). Thus, plants on drier soil conditions
not only produced less capitula (Figure 7) but took also longer to develop them.Agriculture 2021, 11, x FOR PEER REVIEW 9 of 13
Agriculture 2021,2021,
Agriculture 11, x11,
FOR24 PEER REVIEW 9 of 13 9 of 13
Figure
Figure 7. Number
7. Number
Number of capitula
of capitula
capitula perplant
per plantof
ofcup
cup plant,
plant, regardless
regardlessofof
oftheir developmental
their developmentalstage, depending
stage, on water
depending table table
on water
water
Figure 7. of per plant of cup plant, regardless their developmental stage, depending on table
distance
distance (WTD).Data
(WTD). Data were
were collected at the
collected at end
theofend
the second
of growing
the second season (September
growing 2019).
season GLM: Poisson-distributed
(September 2019). GLM: Pois-
distance (WTD). Data were collected at the end of the second growing season (September 2019). GLM: Pois-
residuals, square
son-distributed function,
residuals, p < 0.001,
square n = 84.
function,
son-distributed residuals, square function, ppAgriculture 2021, 11, 24 10 of 13
conditions [5,31,32]. In general, highest yields of cup plant are described on soils with
good soil moisture; hydromorphic soils are unsuitable [3,6]. Cup plant is able to reach deep
water resources with its roots; therefore it is considered as certainly drought-tolerant [3].
Because of the limited soil depth in the present study, deep rooting was prevented and
cup plant suffered considerable damage in the dry treatments. The number of shoots per
plant was in mean 18 and not affected by soil moisture. This value is quite high compared
to other studies, which indicated 3.5 to 6.6 shoots per plant in the second growing sea-
son [33,34]. Essential for this parameter are stand density and age of the plants [33,34].
The fact that cup plant develops shoots already in the first year, as shown in our study,
has not been published so far. We assume that reasons are the sowing early in spring and
the precultivation under optimal conditions in the greenhouse before planting into the
experimental tanks.
A high yield of cup plant under moist soil conditions, as demonstrated in our study,
is desirable from the farmers’ point of view. However, from the perspective of invasion
biology, this might carry the risk that spontaneously grown and established cup plants
could also become such vigorous plants and might compete with native species. Studies
are lacking but necessary to assess the competitiveness of cup plant and its possible risk
of suppression of native species in case of spontaneous settlement. A species could be
classified as invasive if its spread threatens biodiversity (Article 3 No. 2 EU-Regulation
No. 1 143/2014).
4.2. High Reproduction and Rapid Development on Moist Soil
In the present study, cup plant produced the most capitula with about 350 on moist
soil, and their development there was faster in comparison to drier soil conditions. Another
study in Germany confirms our results, where the number of flowering capitula of cup
plant was higher under irrigated than under rainfed conditions [35]. This study also
agrees with ours concerning an independence of number of disc florets per capitulum in
respect to watering. Although fruits of cup plant are developed from ray florets and not
from disc florets [6], this agreement of results confirms that the composition of capitula is
independent of soil moisture conditions. The number of fruits per capitulum was about
27 in the present study and therefore in the upper range or even above the values of
other studies (10–20 or 20–30) [3,6]. Thousand grain weight varies widely in the literature
(14 to 21.5 g [3] and up to 23 g [6]). Our values are with a mean of about 18.1 g rather in
the middle.
The rapid development of fruits on moist soils leads to a high proportion of ripe fruits
at harvesting time. Together with the high fruit production under these conditions, there
is a higher risk of cup plant spreading from the fields—presupposed germination and
saplings’ establishment are likewise successful.
4.3. Consequences and Recommendations for Nature Conservation
Spontaneous occurrences of cup plant have already been documented in seven federal
states of Germany and in other European countries as well [13–16]. From the view of
nature conservation, the indication of colonized sites is important to assess the risk for
protected or otherwise valuable ecosystems. In its native range in eastern North America,
cup plant colonizes moist bottomlands, river valleys, and lakesides [3,6]. This is in line
with our results and confirms a possible risk that cup plant could colonize moist habitats
in Germany, too. So far, observations of spontaneous occurrences of cup plants in Germany
have shown a broader range of habitats. In addition to ruderal places and woody structures,
however, even moist ecosystems as perennial fields on river banks as well as bottomland
woods are colonized [12,36,37]. This circumstance holds together with the high growth
and reproductive potential on moist soils, as shown in our study a particular risk for
nature conservation. Moist ecosystems—such as riparian fringes, alluvial forests, fens, and
swamps—are valuable for nature conservation, because they are endangered according to
the German red list of threatened habitats [38] and protected according to §30 BNatSchG.Agriculture 2021, 11, 24 11 of 13
Thus, an adequate distance of cup plant fields to moist ecosystems should be kept strictly
to prevent their spontaneous colonization by cup plant. Dispersal distance of cup plant
is 6 m in median but could be more than 10 m [12]. Therefore, we recommend for cup
plant fields distances of several 10 m from valuable ecosystems to preclude fruit dispersal
even under extreme wind events. However, dispersal vectors and distances of cup plant
fruits are not investigated, and studies are urgently required to be able to give more precise
recommendations for minimizing the risk of spreading. So far, it is also unknown whether
cup plant fruits can be spread by watercourses and remain viable. As long as this is not
examined, it is important to keep a sufficiently large distance to streams, even if they
are strongly anthropogenic shaped and not valuable for nature conservation. In order to
prevent fruit dispersal by agricultural machines, they should be cleaned before leaving the
field and the crop should be covered during transport.
Additionally, the number and size of cup plant fields play a decisive role for the inva-
sion potential because each newly cultivated field enhances the risk for further spontaneous
spreading [12,39]. In Germany, more than 1000 ha are newly cultivated with cup plant in
each of the recent years, while the older fields remain cultivated [40]. Consequently, further
spreading of cup plant is to be expected and needs to be observed. The areas surrounding
the cup plant fields and the roads from the fields to the farms should be continuously
screened for spontaneous occurrences of cup plant to be able to combat this species where
necessary.
5. Conclusions
In Central Europe, cup plant is a promising bioenergy crop that can achieve high
yields, especially on moist soils. Wetter and drier soils are less suitable, but cup plant is
able to survive on a wide range of soil moisture conditions.
However, a caution in respect to a possible invasiveness of cup plant is advised. The
highest risk for spontaneous colonization by cup plant is—similar to the highest yield—
supposed for ecosystems with moist soils, which are often valuable for nature conservation
in Germany. To assess the actual invasive potential of cup plant, more studies about habitat
requirements, competitiveness, and dispersal vectors of cup plant are urgently needed. If
precautionary measures are observed, cup plant can take a place in the Central European
agricultural landscape and make a valuable contribution to the conservation of biodiversity.
Supplementary Materials: The following tables contain the data on which calculations and figures
of the present study are based. They are available online at https://www.mdpi.com/2077-0472/11
/1/24/s1: Table S1: Weather conditions during the experiment; Table S2: Soil water content over
time; Table S3: Soil water content of soil samples; Table S4: Growth of cup plant at the end of the
first growing season (August 2018); Table S5: Shoot development of cup plant at the end of the first
growing season (November 2018); Table S6: Growth of cup plant at the end of the second growing
season (September 2019); Table S7: Explanation of column names of the Tables S1–S6.
Author Contributions: Conceptualization, M.L. and L.M.E.; methodology, L.M.E. and M.L.; vali-
dation, L.M.E. and M.L.; formal analysis, L.M.E.; investigation, K.K., M.K., A.J.F., and L.M.E.; data
curation, L.M.E., M.K., K.K., and A.J.F.; writing—original draft preparation, L.M.E.; writing—review
and editing, L.M.E., M.L., K.K., A.J.F., and M.K.; visualization, L.M.E.; supervision, L.M.E. and M.L.;
project administration, L.M.E.; funding acquisition, L.M.E. and M.L. All authors have read and
agreed to the published version of the manuscript.
Funding: This research was funded by the Oberfrankenstiftung and the District Government of
Upper Franconia as well as the Studienstiftung des deutschen Volkes. The APC was funded by the
German Research Foundation (DFG) and the University of Bayreuth in the funding program Open
Access Publishing.
Institutional Review Board Statement: Not applicable.
Informed Consent Statement: Not applicable.
Data Availability Statement: The data presented in this study are available in the supplementary
materials (Tables S1–S7).Agriculture 2021, 11, 24 12 of 13
Acknowledgments: We thank the Oberfrankenstiftung and the District Government of Upper Fran-
conia for financial support as well as the Studienstiftung des deutschen Volkes for scholarship of
the first author. Ralf Brodmann (Metzler & Brodmann Saaten GmbH) is thanked for free provision
of cup plant seeds. We thank Andreas Schweiger (Plant Ecology, University of Hohenheim) for the
support in developing the experimental design, Andreas Kolb (Soil Physics, University of Bayreuth)
for the introduction to measurement technologies for soil water content and Oliver Archner as well
as Stefan Holzheu (both Bayreuth Center of Ecology and Environmental Research BayCEER) for
the installation of the measurement technology for water table. Special thanks are given to Frederik
Werner, who supported us generously with plant cultivation and data collection as well as to the
gardeners of the Ecological Botanical Gardens, who always assisted us with their expertise and
manpower. Ursula Bundschuh (Soil Physics, University of Bayreuth) supported us with laboratory
work of soil sampling. Micrometeorology group, University of Bayreuth and Bayreuth Center of
Ecology and Environmental Research BayCEER is given thanks for providing meteorological data.
Elisabeth Schaefer is thanked for English proof reading.
Conflicts of Interest: The authors declare no conflict of interest.
References
1. IRENA. Renewable Energy Statistics 2019; The International Renewable Energy Agency: Abu Dhabi, UAE, 2019; ISBN 978-92-9260-
137-9.
2. Frölich, W.; Brodmann, R.; Metzler, T. The cup plant (Silphium perfoliatum)—A story of success from agricultural practice. J. Cultiv.
Plants 2016, 68, 351–355. [CrossRef]
3. Gansberger, M.; Montgomery, L.F.R.; Liebhard, P. Botanical characteristics, crop management and potential of Silphium perfolia-
tum L. as a renewable resource for biogas production: A review. Ind. Crops Prod. 2015, 63, 362–372. [CrossRef]
4. Emmerling, C. Soil quality through the cultivation of perennial bioenergy crops by example of Silphium perfoliatum—An innovative
agro-ecosystem in future. J. Cultiv. Plants 2016, 68, 399–406. [CrossRef]
5. Ruf, T.; Audu, V.; Holzhauser, K.; Emmerling, C. Bioenergy from Periodically Waterlogged Cropland in Europe: A First
Assessment of the Potential of Five Perennial Energy Crops to Provide Biomass and Their Interactions with Soil. Agronomy 2019,
9, 374. [CrossRef]
6. Stanford, G. Silphium perfoliatum (cup-plant) as a new forage. In Proceedings of the Twelfth North American Prairie Conference,
Cedar Falls, IA, USA, 5–9 August 1990; pp. 33–37.
7. Südwestrundfunk. Anbaufläche von Silphie ist größer geworden. SWR Aktuell. 5 September 2019. Available online: https://www.
swr.de/swraktuell/baden-wuerttemberg/friedrichshafen/groessere-anbauflaeche-silphie-100.html (accessed on 15 May 2020).
8. Hartmann, A.; Lunenberg, T. Yield potential of cup plant under Bavarian cultivation conditions. J. Cultiv. Plants 2016, 68, 385–388.
[CrossRef]
9. Burmeister, J.; Walter, R. Studies on the ecological effect of Silphium perfoliatum in Bavaria. J. Cultiv. Plants 2016, 68, 407–411.
[CrossRef]
10. Dauber, J.; Müller, A.L.; Schittenhelm, S.; Schoo, B.; Schorpp, Q.; Schrader, S.; Schroetter, S. Schlussbericht zum Vorhaben:
Agrarökologische Bewertung der Durchwachsenen Silphie (Silphium perfoliatum L.) als eine Biomassepflanze der Zukunft. 2016.
Available online: https://literatur.thuenen.de/digbib_extern/dn056633.pdf (accessed on 13 March 2019).
11. Mueller, A.L.; Dauber, J. Hoverflies (Diptera: Syrphidae) benefit from a cultivation of the bioenergy crop Silphium perfoliatum
L. (Asteraceae) depending on larval feeding type, landscape composition and crop management. Agric. For. Entomol. 2016, 18,
419–431. [CrossRef]
12. Ende, L.M.; Lauerer, M. Spontaneous occurrences of the cup plant in the Bayreuth region: Does this new bioenergy crop have
invasive potential? Nat. Landsch. 2020, 95, 310–315. [CrossRef]
13. Roskov, Y.; Ower, G.; Orrell, T.; Nicolson, D.; Bailly, N.; Kirk, P.M.; Bourgoin, T.; DeWalt, R.E.; Decock, W.; van Nieukerken, E.;
et al. Species 2000 & ITIS Catalogue of Life, 2019 Annual Checklist. Available online: http://www.catalogueoflife.org/annual-
checklist/2019/details/species/id/d1c5f933225a3fa3a7974259458811ac (accessed on 7 February 2020).
14. Brennenstuhl, G. Beobachtungen zur Einbürgerung von Gartenflüchtlingen im Raum Salzwedel (Altmark). Mitt. Florist. Kart.
Sachs. Anhalt. 2010, 15, 121–134.
15. Wölfel, U. Zur Flora von Bitterfeld und Umgebung (11. Beitrag). Mitt. Florist. Kart. Sachs. Anhalt 2013, 18, 47–53.
16. Verbreitung der Farn- und Blütenpflanzen in Deutschland; aggregiert im Raster der Topographischen Karte 1:25000—Silphium
perfoliatum. Available online: http://www.floraweb.de/webkarten/karte.html?taxnr=5635 (accessed on 12 March 2019).
17. Matthews, J.; Beringen, R.; Huijbregts, M.A.J.; van der Mheen, H.J.; Odé, B.; Trindade, L.; van Valkenburg, J.L.C.H.; van der Velde,
G.; Leuven, R.S.E.W. Horizon Scanning and Environmental Risk Analyses of Non-Native Biomass Crops in the Netherlands; De-
partment of Environmental Science, Institute for Water and Wetland Research, Radboud University Nijmegen: Nijmegen,
The Netherlands, 2015.
18. Vinogradova, Y.K.; Mayorov, S.R.; Bochkin, V.D. Changes in the spontaneous flora of the Main Botanic Garden, Moscow, over
65 years. Skvortsovia 2015, 2, 45–95.Agriculture 2021, 11, 24 13 of 13
19. Bufe, C.; Korevaar, H. Evaluation of Additional Crops for Dutch List of Ecological Focus Area; Wageningen Research Foundation (WR)
business unit Agrosystems Research: Wageningen, The Netherlands, 2018. [CrossRef]
20. Schoo, B.; Wittich, K.P.; Böttcher, U.; Kage, H.; Schittenhelm, S. Drought Tolerance and Water-Use Efficiency of Biogas Crops: A
Comparison of Cup Plant, Maize and Lucerne-Grass. J. Agron. Crop Sci. 2017, 203, 117–130. [CrossRef]
21. Ellenberg, H. Physiologisches und ökologisches Verhalten derselben Pflanzenarten. Ber. Deutsch. Bot. Ges. 1952, 65, 350–361.
22. Ellenberg, H. Über einige Fortschritte der kausalen Vegetationskunde. Plant Ecol. 1954, 5, 199–211. [CrossRef]
23. Hector, A.; von Felten, S.; Hautier, Y.; Weilenmann, M.; Bruelheide, H. Effects of dominance and diversity on productivity along
Ellenberg’s experimental water table gradients. PLoS ONE 2012, 7, e43358. [CrossRef] [PubMed]
24. R Core Team. R: A Language and Environment for Statistical Computing; R Foundation for Statistical Computing: Vienna, Austria,
2019.
25. Wickham, H. The Split-Apply-Combine Strategy for Data Analysis. J. Stat. Softw. 2011, 40, 1–29. [CrossRef]
26. Holzheu, S.; Archner, O. BayEOS: BayEOS Server Access; R package version 1.4.6.: Bayreuth, Germany, 2017.
27. Giraudoux, P. Pgirmess: Spatial Analyses and Data Mining for Field Ecologists; R Package version 1.6.9.: Besançon, France, 2018.
28. Bates, D.; Mächler, M.; Bolker, B.; Walker, S. Fitting Linear Mixed-Effects Models Using lme4. J. Stat. Soft. 2015, 67. [CrossRef]
29. Blüthner, W.-D.; Krähmer, A.; Hänsch, K.-T. Breeding progress in cup plant-first steps. J. Cultiv. Plants 2016, 68, 392–398.
[CrossRef]
30. Wrobel, M.; Fraczek, J.; Francik, S.; Slipek, Z.; Krzysztof, M. Influence of degree of fragmentation on chosen quality parameters of
briquette made from biomass of cup plant Silphium perfoliatum L. Eng. Rural Dev. 2013, 12, 653–657.
31. Schittenhelm, S.; Schoo, B.; Schroetter, S. Yield physiology of biogas crops: Comparison of cup plant, maize, and lucerne-grass. J.
Cultiv. Plants 2016, 68, 378–384. [CrossRef]
32. Figas, A.; Siwik-Ziomek, A.; Rolbiecki, R. Effect of irrigation on some growth parameters of cup plant and dehydrogenase activity
in soil. Ann. Warsaw Univ. Life Sci. SGGW Land Reclam. 2015, 47, 279–288. [CrossRef]
33. Boe, A.; Albrecht, K.A.; Johnson, P.J.; Wu, J. Biomass Production of Cup Plant (Silphium perfoliatum L.) in Response to Variation in
Plant Population Density in the North Central USA. Am. J. Plant Sci. 2019, 10, 904–910. [CrossRef]
34. Bury, M.; Możdżer, E.; Kitczak, T.; Siwek, H.; Włodarczyk, M. Yields, Caloric Value and Chemical Properties of Cup Plant Silphium
perfoliatum L. Biomass, Depending on the Method of Establishing the Plantation. Agronomy 2020, 10, 851. [CrossRef]
35. Mueller, A.L.; Berger, C.A.; Schittenhelm, S.; Stever-Schoo, B.; Dauber, J. Water availability affects nectar sugar production and
insect visitation of the cup plant Silphium perfoliatum L. (Asteraceae). J. Agron. Crop Sci. 2020. [CrossRef]
36. Rothmaler—Exkursionsflora von Deutschland. Gefäßpflanzen: Grundband, 21st ed.; Jäger, E.J. (Ed.) Springer Spektrum: Berlin,
Germany, 2017; ISBN 978-3-662-49707-4.
37. Schmeil—Fitschen: Die Flora Deutschlands und Angrenzender Länder, 96th ed.; Parolly, G.; Rohwer, J.G. (Eds.) Quelle & Meyer Verlag
QM: Wiebelsheim, Germany, 2016; ISBN 9783494017303.
38. Finck, P.; Heinze, S.; Raths, U.; Riecken, U.; Ssymank, A. Rote Liste der gefährdeten Biotoptypen Deutschlands. Natursch. Biol.
Vielf. 2017, 156, 637.
39. Kowarik, I. Humann agency in biological invasions: Secondary releases foster naturalisation and population expansion of alien
plant species. Biol. Invasions 2003, 5, 293–312. [CrossRef]
40. Donau-Silphie. Available online: https://www.donau-silphie.de/ (accessed on 9 September 2020).You can also read