Kemira Investor Presentation - Chemistry for a resource-efficient future INVESTOR PRESENTATION

Page created by Gail Mejia
 
CONTINUE READING
Kemira Investor Presentation - Chemistry for a resource-efficient future INVESTOR PRESENTATION
JULY 17, 2020

Kemira Investor Presentation
Chemistry for a resource-efficient future

INVESTOR PRESENTATION
Kemira Investor Presentation - Chemistry for a resource-efficient future INVESTOR PRESENTATION
INVESTOR PRESENTATION

Content
1. Kemira in brief
2. Investment highlights
3. Kemira as a sustainable investment
4. Pulp & Paper
5. Industry & Water
6. Recent progress
7. Appendix

        JULY 17, 2020   INVESTOR PRESENTATION   2
Kemira Investor Presentation - Chemistry for a resource-efficient future INVESTOR PRESENTATION
INVESTOR PRESENTATION

Kemira in
brief

       JULY 17, 2020   INVESTOR PRESENTATION   3
Kemira Investor Presentation - Chemistry for a resource-efficient future INVESTOR PRESENTATION
O UR PURPO SE

                            We enable our customers to improve their water, energy and raw material efficiency

G LO BAL T RENDS                                          O UR CUST O M ERS                           O UR VISIO N

GROWING MIDDLE
CLASS & URBANIZATION
                                                          Pulp & Paper                                Our vision is to be the first
Higher use of water, energy, tissue & board               Water Treatment                             choice in chemistry for
E-commerce/online shopping                                Oil & Gas                                   water intensive industries
SCARCITY OF RESOURCES                                                                                 OUR STRATEGY
New materials to enable circular economy
Material and resource efficiency                                                                      Kemira is a great product company with chemistry
                                                                                                      and selling of chemicals at the core of our business.
                                                          OUR OFFERING                                We win with best suited products and tailored
REGULATION                                                                                            services that improve our customers product quality,
                                                          We provide expertise, application know-
More stringent discharge limits                                                                       process and resource efficiency.
                                                          how and chemicals that improve our
Safe drinking water                                       customers‘ product quality, process and     Our target is to grow above-the-market with an
                                                          resource efficiency.                        operative EBITDA margin of 15-17%.

                                                                       O UR VALU ES
                                  We drive performance and innovation. We are dedicated to customer success.
                                          We care for people and the environment. We succeed together.

           JULY 17, 2020          INVESTOR PRESENTATION                                                                                                       4
Kemira Investor Presentation - Chemistry for a resource-efficient future INVESTOR PRESENTATION
Kemira in brief
LAST 12 MONTHS: REVENUE EUR 2,572 MILLION, OPERATIVE EBITDA EUR 422 MILLION,
OPERATIVE EBITDA MARGIN 16.4%, OPERATIVE ROCE 11.6%

SEGMENT SPLIT                                          GEOGRAPHIES                                                         PRODUCTS
◼ 42%                               ◼ 58%                                                               10%                ◼ 20% Other:
                                                                                                        APAC               e.g. defoamers,                              ◼ 25% Bleaching
Industry & Water                    Pulp & Paper
                                                       40%                                              1. China           dispersants,                                 and pulping
                                       #2 globally     AMERICAS                                         2. South           and biocides
                                                       1. USA                                              Korea
                                                       2. Canada                                        3. Thailand
                                                                                                                           ◼ 15%
                                                       3. Brazil                                                           Sizing
#1 in                                                                                                                      and
                                                                                                50%
water                                                                                                                      strength
                                                                                                EMEA
treatment
                                                                                                1. Finland
in NA and
                                                                                                2. Sweden                  ◼ 20%                                              ◼ 20%
Europe
                                                                                                3. Germany                 Polymers                                           Coagulants
#2 in friction reduction in North
American shale oil & gas                                Revenue by geographies and product category represent FY 2019.

CUSTOMERS                                              EXAMPLES OF
Several thousand customers                             LARGEST CUSTOMERS
TOP 10 customers are ~25% of revenue                   Municipalities, e.g.
TOP 50 customers are ~50% of revenue                   Frankfurt, Berlin, New York,
                                                       Paris, Shanghai, Singapore
                                                                                                                         Note: Revenue by industry, product and geography rounded to the nearest 5%

                 JULY 17, 2020      INVESTOR PRESENTATION                                                                                                                                             5
Kemira Investor Presentation - Chemistry for a resource-efficient future INVESTOR PRESENTATION
Global reach – local excellence
64 MANUFACTURING SITES

                                                                         KEMIRA HQ
                                                                         Helsinki, Finland
                                                                         R&D
                                                                         Espoo, Finland
                     Regional HQ
                     Atlanta, USA

                              R&D                                                                              Regional HQ
                     Atlanta, USA                                                                              Shanghai, China

                                                                                                               R&D
                                                            EMEA 50%                                           Shanghai, China
                                                            EUR 1,339 MILLION
                                                                                                     ASIA PACIFIC 10%
                                                                2,545                                EUR 258 MILLION
                               AMERICAS 40%
                               EUR 1,062 MILLION                                                         947
UNITS IN
40 COUNTRIES                          1,570
SALES IN OVER
100+ COUNTRIES

  Polymers and other process chemicals (25)
  Bleaching and pulping (10)
  Coagulants (29)                                                       Employees
                                                                        R&D and technology centers

               JULY 17, 2020        INVESTOR PRESENTATION                                                                        6
Kemira Investor Presentation - Chemistry for a resource-efficient future INVESTOR PRESENTATION
We have transformed the company several
times over the past 100 years
          1950                    1961              1972              1985-1992           1994               2008                 2015
          Development of      Name changed          The “Kemira”      Expansion           Kemira is listed on Water chemistry     Acquisition of
          first chemicals for to Rikkihappo Oy      name adopted      continues in        the Helsinki stock established as the   Akzo Nobel’s
          paper applications (Sulfuric acid Ltd.)                     Europe e.g.         exchange            focus of strategy   paper chemicals
                                                                      Belgium and                                                 business
                                                                      Spain

 STATE-                                                                                    PUBLICLY TRADED
 OWNED                                                                                     COMPANY

 FERTILIZERS AS                                     CONGLOMERATE                                                         WATER AS
 CORE STRATEGY                                                                                                           CORE STRATEGY

1920                                                         1982               1989                2004                2009                  2020
Establishment of                                             First expansion    Kemira expands      GrowHow listed      Tikkurila listed on   Kemira centennial
the state-owned                                              abroad to the UK   to Asia through     on the Helsinki     the Helsinki Stock    anniversary
sulphuric acid and                                                              joint venture in    Stock Exchange      Exchange
phosphorous                                                                     Japan
fertilizer plants

                  JULY 17, 2020      INVESTOR PRESENTATION                                                                                                        7
Kemira Investor Presentation - Chemistry for a resource-efficient future INVESTOR PRESENTATION
Pulp & Paper – strong business with solid
 track record
 REVENUE AND OPERATIVE EBITDA                               REVENUE BY CUSTOMER                                     REVENUE BY
 EUR million                                                TYPE AND MARKET GROWTH                                  PRODUCT CATEGORY
                                         1,520    1,523          ◼ 40%           ◼ 40%        ◼ 20%                 ◼ 5% Other                                             ◼ 40%
                                                                 Pulp            Board &      Printing &                                                                   Bleaching
                                                                                 tissue       writing papers        ◼ 10%                                                  & pulping
                                 1,477
                                                                                                                    Polymers
                   1,457                           218
                                                                                                                    ◼ 20%
    1,417                        198     192                                                                        Defoamers,
                    195
                                                                                                                    dispersants,
     171
                                                                                                                    biocides and
                                                                 Market
                                                                          1-2%             2-3%       -1-2%         other process
                                                                                                                                                                             ◼ 25%
                                                                 growth                                                                                                      Sizing &
                                                                                                                    chemicals
    2015           2016          2017    2018      2019                                                                                                                      strength

 MARKET ENVIRONMENT                                         REVENUE BY GEOGRAPHIES AND                              CUSTOMER EXAMPLES
 Solenis (paper)*                                    #1     MARKET GROWTH BY REGION
                                                                                                     ◼ 15%
                                                                 ◼ 50%                 ◼ 35%         APAC
 Kemira (pulp and paper) m.s. ~16% #2                            EMEA                  Americas
 Nouryon (pulp)                                      #3
 Ecolab (paper)                                      #4
                                                                 Market
 Kurita (paper)                                      #5                   1%           0-1%           2-3%
                                                                 growth
* Solenis-BASF combined entity
                                                                                                               Note: Revenue by industry, product and geography rounded to the nearest 5%

                       JULY 17, 2020     INVESTOR PRESENTATION                                                                                                                              8
Kemira Investor Presentation - Chemistry for a resource-efficient future INVESTOR PRESENTATION
Industry & Water – strong positions in
chosen categories
REVENUE AND OPERATIVE EBITDA                                             REVENUE BY APPLICATION                                     REVENUE BY
EUR million                                                     1,136    TYPE AND MARKET GROWTH                                     PRODUCT CATEGORY
                                                1,073
                                1,009
  956
                  906                                                     ◼ 65%                              ◼ 25%     ◼ 10%        ◼ 20%                                               ◼ 40%
                                                                 192      Water treatment                    Oil & Gas Other        Other                                               Coagulants
                                                                                                                                    products
                                                 131
                                                                                                                                    such as
  116             107             114                                     Municipal            Industrial                           defoamers
                                                                                                                                    and biocides

 2015            2016            2017            2018           2019
                                                                          Market
                                                                                        2-3%                   5-6%   2-3%         ◼ 40%
2015-2016 figures are pro forma; combination of Municipal & Industrial    growth                                                   Polymers
and Oil & Mining segments

MARKET ENVIRONMENT                                                       REVENUE BY GEOGRAPHIES AND                                 CUSTOMER EXAMPLES
WATER TREATMENT                        OIL & GAS                         MARKET GROWTH BY REGION
Market share                           Market share ~25% in               ◼ 45%                    ◼ 50%                ◼ 5%        MUNICIPAL (40%),                    INDUSTRIAL (60%),
~30% in coagulants and                 polymers used in shale             EMEA                     Americas             APAC        customer examples                   customer examples
~20% in polymers                       oil & gas
                                                                                                                                    Amsterdam      Los Angeles
                                                                                                                                    Barcelona      Montreal
Main competitors in                    Main peers in polymers                                                                       Frankfurt      New York City
coagulants:                            (also in water treatment):                                                                   Berlin         Toronto
• Feralco (Europe)                     • SNF                                                                                        Oslo           Melbourne
                                                                          Market
• Kronos (Europe)                      • Solenis*                         growth      3-4%                  3-4%        5-6%        Paris          Shanghai
                                                                                                                                    Stockholm      Singapore
• Chemtrade (NA)                       • Solvay (only O&G)
• USAlco (NA)
                                      * Solenis-BASF combined entity                                                           Note: Revenue by industry, product and geography rounded to the nearest 5%

                        JULY 17, 2020             INVESTOR PRESENTATION                                                                                                                                     9
Kemira Investor Presentation - Chemistry for a resource-efficient future INVESTOR PRESENTATION
Kemira’s financial targets
FINANCIAL TARGETS AND HISTORICAL FIGURES
Targets                2018                     2019                    IFRS 16 impact in           Q2 2020               Financial target
                                                                        2019
Revenue                MEUR 2,593               MEUR 2,659              -                           MEUR 583              Above-market
                       Change +4%               Change +3%                                          Change -12%           growth
Operative              12.5%                    15.4%                   Around +1.3 %-point         18.1%                 15-17%
EBITDA*
Gearing*               62%                      66%                     Around +11 %-points         70%                   Below 75%
* Targets updated in February 2019 due to IFRS 16 accounting change. 2017-2018 figures are PRE IFRS 16.

KEY FACTORS TO WATCH FOR PROFITABILITY IMPROVEMENT
Factors                                                                              Q2 2020 comments
Sales price vs raw material price development                                        Favorable variable cost development, including raw
                                                                                     materials. Good fixed cost management.
Organic growth through volume and sales price increases                              Group’s organic growth -12%, sales volumes were
                                                                                     impacted by COVID-19 related economic slowdown.
Growth investments – Polymer capacity expansion in Netherlands, AKD                  Gradual positive contribution to EBITDA starting Q1 2020.
sizing Joint Venture in China, Polymer capacity expansion in the US                  Positive impact from investments in China and the
                                                                                     Netherlands continued.

              JULY 17, 2020    INVESTOR PRESENTATION                                                                                             10
INVESTOR PRESENTATION

Investment
highlights

       JULY 17, 2020   INVESTOR PRESENTATION   11
Why invest in Kemira

           Profitability improvement track record
 1         Operative EBITDA margin improved to 18.1% and
           Operative EBIT to 9.9% Q2/2020

           Attractive and sustainable dividend
 2         Solid dividend and competitive yield

           Sustainable investment
 3         Climate ambition to carbon neutrality by 2045

     JULY 17, 2020   INVESTOR PRESENTATION                 12
Strategy and Equity Story in summary
HOW KEMIRA CREATES VALUE

               OUR MARKET                                          BUILDING A GREAT                           EXECUTION – VALUE
                 FOCUS                                            CHEMICALS COMPANY                             OVER VOLUME

         Chemicals for Pulp & Paper,                                    Great products:                    Improving product and market mix
        Oil & Gas and Water Treatment                        4 core areas are polymers, coagulants,
                                                                                                             Focusing on capital efficiency
                                                           sizing and bleaching chemicals which meet
         #1 or #2 in our core markets
                                                          our customers’ needs incl. resource efficiency      Investing selectively in core
   Market growth estimated to be 2-3% p.a.                                                                  product areas with higher return
                                                                        Great operations:
    supported by higher use of fiber-based                                                                        on capital employed
                                                              Deliver reliably with consistent quality
  products, resource efficiency and regulation
                                                                         Great people:
                                                                   Deep application expertise
                                                                    and innovation capability

                                                         FINANCIAL TARGETS
                             Above the market revenue growth • Operative EBITDA 15-17% • Gearing below 75%

             JULY 17, 2020        INVESTOR PRESENTATION                                                                                        13
Global megatrends favor Kemira

          GROWING MIDDLE
                                                                SCARCITY
          CLASS &                                                                                   REGULATION
                                                                OF RESOURCES
          URBANIZATION

    Higher use of           E-commerce /                 Alternative       Material and   More stringent     Safe drinking
   water, energy,          online shopping               materials for      resource      discharge limits      water
 tissue and board                                     single-use plastic    efficiency
                                                          products

           JULY 17, 2020      INVESTOR PRESENTATION                                                                          14
Healthy market growth for Kemira’s
relevant markets
KEMIRA RELEVANT MARKET                                                  PULP & PAPER RELEVANT MARKET
EUR billion                                                             EUR billion

                                                                                        9              CAGR:              10
                                                                  27                                      1-2%
                                               CAGR:
                         22                     3-4%

                                                                                      2019                               2025
                                                                                      Pulp   Printing & writing    Board & tissue

                                                                        INDUSTRY & WATER RELEVANT MARKET
                                                                        EUR billion
                                                                                                                          18
                                                                                       13              CAGR:
                                                                                                          5-6%

                       2019                                      2025                 2019                               2025
                                Americas          EMEA     APAC                         Water treatment      Oil & Gas   Other
Source: Management estimation based on various sources

                     JULY 17, 2020            INVESTOR PRESENTATION                                                                 15
Good profitability improvement track record
REVENUE                                                             OPERATIVE EBITDA
EUR million                                                         OPERATIVE EBITDA MARGIN
                                                                    EUR million

                                                                                                                    410
                                                            2,659
                                                    2,593
                                        2,486
                2,373         2,363                                                                          323          15.4%
                                                                                          303        311
                                                                               287
    2,137                                                              253
                                                                                         12.8%      12.5%   12.5%
                                                                              12.1%
                                                                      11.8%

    2014        2015          2016      2017        2018    2019      2014    2015       2016       2017    2018    2019

                                                                                      PRE IFRS 16

              JULY 17, 2020       INVESTOR PRESENTATION                                                                           16
Key profitability improvement actions in
      2016-2019
   Organic growth / expansion of site         Acquisition      Operational efficiencies             Closure of site / divestment

                        Start-up of Ortigueira sodium              Chevron CEOR deal &                         Start-up of new AKD wax site (CN)        Ramp-up of of new
                        chlorate site (BR)                         Botlek expansion                                                                      AKD wax site (CN)
                                                                                                               Polymer investment decision (US)
                        Bradford polymer expansion                 Start-up of Joutseno chlorate                                                       Ramp-up of of new
                        (UK)                                       expansion (FI)                              Joint Venture – Dry polymers (SK)       polymer facility (NL)
                                                                                                                                                        Bleaching capacity
                        San Giorgio polymer                        Major oil sands tailings water             AKD wax manufacturing JV                      extension (US)
                        expansion (IT)                             treatment deal (CA)                        deal closed (CN)
                                                                                                                                               2019
Operative                                                                                                                                                                         Operative
EBITDA 2015:
                                                                                                       2018
                                                                                                                                                      Move from ‘Value             EBITDA
12.1%                                                       2017                                                                                      over volume’ to ‘Active         2019:
                                                                                                              ‘Value over volume’ initiated           price management’              15.4%
                 2016
                                                                   Two segment                                Odyssey go-live in Europe               Cost savings in             (IFRS 16
                                                                   structure operational                                                              Pulp & Paper                included)
                        Transportation agreement                                                              Closing of ECOX detergent
                        with Odyssey                               Odyssey go-live                            production (SWE)                        Divestment of
                                                                   in North America                                                                   coagulant asset (IT)
                        Botlek modernization (NL)
                        BOOST operational                                                                                                             Divestment of
                        excellence program launch                                                                                                     Kemira Operon
                                                                                                                                                      (water treatment facility
                        Closures of Ottawa (CA) and                                                                                                   operations, FI)
                        Zaramillo (ES), coagulants

                        JULY 17, 2020      INVESTOR PRESENTATION                                                                                                                         17
Good dividend track record

Dividend policy:                                                                         Dividend 2019:                                                                           Total dividend payment of max
                                                                                                                                                                                  EUR 86 million; fully covered
• Stable and                                                                             Kemira’s Annual General
                                                                                                                                                                                  by 2019 free cash flow of
  competitive dividend                                                                   Meeting authorized the Board
                                                                                                                                                                                  EUR 190 million
                                                                                         of Directors to decide on
• No fixed payout ratio
                                                                                         a dividend payment of                                                                    First installment paid in May
                                                                                         max EUR 0.56                                                                             2020; Board to discuss second
                                                                                                                                                                                  installment in the autumn

Kemira’s dividend yield calculated using the share price at year-end
◼ Dividend per share                      Dividend yield
                                                                                                                                                                                                                               0,56*
            0.48                      0.53                     0.53                     0.53                      0.53                     0.53                     0.53                      0.53                      0.53

            4.1%                      5.8%                     4.5%                     4.4%                      5.4%                     4.9%                      4.4%                     4.6%                      5.4%   4.2%

            2010                     2011                     2012                      2013                     2014                      2015                     2016                     2017                       2018   2019
*AGM authorized the Board to decide on a dividend payment of max. EUR 0.56 at its discretion to be paid in two installments in May and November. The first installment, EUR 0.28 per share, was paid on May 14, 2020.
The Board of Directors would make separate resolutions on the amount and timing of the second installment of max EUR 0.28 per share. Kemira will announce this Board resolution separately.

                          JULY 17, 2020                  INVESTOR PRESENTATION                                                                                                                                                         18
We invest in core products globally
KEY INVESTMENT FOCUS ON CORE PRODUCT
GROUPS SINCE 2016
                                                            PRODUCTS
•    Bleaching chemicals
    • New chlorate plant in Brazil                          ◼ 20% Other:                                                    ◼ 25% Bleaching
    • New chlorate line in the U.S.                         e.g. defoamers,                                                 and pulping
    • New chlorate line and peroxide capacity in Finland    dispersants,
                                                            and biocides
    • Freed peroxide capacity from ECOX closure in
        Sweden
•    Polymer capacity additions                                                             Revenue
    • Italy                                                                                EUR 2,659
                                                             ◼ 15%
    • UK                                                     Sizing*                         million
    • Aberdeen, USA                                          and                             (2019)
    • Netherlands                                            strength
    • South Korea (start 2021)
    • Mobile, USA (start 2021)
•   Sizing chemicals – capacity additions due to                        ◼ 20%                                                  ◼ 20%
    integration of acquisitions (Akzo Nobel and China AKD               Polymers                                               Coagulants

    wax)
•    Coagulants                                             *Sizing = Resistance against water absorption
    • Goole, UK (start 2022)
                                                                                                        Note: Revenue by product rounded to the nearest 5%.

            JULY 17, 2020   INVESTOR PRESENTATION                                                                                                             19
We continued to invest in product
development in 2019
Innovation
We innovate together with our customers to
improve water, energy and raw material
efficiency. Research and development
expenses totaled EUR 30 million euros in
2019, representing around 1.1% of the
revenue.
Achievements in 2019:
• New product launches: 5
• New patent filings: 37
• Patent families: 365
• Patents: 1,681

         JULY 17, 2020   INVESTOR PRESENTATION   20
We are working towards more sustainable
products
                                                 OVER 50% OF OUR PRODUCTS IMPROVE OUR

     >50%                                        CUSTOMERS’ RESOURCE EFFICIENCY

  SHARE OF PRODUCTS THAT                         I N C R E A S E D R & D F O C U S O N B I O - B A S E D M AT E R I A L S :
    IMPROVE CUSTOMER                             N E W C O R P O R AT E S T R AT E G I C P R O G R A M O N B I O -
   RESOURCE EFFCIEINCY                           BASED PORTFOLIO LAUNCHED IN Q1/2020

                                                 RECENT PRODUCT LAUNCHES TO INTRODUCE NEW
 WE TREAT THE EQUIVALENT OF                      MORE BIO-BASED PRODUCTS:

                                                 • A renewable sizing chemical based on sunflower oil

        375                                        introduced during Q2 2020

                                                 • New strength products with increased biobased
      MILLION PEOPLE’S                             content
     ANNUAL WATER USE

         JULY 17, 2020   INVESTOR PRESENTATION                                                                                21
PULP & PAPER

                                         SUSTAINABLE PACKAGING

                                         Functional and
                                         safe fiber-based
                                         food packaging

                BIOBASED CHEMISTRIES

                Replacing fossil-based
                raw materials
JULY 17, 2020    INVESTOR PRESENTATION                           22
INVESTOR PRESENTATION

Kemira as a
sustainable
investment

       JULY 17, 2020   INVESTOR PRESENTATION   23
6 COMMITMENTS, 7 KPI’S AND TARGETS

How we manage sustainability
Incorporating sustainability into                                                          Ensuring responsible operations
our products and solutions                                                                 to protect our assets, our
Proactive product stewardship                                                              environment, employees,
throughout the products’ lifecycle                                                         contractors, customers and
                                                              Sustainable                  communities
                                                                            Responsible
                                                               products
 KPI’S AND TARGETS                                                          operations &   Ensuring compliance with
                                                                  and                      responsible business practices
 At least 50% of our revenue is generated
 through products improving customers’                                      supply chain
 resource efficiency                                           solutions                   in our supply chain

                                                                                            KPI’S AND TARGETS
                                                                                            •   -30% by 2030 (Scope 1&2; 2018
Culture and commitment to people                                                                baseline) and carbon neutrality
                                                                                                ambition by 2045
Ensuring compliance with                                                                    •   People safety TRIF 2.0 by 2020
Kemira Code of Conduct                                                People and            •   Supplier Sustainability Evaluation

 KPI’S AND TARGETS
                                                                       integrity            •   90% of direct key suppliers screened
                                                                                                through sustainability evaluation
 •   Employee engagement index above industry benchmark                                         through assessments and audits
                                                                                                (Baseline 60% in 2017)
 •   Leadership development activities 2 per people manager
     position, cumulative target 1500 by 2020 (2015=0)
 •   Integrity index continuously increasing

                   JULY 17, 2020         INVESTOR PRESENTATION                                                                         24
S U S TA I N A B I L I T Y

We enable our                                                   CLIMATE CHANGE TARGET

customers to                                                        30%
                                                                                          KEMIRA FULLY
                                                                                            SUPPORTS
improve their water,                                              Reduction               PARIS CLIMATE
                                                                                           AGREEMENT
                                                                   by 2030
energy and raw
material efficiency                                                            LONG-TERM AMBITION:

                                                                   Carbon neutrality by 2045

     JULY 17, 2020   INVESTOR PRESENTATION                                                                25
Updated climate                             2030 climate change target introduced
                                            • 30% reduction in combined scope 1 and 2
change target                                 greenhouse gas emissions by 2030 (baseline
                                              year 2018, 0.93 Mt)
introduced in 2020                            – Kemira Scope 1 absolute emissions 2018: 0.15 Mt
                                              – Kemira Scope 2 absolute emissions 2018: 0.78 Mt
                                            • Kemira working with suppliers to decrease
                                              carbon footprint of purchased goods and
                                              services (scope 3 emissions)
                                            • Our purpose: We enable our customers to
                                              improve their water, energy and raw material
                                              efficiency
                                            • Kemira fully supports UNFCCC Paris
                                              Agreement
                                            Long-term ambition
                                            • Carbon neutrality by 2045 for combined scope
                                              1 and scope 2 emissions

    JULY 17, 2020   INVESTOR PRESENTATION                                                         26
53% of revenue generated from products
that improve customer resource-efficiency
 PULP & PAPER                                     INDUSTRY & WATER
 Kemira’s chemicals improve the
 manufacturing process and enable
 better resoruce-efficiency.                      WATER TREATMENT                          OIL & GAS
 For example                                      Municipal and industrial                 Shale:
 Our chemistry is helping to improve              water treatment:
                                                                                           our chemicals reduce friction and
 recycled fiber quality and content,              chemical water treatment provides        improve energy efficiency of shale
 energy and water efficiency in                   the most compact plant and               producers
 paper mills                                      smallest possible environmental
                                                                                           Oil sands tailings:
 Case:                                            footprint
                                                                                           waste water treatment of oil sands
 Lightweight packaging: with our                  Case:
                                                                                           tailings ponds
 strength chemicals, our customers                Sludge de-watering: with our
 can make their packaging lighter                                                          CEOR:
                                                  chemicals, our customers are able
 yet stronger. Lighter weight results             to reduce the water content in           our chemicals reduce friction and
 in lower logistics cost and thus                 sludge. As a result, demand for          enable a better yield from existing
 environmental footprint.                         logistics is lower resulting in better   wells
                                                  environmental footprint

          JULY 17, 2020   INVESTOR PRESENTATION                                                                                  27
We take use of recycled materials and thus
add circularity to the economy
In 2019, 24% of raw materials
used in Kemira’s global
manufacturing came from
recycled sources or industrial
by-products.                                       WE TREAT THE
                                                   EQUIVALENT OF

70-80% of our inorganic
coagulants come from recycled
sources. These are used to
                                                   375
treat wastewater, drinking                        MILLION PEOPLE’S
                                                   ANNUAL WATER
water, and in many other
industrial water treatment
applications.

          JULY 17, 2020   INVESTOR PRESENTATION                      28
Industry leader in responsibility

                                                                             UN Global Compact:
                                                                             Kemira is a signatory since 2014
                                                                             UN Sustainable Development Goals:
                                                                             Three priority themes for Kemira:
                                                                             • Water (SDG6)
                                                                             • Circular Economy (SDG12)
                                                                             • Climate change (SDG13)

WATER                  CIRCULAR ECONOMY            CLIMATE CHANGE
Enhancing access       Kemira is at the heart of   Ambitious action and
to clean, safe water   enabling the circular       effective solutions for
                       economy                     climate                    B              75/100
                                                                              TOP QUARTILE   TOP 1%

                        JULY 17, 2020       INVESTOR PRESENTATION                                                29
Corporate sustainability performance Q2 2020 1/2
Priority                 KPI+Target                                 Performance                                                           Comments                                                        Progress
                         Product sustainability                                                                                           Four new R&D projects were started in Q2 and two of them
                                                                                                                       53%
                         Share of revenue from products used for                                                                          are planned to improve customer resource efficiency. As of
                                                                                                  51%
                         use-phase resource efficiency. At least                                                                          June 30, seven R&D projects out of total 9 improve customer     AHEAD OF
                                                                                49%
                         50% of Kemira’s revenue generated                                                                                resource efficiency. In many projects material efficiency is     TARGET
                         through products improving customers’                                                                            supported by development of new products from bio-based
Sustainable products
                         resource efficiency.                           Baseline average         2018                  2019               raw materials.
and solutions                                                              2016-2017

                         Workplace safety                                                                                                 Safety performance improved in Q2 and we had one injury
                         Achieve zero injuries on long term;            3.9
                                                                                                                                          free month. Globally in Q2 we had 5 people incidents of
                                                                                     3.5
                         TRIF* 2.0 by end of 2020.                                                                                        which 2 led to lost time. As a result, we are within our
                                                                                                2.1          2.0           2.0            safety target for H1. Human behavior is still one of the
                                                                                                                                                                                                             IN
                                                                                                                                          significant root causes in most of the incidents. By focusing
                                                                                                                                                                                                          PROGRESS
                                                                                                                                          on continuous improvement in people behavior and
                                                                       2017         2018       2019        H1 2020     Target
                                                                                                                        2020
                                                                                                                                          working environment we will try to avoid these types of
                                                                                                                                          incidents.

                         Climate change                                                                                                   Kemira´s new 2030 climate change target and internal
                                                                              100               98.6
                         Reduce by 30% combined Scope 1 and                                                                               carbon pricing program were launched at a high level in Q1
Responsible              Scope 2 GHG emission across the
                                                                                                                       70
                                                                                                                                          2020. During Q2 detailed action planning has continued             IN
operations and supply    whole company by 2030 compared to                                                                                such as revising our logistics emissions accounting and         PROGRESS
chain                    2018 baseline (0.93 MTCO2eq).                                                                                    identifying reduction options.
                         Ambition to be carbon neutral by 2045.             2018                2019               Target 2030

                         Supplier Management                                                                                              During the first half of the year we assessed 37 suppliers
                         % of direct key suppliers screened                                                           90%
                                                                                                                                          with an average score of 50/100 which represents top 50%
                                                                     100%                                                         50
                         through sustainability assessments and                     69%           74%                                     percentile of all thousands of assessed suppliers across
                                                                     80%                                                          40
                         audits (cumulative %). The target           60%                                                          30
                                                                                                                                          various industries on the Sustainability platform. Additional      IN
                                                                                                                      25
                         includes 5 sustainability audits for                                         18                                  30 suppliers of Kemira have been invited. No on-site CSR
                                                                     40%            11                                            20                                                                      PROGRESS
                         highest risk** suppliers every year, and    20%                                                          10      audits were conducted mainly due to COVID-19.
                                                                      0%                                                          0
                         cumulatively 25 by 2020.                             Baseline 2018       2019             Target 2020

                                                                                    % of key suppliers             # of audits (cumul.)

                 JULY 17, 2020        INVESTOR PRESENTATION                                * TRIF = Number of Total Recordable Injury Frequency per million hours, Kemira + contractor, year-to-date                 30
                                                                                           ** Suppliers with lowest sustainability assessment score
Corporate sustainability performance Q2 2020 2/2
                                                                                                                                                                                          Progress
Priority         KPI+target                                  Performance                                                   Comments
                 Employee engagement index based on                                                                        Continued to embed our new continuous feedback and
                                                                     79
                 MyVoice survey                                                                                            listening model by taking action on results.
                                                                               73
                 The index at or above the external
                 industry norm.                                                                        67                  Employee pulse surveys on “MyWorkspace” in March and                IN
                                                                                                                           “MyRemote working during Covid-19” in June targeting over        PROGRESS
                                                                                                                           3,000 employees. Acting on these results have greatly
                                                                     Engagement                        Participation
                                                                                                                           supported our ways of working during Covid-19
                                                                               2019              Target

People and
                 Leadership development activities                                                                         During 2020 we are experimenting with more digital
integrity        provided, average                                                     1,533
                                                                                                   1,839
                                                                                                                1,500      learning. In Q2 we have been working with leaders and
                 Two leadership development activities                     1,036                                           employees supporting them during Covid-19 and in the
                 per people manager position during                                                                        adoption of remote working and virtual learning.                 AHEAD OF
                                                               494
                 2016-2020, the cumulative target is 1,500                                                                                                                                   TARGET
                 by 2020.
                                                              2016         2017        2018         2019     Target 2020

                 Integrity index                                                    87%                                    Integrity has been measured in the past using the biannual
                 KPI to measure compliance with the                                                                        Voices@Kemira survey. The last such survey was in 2018,
                 Kemira Code of Conduct. The target is to                                        84%                       and our result was high at 87%. This was 10% above the              IN
                 maintain the Integrity Index level above                                                                  external industry norm. Integrity will be measured using our     PROGRESS
                 industry benchmark of 77%.                                               2018                             new MyVoice survey in 2020.
                                                                          Integrity Index          Participation

             JULY 17, 2020       INVESTOR PRESENTATION                                                                                                                                                 31
INVESTOR PRESENTATION

Pulp & Paper –
driving growth
as market
leader
       JULY 17, 2020   INVESTOR PRESENTATION   32
Pulp & Paper chemicals market estimated
to grow 1-2%
REVENUE AND OPERATIVE EBITDA                                            • Pulp & Paper chemicals market drivers
EUR million
                                               1,520       1,523          – Hardwood and softwood pulp demand increasing
     1,417          1,457        1,477
                                                                            driven by growth of packaging needs (e-commerce,
                                                            218             non-plastic solutions), growing tissue demand and
                    195          198            192
     171                                                                    lack of recycled fiber
                                                                          – Demand increase continues for packaging, driven
                                                                            by online shopping, last-mile delivery, product
     2015           2016         2017          2018        2019             safety and non-plastic solutions

REVENUE BY CUSTOMER TYPE                                                  – Growth in tissue demand driven by increasing
                                                       ◼ 20%                wealth in emerging countries
                                                       Printing &
                             ◼ 40%                     writing papers     – Ongoing digitalization of media drives decline of
 ◼ 40%                       Board & tissue                                 graphic paper demand
 Pulp
                                                                        • Growth areas, pulp and board & tissue,
                                                                          represent over 80% of our Pulp & Paper
 Market
             1-2%               2-3%                     -1-2%
                                                                          revenue
 growth
                                                                          – Ongoing capacity additions suit well for the need of
                                                                            growing demand
             JULY 17, 2020     INVESTOR PRESENTATION                                                                               33
Strong demand in pulp market creating
growth opportunities
New pulp mill projects are driven by increasing demand
                                                                    Confirmed new capacity /
for tissue and board                                                debottlenecking 2016-2020
• Main bleached pulp demand growth globally from tissue             Possible new mills 2021-2024

• Food and liquid packaging board is growing particularly fast in      BCTMP                                    Kemijärvi
  Asia                                                                                                      Kemi
                                                                    New applications          Skellefteå
• Pulp is produced close to fiber sources and then shipped to
                                                                                                           Kaskinen             Vologda
  board, paper, and tissue mills or used captively in an                                   Östrand          Äänekoski
  integrated mill                                                                                                                   Kama
                                                                                                               Kuusankoski
• Growth of bleached pulp = 1 new pulp mill per year                                                                            Sveza
                                                                                                              Viljandi/Tartto
                                                                                           Värobacka
                                                                                                                                   Bratsk ->
Multiple pulp mill projects realised and expected in
Northern Europe creating opportunities for Kemira to                                                                            Uts-Ilimsk ->

grow with the market                                                                                               Dobrush

                                                                                                           Svetlogorsk
In addition, a few large scale pulp mill projects expected
in South America, and new applications outside traditional
                                                                                           Steti
Pulp&Paper (e.g. car battery manufacturing)

            JULY 17, 2020   INVESTOR PRESENTATION                                                                                               34
Pulp & Paper
TECHNOLOGY AND MARKET LEADER

RAW                                                                                                       CUSTOMER
                                 INTERMEDIATES             PRODUCTS                 APPLICATIONS                          CUSTOMERS
MATERIALS                                                                                                 INDUSTRIES

  Electricity                      Tall oil rosin              Sodium chlorate        Pulping               Pulp           All the major global
  Sodium chloride                  AKD Wax                     Hydrogen peroxide      Bleaching             Packaging      paper
  (salt)                                                                                                    and board      and pulp producers
                                   Isomerized olefins          Polymers               Retention
  Crude tall oil                   Acrylamide                                                               Printing
                                                               Defoamers              Wet-end process
                                                                                                            and writing
  Cationic monomer                                                                    control
                                                               Coagulants
                                                                                                            Tissue
  Acrylonitrile                                                Biocides               WQQM
  Acrylic acid                                                                        Sizing
                                                               Sizing
  Olefins                                                                             Strength
                                                               Strength Additives
  Fatty acids                                                                         Surface treatment
                                                               Surface additives
  Maleic anhydride                                                                    Coloring
                                                               Colorants
  Sulfur                                                       Sulfuric acid

 Value chain part covered by Kemira                            MAIN COMPETITORS: Solenis, Nouryon, Ecolab, Kurita, SNF

                 JULY 17, 2020         INVESTOR PRESENTATION                                                                                      35
New AKD wax investment in China fully
operational
• Construction started in 2017, manufacturing facility fully
  operational with positive EBITDA contribution as of Q1 2020
• Produces mainly AKD wax and its key raw material fatty acid
  chloride (FACL)
  – AKD is sizing chemical used in board and paper to
    create resistance against liquid absorption
  – NewCo also plans to produce coagulants for water treatment
• Kemira strengthens its position and secures supply of
  key raw material for AKD wax

                                                                                                         JOINT-VENTURE
   ACQUIRED ASSET FULFILLS OUR KEY CRITERIA FOR ACQUISITIONS:
                                                                                                         Tiancheng with Kemira
   GROWTH – End-products in growing markets              APAC – Enables profitable growth in APAC        holding 80% investment
   SUPPLY – Backward integr. & self-sufficiency (FACL)   SUSTAINABILITY – FACL from renewable material   of around EUR 70
   LOCATION – Close to our existing production           PROFITABILITY – Accretive after ramp-up         million
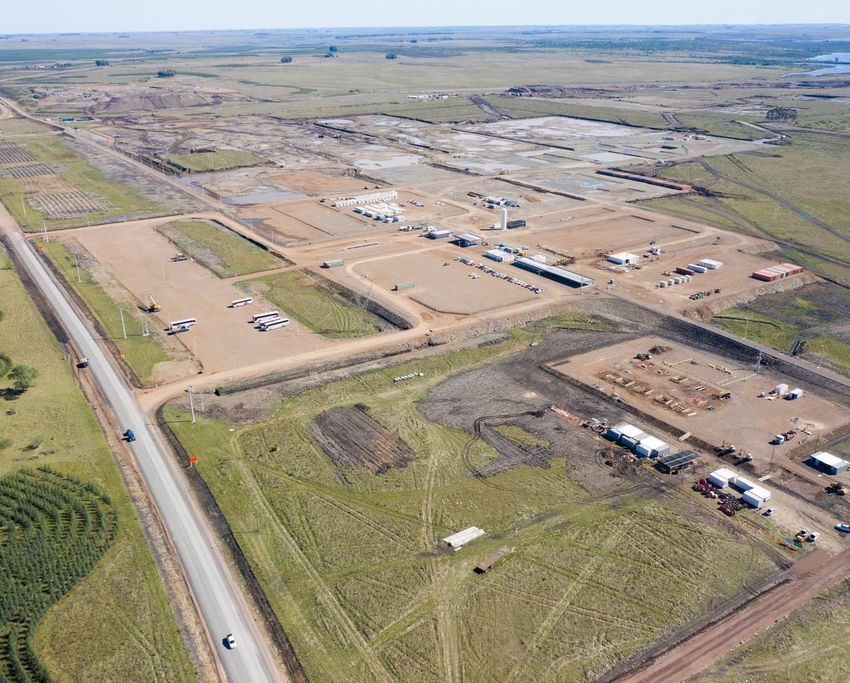
             JULY 17, 2020    INVESTOR PRESENTATION                                                                               36
In May we announced an extension to our
contract with UPM-Kymmene in Uruguay
• Long-term agreement with UPM-Kymmene
  includes capacity to existing Fray Bentos mill as
  well as new 2.1 million ton pulp mill in Paso de
  los Toros.
• Total Kemira investment of around USD 30
  million includes expansion of both sodium
  chlorate and hydrogen peroxide at the existing
  Fray Bentos chemical island site
• The extension will support our long-term growth
  in bleaching, one of our strategic focus areas
• Financial contribution expected as of 2023

                                                      Image copyright: UPM-Kymmene

          JULY 17, 2020   INVESTOR PRESENTATION                                      37
INVESTOR PRESENTATION

Industry & Water -
stronger platform
for profitable
growth
       JULY 17, 2020   INVESTOR PRESENTATION   38
Industry & Water relevant chemicals market
estimated to grow 3-4%
REVENUE AND OPERATIVE EBITDA                                                            • Demand for water treatment chemicals expected
EUR million
                                          1,009             1,073            1,136        to increase due to
         956
                          906                                                 192         – Higher demand for water driven by industrial growth
                                                             131                            and population growth
         116              107              114
                                                                                          – More stringent discharge limits for waste water
        2015             2016              2017             2018             2019         – Better dewatering of sludge
2015-2016 figures are pro forma; combination of Municipal & Industrial and
Oil & Mining segments                                                                     – Phosphorus recovery
                                                                                          – Water reuse
REVENUE BY APPLICATION
                                                               ◼ 25%
                                                                               ◼ 10%    • Higher demand for Oil & Gas solutions expected
                                                                               Other
  ◼ 65%                                                        Oil & Gas
                                                                                          – Shale friction reducer market expected to grow due
  Water treatment
                                                                                            to higher energy demand and increasing number of
                                                                                            wells fracked
                                                                                          – Oil sands operators face regulatory requirements for
  Market
  growth
                  2-3%                                          5-6%             2-3%       their tailings treatment
                                                                                          – Chemical Enhanced Oil Recovery lucrative in certain
                                                                                            fields due to better yield from existing reservoirs
                   JULY 17, 2020        INVESTOR PRESENTATION                                                                                      39
Industry & Water
TECHNOLOGY AND MARKET LEADER IN WATER TREATMENT AS WELL
AS IN NICHE APPLICATIONS IN OIL & GAS

RAW
                              INTERMEDIATES             PRODUCTS                 APPLICATIONS               SALES CHANNELS           CUSTOMERS
MATERIALS

  Acrylonitrile                   Acrylamide                 Polymers               Raw water & waste         Direct sales            Municipalities
                                                             (EPAM, DPAM)           water treatment
  Acrylic acid                    Cationic monomer                                                            Distributor/reseller    Private operators
                                                             Al Coagulants          Sludge treatment
  Sulfuric acid                                                                                               Service companies       Industrial customers
                                                             Fe Coagulants          Friction reduction
  Hydrochloric acid                                                                                                                   Pumpers
                                                             Dispersants &          Enhanced oil recovery
  Aluminium hydrate                                                                                                                   Oil & Gas operators
                                                             antiscalants           Tailings treatment
  Iron ore                                                                                                                            Service companies
                                                             Biocides               Mining processes
  Pickling liquor                                                                                                                     Mine operators
                                                             Emulsifiers
  Copperas
                                                             Defoamers
  Various monomers
                                                             Formulations

                                                     MAIN COMPETITORS
 Value chain part covered by Kemira                  Coagulants: mainly local small companies, Feralco, USALCO, Kronos, PVS,
                                                     Polymers: SNF, Solvay, Ecolab, Solenis
                  JULY 17, 2020      INVESTOR PRESENTATION                                                                                                   40
Kemira is a market leader in water
treatment chemistry
Serving most European cities

Drinking water plants and wastewater plants

   • No of ship-to countries ~ 80

   • No of ship-to points ~ 9 000

   • No of ship-from points ~ 30-40

                                                I&W EMEA customer locations. Dot size
                                                correlates with ship-to volumes.

                                                Not representative for Eastern Europe due to
                                                roll-out of Kemira ERP system.
        JULY 17, 2020   INVESTOR PRESENTATION                                                  41
Kemira’s
six actions
                                                  1.   The requirements of the Urban Wastewater
                                                       Treatment Directive (UWWTD) must be
                                                       implemented fully and equally in all member
                                                       states.

for cleaner                                       2.

                                                  3.
                                                       Emission limit values (especially phosphorus) in
                                                       water discharges should be tightened.
                                                       Digitalization can improve both the quality

waters                                            4.
                                                       of monitoring and the cost efficiency of water
                                                       treatment.
                                                       Emerging pollutants need to be included
IN EMEA                                                in the legislation.
                                                  5.   Pollution from storm-water overflows must be
                                                       limited and discharges safely disinfected.
                                                  6.   Clearer guidance is needed on applying
                                                       innovation and sustainability criteria in public
                                                       procurement for water treatment.

          JULY 17, 2020   INVESTOR PRESENTATION                                                           42
Implementation of wastewater treatment
directive varies in EU
• There are significant                      Degree of compliance in water discharges*
  implementation gaps of the                 % of subjected load
  Urban Wastewater                                                                                  2010       2012        2014
  Treatment Directive, even                  100
                                              90
  though the first collection                 80
  and treatment                               70
                                              60
  requirements                                50
  of the Directive already                    40
                                              30
  entered into force in 2001                  20
                                              10
                                               0

                                                             Romania
                                                                Austria

                                                      Czech Republic

                                                                France

                                                              Hungary
                                                               Croatia

                                                             Denmark
                                                               Cyprus

                                                               Estonia

                                                            Germany

                                                                  Malta

                                                                Poland

                                                             Slovenia

                                                              Sweden
                                                                Ireland
                                                                   Italy
                                                                 Latvia

                                                              Slovakia

                                                                  Spain
                                                              Belgium

                                                               Finland

                                                               Greece

                                                             Lithuania
                                                         Luxembourg
                                                              Bulgaria

                                                          Netherlands

                                                              Portugal

                                                      United Kingdom
                                           * Degree of compliance with Article 5 of the Directive, which sets the requirements for water discharges to sensitive areas.
                                           Source: European Commission, 9th report on the implementation status concerning urban waste water treatment.

         JULY 17, 2020   INVESTOR PRESENTATION                                                                                                                            43
Oil & Gas expected to grow in the long-term

REVENUE IN OIL & GAS                                                                       Long-term market growth opportunities with
EUR million                                                                                Kemira’s selective market diversification
 350
 300
 250
                                                                                           Kemira’s offering
 200
 150                                                                                       • Process efficiencies: polymers that reduce
 100
  50
                                                                                             energy consumption by 60% in shale oil fields
   0
        2013       2014        2015       2016      2017       2018          2019          • Cost reduction: higher concentrated liquids that
                                                                                             make offshore oil recovery more cost effective
                                                                                             (CEOR)
REVENUE SPLIT
                                                                                           • Addressing environmental regulations: tailing
◼ 10%                                                         ◼ 55%                          treatment in oil sands
Other                                                         Shale fracking
                                                                                           New innovative technologies driving
◼ 35%                                                                                      expansion
Oil sands and
Chemical Enhanced
Oil Recovery                                               Figures rounded to closest 5%

               JULY 17, 2020          INVESTOR PRESENTATION                                                                                     44
We have diversified our Oil & Gas business
since the last oil downturn
Revenue split 2019                         Revenue split 2015
         ◼ 10%
         Other                                  ◼ 35%
                                                Other

 ◼ 35%                    ◼ 55%             ◼ 5%                  ◼ 60%
 Oil sands                Shale fracking    Oil sands             Shale fracking
 and                                        and
 Chemical                                   Chemical
 Enhanced Oil                               Enhanced Oil
 Recovery                                   Recovery

We have prepared for the shale market downturn
  •   Diversification of business to include oil sands
      tailings and CEOR*
  •   Action taken to optimize current Oil & Gas
      organization to the prevailing market situation

                                           *chemical enhanced oil recovery

                 JULY 17, 2020       INVESTOR PRESENTATION                         45
Our polymer investment in the Netherlands
is ramping up
▪ EUR 30 million polymer capacity addition announced
  in October 2017. Facility ramping up with positive
  EBITDA contribution as of Q1 2020
▪ Manufacturing facility to serve Chemical Enhanced Oil
  Recovery customer with non-liquid polymers
▪ Long-term contract with Ithaca
▪ CEOR market size approximately EUR 1 billion of
  which EUR 500 million accessible to Kemira
▪ Market growth estimated to be around 5% driven by       CEOR (CHEMICAL ENHANCED
  enhanced production from existing fields                OIL RECOVERY)
                                                          WITH POLYMER FLOODING, OUR
                                                          CUSTOMERS CAN IMPROVE THE
                                                          RECOVERY OF OIL AND EXTEND
                                                          FIELD LIFETIME
         JULY 17, 2020   INVESTOR PRESENTATION                                         46
INVESTOR PRESENTATION

Latest
news and
financials
       JULY 17, 2020   INVESTOR PRESENTATION   47
Summary of Q2 2020

• Impact of COVID-19 on operations remained
  limited – no significant disruptions to manufacturing
  operations or supply chain
• Revenue impacted by COVID-19 related economic
  slowdown
• Profitability remained strong: operative EBITDA
  105.7 MEUR with margin improving to 18.1%
• Long-term extension to contract with UPM-
  Kymmene in Uruguay
• Outlook for H2 2020 provided

          JULY 17, 2020   INVESTOR PRESENTATION           48
Update on COVID-19 and related economic
slowdown’s impacts on Kemira
IMPACT SO FAR
•  In countries with government-imposed restrictions on economic activity, chemical
   industry and our customer industries almost always classified as essential
   industries to the society
•  No significant disruptions in Kemira’s manufacturing facilities or supply chain in Q2

ACTIONS TAKEN
•  Regional crisis management teams implemented to mitigate impact and to ensure
   business continuity
•  Conservative overall approach to ensure employee health and safety. Strict travel
   restrictions still in place
•  Restructuring of Oil & Gas business to better meet current market conditions

EXPECTED IMPACTS
•  Final impact on customer demand will depend on the length of pandemic and
   speed of recovery. Potential second wave of infections could create further             MAJORITY OF KEMIRA’S
   uncertainty. Demand in shale expected to remain low in 2020.                            PRODUCTS ARE CONSUMABLE IN
•  If situation worsens, impacts and disruption on Kemira’s manufacturing and supply       NATURE AND TYPICALLY LESS
   chain are possible                                                                      PRONE TO ECONOMIC CYCLES

            JULY 17, 2020   INVESTOR PRESENTATION                                                                       49
Financial highlights Q2 2020
                                                      EUR million                            Q2             Q2 Δ%                   H1             H1 Δ%                  FY
Organic revenue growth -12%                                                                2020           2019                    2020           2019                   2019
                                                      (except ratios)
• Demand lower due to COVID-19 related economic
  slowdown                                            Revenue                             582.9          663.6 -12 1,224.9 1,311.4                             -7 2,658.8

                                                      Operative EBITDA                    105.7          106.1           0       214.2          201.8         +6       410.0
Operative EBITDA stable, strong margin of 18.1%
                                                        of which margin                  18.1% 16.0%                      -     17.5% 15.4%                      -    15.4%
• Stable EBITDA supported by lower variable costs,
  including raw materials and efficiencies from new   Operative EBIT                        57.6           60.3         -4       118.4          110.4         +7       224.0
  investments in China and the Netherlands
• Good fixed cost management                            of which margin                    9.9%           9.1%            -       9.7%          8.4%             -      8.4%

                                                      Net profit                            35.5           35.2        +1          75.1           64.6 +16             116.5
Earnings per share remained at EUR 0.22
                                                      EPS diluted, EUR                      0.22           0.22        +1          0.47           0.40 +16               0.72

                                                      Cash flow from
Strong cash flow from operating activities                                                  60.8           57.2        +6        111.0 122.4*                  -9      386.2
                                                      operating activities

                                                         *Comparison period included EUR 15 million return of excess capital from Kemira’s supplementary pension fund in Finland.
           JULY 17, 2020   INVESTOR PRESENTATION                                                                                                                               50
Pulp & Paper – fairly resilient customer
demand apart from printing & writing
                                                         REVENUE AND ORGANIC REVENUE GROWTH (Y-ON-Y)
Market environment                                       EUR million
•   Fairly resilient demand in pulp, board and tissue     369   376     385      390    381    373
                                                                                                        383        386     378
                                                                                                                                    357
•   Demand in printing and writing chemicals declined                   +7%
                                                          +5%   +6%
    due to COVID-19 related economic slowdown                                    +4%
                                                                                        +0%
Organic growth -4% in Q2 2020                                                                  -3%      -3%        -3%     -1%      -4%

• Economic slowdown impacted volumes; revenue for         Q1    Q2       Q3      Q4     Q1     Q2        Q3        Q4      Q1          Q2
  printing & writing products declined by 12% with the
                                                                  2018                            2019                         2020
  biggest impact in North America
                                                         OPERATIVE EBITDA AND OPERATIVE EBITDA-%
Strong operative EBITDA margin of 18.4% in Q2 2020 EUR million                                                                     18.4%
                                                                                                       16.0%              15.9%
• Improved profitability due to lower variable costs and               13.6% 13.1% 13.3% 14.4%                    13.6%
                                                         11.6% 12.1%                                    61.3                        65.6
   good fixed cost management. Efficiency                               52.3     51.2          53.7                52.6
                                                                                                                           60.2
                                                                                        50.7
   improvements from the AKD wax investment in China      42.7  45.4
   continued to contribute positively.

                                                          Q1    Q2          Q3   Q4     Q1*    Q2*      Q3*        Q4*     Q1*         Q2*
                                                                     2018                            2019                        2020
             JULY 17, 2020   INVESTOR PRESENTATION                                                                                           51
                                                                                                            * Includes IFRS16 impact
Industry & Water supported by resilience of
water treatment
                                                         REVENUE AND ORGANIC REVENUE GROWTH (Y-ON-Y)
                                                         EUR million
Market environment                                                                                 290      307
                                                                    272     284    271     267                         272
                                                           245                                                                 264
•   Municipal water treatment market remained rather                                                                                   226
    stable; industrial water treatment market impacted             +14%
                                                           +11%             +11%
    by economic uncertainty                                                                                 +6%
                                                                                           +5%
                                                                                                   +4%
•   Demand in Oil & Gas very weak                                                  +2%                                 -1%     -1%     -22%

Organic growth -22% in Q2 2020                              Q1      Q2       Q3     Q4     Q1       Q2      Q3         Q4      Q1      Q2
•   Revenue in Oil & Gas declined by 65%. Lower                          2018                            2019                       2020
    revenue in water treatment following economic        OPERATIVE EBITDA AND OPERATIVE EBITDA-%
    slowdown.                                            EUR million
                                                                                                  18.1% 18.5%                18.3% 17.7%
Operative EBITDA margin 17.7% in Q2 2020                                                  16.8%
                                                                   12.8% 12.9% 12.3%                       56.8     13.8%
                                                                                                  52.4
• Profitability supported by lower variable costs and      10.9%                          45.0                               48.2
                                                                           36.7                                      37.5            40.0
  good fixed cost management. Improved cost                        34.8            33.3
                                                           26.6
  position and higher capacity from the polymer
  expansion in the Netherlands also supported
  operative EBITDA.
                                                           Q1       Q2      Q3     Q4     Q1*     Q2*      Q3*       Q4*     Q1*      Q2*
             JULY 17, 2020   INVESTOR PRESENTATION                    2018                           2019                       2020          52
                                                                                                                * Includes IFRS16 impact
Oil & Gas – revenue declined by 65% due to
    a challenging market environment
Shale                                                       REVENUE DEVELOPMENT
                                                            EUR million
•   Shale market activity at a near standstill despite
    rebound in oil price from market lows. No recovery in                                   77      87
                                                                         73
                                                                               66    62                     66
    shale market demand expected yet in 2020.                      56                                                52
                                                             46
•   Kemira shale revenue very low in Q2                                                                                      27

Oil sands tailings treatment
                                                            Q1    Q2     Q3    Q4    Q1     Q2      Q3      Q4      Q1       Q2
•   Kemira’s end market demand in 2020 clearly lower
    than expected                                                    2018                      2019                    2020

•   Longer term outlook in oil sands tailings treatment
    remains solid
CEOR*                                                       Oil & Gas business restructured during Q2 to better meet
                                                            lower market demand. Restructuring expenses of EUR 1.9
•   Kemira’s end market remained solid in Q2; by nature     million booked in Q2 2020.
    business decisions made with long-term horizon

                                                                                     *CEOR, chemical enhanced oil recovery

             JULY 17, 2020   INVESTOR PRESENTATION                                                                                53
Focus on safety and business continuity in
the short-term
•   Mitigate impact from COVID-19 and oil demand
    drop and ensure our own and our customers’
    business continuity. Ensure health and safety of
    employees and other stakeholders.
•   Gradual return to normality in our operations
    following local government recommendations
•   Focus on cost management while volumes remain
    depressed
•   Realize benefits of added capacity in China, the
    Netherlands and the U.S
•   Construction of polymer capacity in the U.S. and
    South Korea as well as expansion of bleaching
    capacity in Uruguay

           JULY 17, 2020   INVESTOR PRESENTATION       54
Good profitability despite lower volumes
Q2/2020

REVENUE AND ORGANIC GROWTH (Y-ON-Y)                                                         Organic revenue growth -12%
EUR million
                                                                                            •    Volumes impacted by COVID-19 related
    664           -11%                                                                           economic slowdown, particularly in shale
                                  -1%        -1%             -0%             583
                                                                                            Operative EBITDA margin 18.1%
                                                                                            • Operative EBITDA stable despite lower volumes.
                                                                                              Favorable variable cost development and good
                                                                                              fixed cost management. Efficiencies from
  Q2 2019          Sales        Sales      Currency       Acquisitions   Q2 2020
                  volumes       prices      impact             &
                                                                                              investments in China and the Netherlands
                                                          Divestments                         continued to have a positive EBITDA
                                                                                              contribution.
OPERATIVE EBITDA BRIDGE
EUR million

          106.1               -25.0                                  +20.0          +11.0                                        105.7
                                                                                                      -1.0          -1.5
                                                -4.0

           Q2            Sales volumes      Sales prices         Variable costs    Fixed costs       Currency      Other          Q2
          2019                                                                                        impact                     2020
              JULY 17, 2020       INVESTOR PRESENTATION                                                                                        55
Impact from variable costs continued to be
positive
SALES PRICE VS VARIABLE COST TREND                                                SALES PRICES AND VARIABLE COSTS
(ROLLING 12-MONTH CHANGE Y-O-Y)                                                   (CHANGE Y-O-Y)
   EUR million                                                                    EUR million
   180
                                                                                                                                       47
                                                                                                                                            42
                                                                                                                                                 37
   120                                                                                                                                                34
                                                                                                                                                                32
                                                                                                                                  26        38             28        28
                                                                                                                                       36                                 25
    60                                                                                                           16          13                  29   24                        16
                                                                                   9                                   13         23   11        8         23
                                                                                         5                                                  4                   19
                                                                                                                                                      11             14
      0                                                                                                                      11
                                                                                  -9                                    3
                                                                                        -18     -3 -10 0         -4
                                                                                                                             -2 -2
                                                                                                                                                           -5
                                                                                                                                                                          0
                                                                                                                                                                                -4
   -60                                                                                         -23   -13               -10
                                                                                                                                                                -13 -14
                                                                                  -18                      -16
                                                                                         -23
                                                                                                                 -20                                                            -20
                                                                                                     -23                                                                  -25
  -120                                                                                         -26         -16

                                                                                  Q1 Q2 Q3 Q4 Q1 Q2 Q3 Q4 Q1 Q2 Q3 Q4 Q1 Q2 Q3 Q4 Q1 Q2
  -180
          2008200920102011201220132014201520162017201820192020                            2016                    2017                  2018               2019            2020
                                                                                                     Net impact on EBITDA (sales prices-variable costs)
               Brent oil, USD               Sales prices*       Variable costs*                      Sales prices
                                                                                                     Variable costs
* 12-month rolling change vs previous year in EUR million

                     JULY 17, 2020           INVESTOR PRESENTATION                                                                                                                    56
Solid cash flow
ALL KEY FIGURES IN EUR MILLION

CASH FLOW FROM OPERATIONS
                                          386                                        •   Q2 cash flow from operations strong at EUR 60.8
                                                                                         million. January-June 2019 period included EUR 15
                                          143                                            million return of excess capital from Kemira’s
Q4
      205              210                                                               supplementary Pension Fund in Finland.
Q3    71                88                121
                                                         122             111
Q2    93                64
                                                                                     •   Typically cash flow is H2-weighted, especially due to
                                           57
Q1    29
                                 23        65
                                                                                         changes in net working capital
            12          35
     2017             2018               2019          1-6 2019        1-6 2020

CAPITAL EXPENDITURE EXCL. ACQUISITIONS

      190                                201                                         •   Capex estimated to be around EUR 200 million in 2020:
                      150
      66                                 98                                              – New polymer capacity expansion in the U.S.
                       44                       98
      65                                                68
                                                                       80                – Smaller capex projects in several locations
                       53                39     39                              37
                                                                34
      59               53                65     65              15              16
                                                                19              27
     2017            2018               2019         1-6 2019        1-6 2020

            Expansion                 Improvement        Maintenance

                 JULY 17, 2020          INVESTOR PRESENTATION                                                                                    57
Capital efficiency improvement
OPERATIVE RETURN ON CAPITAL EMPLOYED (ROCE)
                                          11.2%                             11.6%
                                                             10.8%
                        9.8%
     9.7%                                                                                 •   ROCE improvement driven by Pulp & Paper
                                                                                              profitability improvement
                                                                                          •   On-going investment projects are expected to
                                                                                              improve Group’s ROCE once up and running
      2017              2018               2019         Q2 2019 LTM Q2 2020 LTM

NET DEBT (EUR million) AND LEVERAGE RATIO*
                                                                   921
                                                                                   844
        694                 741
                                               811          786**
                                                                           716**
                                                                                          •   Gearing 70% - well within financial target range of
                                                                                              below 75%
         2.2                2.3                 2.0                  2.5            2.0   •   Average interest rate of net debt excluding leases is
                                                                                              1.8% and duration is 22 months
                                                                                          •   With pre-IFRS 16 net debt figures:
    Dec 31             Dec 31              Dec 31                Jun 30      Jun 30
     2017               2018                2019                  2019        2020              –   gearing 59%
 * Leverage ratio = Net debt / last 12 months operative EBITDA
 ** pre-IFRS 16 figures                                                                         –   leverage ratio 1.9
                 JULY 17, 2020           INVESTOR PRESENTATION                                                                                        58
Outlook for H2 2020
OUTLOOK FOR H2 2020                                                                Assumptions for H2 2020
Operative EBITDA in H2 2020 is expected to be lower
                                                                                   •   Overall demand in Kemira’s end markets in
than in H1 2020 (H1 2020: EUR 214 million).
                                                                                       H2 2020 is expected to be approximately at
                                                                                       Q2 2020 level:
                                                                                        • Pulp & Paper: demand to remain
                                                                                            approximately at Q2 2020 level. Printing
                                                                                            & writing to remain weak.
EUR million 2016                2017    2018         2019   H1 2020   H2 2020
                                                                      outlook             •    Industry & Water: demand to remain
Operative            303         311      323         410     214     Lower                    approximately at Q2 2020 level. No
EBITDA                                                                than H1                  recovery in shale market expected in
                                                                      2020                     2020.
Operative EBITDA figures for 2014-2018 are ”pre IFRS-16”.

                                                                                   •   No major disruption to manufacturing
                                                                                       operations or supply chain.

                                                                                Kemira’s previous outlook
                                                                                Kemira withdrew its outlook for 2020 on April 27, 2020 following the
                                                                                uncertainty related to the COVID-19 pandemic and oil price drop.
                JULY 17, 2020       INVESTOR PRESENTATION                                                                                              59
Kemira has a diversified financing base
                                                                                  GROSS DEBT END OF JUNE 2020 EUR 977 MILLION,

                  13%                                                             MATURITY PROFILE EXCLUDING LEASES

                  Leases
                                                                                                                                               400
                  128 million                                               450

                                                          36%               400

18%                                                       Bond
                                                          EUR 350 million
                                                                            350

                                                                            300
Other
EUR 175 million                                                             250      217
                                                                                                                                  200
                                                                            200
                                                                                                            150            156
                                                                            150                                                          130

                                                                            100

     33%                                                                     50
                                                                                                  2
      Loans from banks and                                                    0
      financial institutions                                                        2020        2021        2022           2023   2024   2025
      EUR 330 million
                                                                                  Bilaterals   Bonds       Others
                                                                                  Undrawn RCF, extended to 2025 in April

                  JULY 17, 2020   INVESTOR PRESENTATION                                                                                              60
Majority of contracts with fixed annual
pricing
Pulp & Paper – Contract types and pricing terms on high
level
  • Length – Around 95% of contracts are 1-year or
    longer / only 5% are spot deals
  • Pricing – Around 70% fixed / 30% formula or spot
    pricing

Industry & Water – Contract types and pricing terms
  • Length – Around 70% of contracts are 1-yr or longer
    / 30% spot deals
  • Pricing – Around 70% fixed / 30% formula or spot
    pricing, incl. Oil & Gas where contracts are either
    formula or spot based

         JULY 17, 2020   INVESTOR PRESENTATION            61
Kemira’s variable cost split and top raw
materials
VARIABLE COST SPLIT 2019                           EXPOSURE TO OIL RELATED         TOP 12 RAW MATERIALS
EUR 1.5 billion                                    RAW MATERIALS                   BY SPEND (around 50% of total
                                                                                   raw material spend)
                                                   ◼ 65%               ◼ 35%       1.   Sodium hydroxide (caustic soda)*
◼ 15%                                              Not oil             Oil & gas   2.   Acrylonitrile (OD)
Logistics                                          related             related
                                                                                   3.   Petroleum solvents (OD)
◼ 15%                                                                              4.   Aluminium Hydrate
Electricity & energy
                                                                                   5.   Colloidal silica dispersion*
                                                                                   6.   Acrylic Acid (OD)
                                                                                   7.   Amines (OD)
                                                                                   8.   Alpha olefin (OD)
                                                                                   9.   Sodium chloride (salt)
                                                                                   10. Sulphuric acid
                                                                                   11. Acrylic ester (OD)
◼ 70%                                                                              12. Fatty acid
Raw materials
                                                                                   Top 12 account for 52% of Kemira’s raw
                                                                                   material spend
Figures rounded to the nearest 5%
                                                                                   OD = Oil & gas derivative
                JULY 17, 2020   INVESTOR PRESENTATION                              * Mainly trading materials               62
KEMIRA CAPITAL
MARKETS DAY 2020

Save the Date:
November 19, 2020
INVESTOR PRESENTATION

Appendix

       JULY 17, 2020   INVESTOR PRESENTATION   64
Key figures
EUR million                                Q2 2020         Q1 2020    Q4 2019   Q3 2019   Q2 2019     2019      2018
Revenue                                            582.9     642.0      657.7     689.8     663.6   2,658.8   2,592.8
Operative EBITDA                                   105.7     108.5       90.1     118.1     106.1    410.0     323.1
  margin                                       18.1%         16.9%      13.7%     17.1%     16.0%    15.4%     12.5%
Operative EBIT                                      57.6      60.8       42.4      71.1      60.3    224.0     173.8
  margin                                           9.9%       9.5 %      6.4%     10.3%      9.1%     8.4%      6.7%
Net profit                                          35.5      39.6        8.6      43.3      35.2    116.5      95.2
Earnings per share, diluted, EUR                    0.22      0.25       0.05      0.27      0.22     0.72      0.58
Cash flow from operations                           60.8      50.2      142.5     121.3      57.2    386.2     210.2
Capex excl. acquisitions                            44.1      36.1       81.4      51.5      39.9    201.1     150.4
Net debt                                            844       816         811      866       921       811       741
NWC ratio (rolling 12 m)                       10.1%         10.2%      10.7%     11.1%     10.9%    10.7%     10.2%
Operative ROCE (rolling 12 m)                      11.6%     11.8%      11.2%     11.5%     10.8%    11.2%      9.8%
Personnel at period-end                            5,106     5,075      5,062     5,036     5,067    5,062     4,915

                 JULY 17, 2020   Q2 2020 RESULTS
                                                                                                                        65
Cash flow
EUR million                                                   Q2 2020   Q2 2019    2019    2018
Net profit for the period                                        36        35     116      95
Total adjustments                                                69        69     302     220
Change in net working capital                                   -31       -22      45      -51
Finance expenses                                                 -7       -17      -39     -30
Income taxes paid                                                -6        -8      -39     -24
Net cash generated from operating activities                     61        57     386     210
Purchases of subsidiaries and business acquisitions, net of       0        -2       -3     -43
cash acquired
Capital expenditure                                             -44       -40     -201    -150
Proceeds from sale of assets                                      0         1       8       7
Change in long-term loan receivables                              0         0       0       5
Cash flow after investing activities                             17        17     190      29

              JULY 17, 2020   Q2 2020 RESULTS
                                                                                             66
Currencies

Currency exchange rates had around EUR +1.6 million impact on revenue and
EUR -1.5 million impact on the operative EBITDA in H1 2020 compared to H1 2019.
Guidance: 10% change in our main foreign currencies would approximately have
EUR 15 million impact on operative EBITDA on an annualized basis.

KEMIRA REVENUE DISTRIBUTION H1 2020                         KEMIRA COST DISTRIBUTION H1 2020
◼ 7% Others                                                 ◼ 5% Others
◼ 2% BRL                                        ◼ 44% EUR   ◼ 2% BRL                      ◼ 49% EUR
◼ 2% SEK                                                    ◼ 2% GBP
◼ 2% GBP                                                    ◼ 3% CAD
◼ 4% CNY                                                    ◼ 4% CNY
◼ 4% CAD                                                    ◼ 3% SEK

◼ 35% USD                                                   ◼ 32% USD

              JULY 17, 2020   INVESTOR PRESENTATION                                                   67
Pulp & Paper
KEY FINANCIALS

EUR million                                     Q2 2020   Q1 2020   Q4 2019   Q3 2019   Q2 2019     2019              2018
Revenue                                           357.0     378.5     385.9     382.9     373.4   1,522.9         1,520.2
Operative EBITDA                                   65.6      60.2      52.6      61.3      53.7    218.3             191.7
margin                                            18.4%     15.9%     13.6%     16.0%     14.4%    14.3%             12.6%
Operative EBIT                                     35.7      30.1      22.5      32.1      24.0     99.2                91.6
margin                                            10.0%      8.0%      5.8%      8.4%      6.4%     6.5%               6.0%
Operative ROCE*, %                                 9.5%      8.5%      7.7%      7.9%      7.6%     7.7%               7.8%
Capital expenditure (excl. M&A)                    21.0      14.3      43.6      25.4      23.3    109.7                85.1
Cash flow after investing                          27.3      26.1      33.5      44.6      36.2    139.4                29.9
activities

                                                                                                      *12-month rolling average
              JULY 17, 2020   Q2 2020 RESULTS
                                                                                                                                  68
Industry & Water
KEY FINANCIALS

EUR million                                     Q2 2020   Q1 2020   Q4 2019   Q3 2019   Q2 2019     2019              2018
Revenue                                           225.9     263.6     271.8     306.9     290.2   1,135.9         1,072.6
Operative EBITDA                                   40.0      48.2      37.5      56.8      52.4    191.7             131.5
margin                                            17.7%     18.3%     13.8%     18.5%     18.1%    16.9%             12.3%
Operative EBIT                                     21.9      30.7      19.9      39.0      36.3    124.7                82.2
margin                                             9.7%     11.7%      7.3%     12.7%     12.5%    11.0%               7.7%
Operative ROCE*, %                                15.5%     17.6%     17.6%     18.4%     16.9%    17.6%             13.6%
Capital expenditure (excl. M&A)                    23.1      21.8      37.8      26.0      16.5     91.4                65.3
Cash flow after investing                           2.3      12.6      57.3      37.9       5.7    128.7                52.5
activities

                                                                                                      *12-month rolling average

              JULY 17, 2020   Q2 2020 RESULTS
                                                                                                                                  69
Key figures and ratios – 5-year summary

EUR million (except ratios)                           2014     2015      2016      2017      2018      2019
Revenue                                         2,136.7      2,373.1   2,363.3   2,486.0   2,592.8   2,658.8
Operative EBITDA                                  252.9       287.3     302.5     311.3     323.1     410.0
 of which margin                                  11.8%       12.1%     12.8%     12.5%     12.5%     15.4%
Operative EBIT                                    158.3       163.1     170.1     170.3     173.8     224.0
 of which margin                                      7.4%     6.9%      7.2%      6.9%      6.7%      8.4%
Cash flow from operations                             74.2    247.6     270.6     205.1     210.2     386.2
Capital expenditure, excluding                                                                        201.1
                                                  140.6       181.7     212.6     190.1     150.4
acq.
Gearing at period-end                                   42       54        54        59        62        66
Inventories                                            197      207       217       224       284       261
Personnel at period-end                           4,248       4,685     4,818     4,732     4,915     5,062

              JULY 17, 2020   INVESTOR PRESENTATION                                                            70
Per share figures – 5-year summary
                                                     2014   2015    2016    2017    2018    2019
Earnings per share, EUR                              0.59    0.47    0.60    0.52    0.58    0.72
Cash flow from operating activities                  0.49    1.63    1.78    1.35    1.38     2.5
per share, EUR
Equity per share, EUR                                7.57    7.76    7.68    7.61    7.80    7.98
Dividend per share, EUR                              0.53    0.53    0.53    0.53    0.53    0.56
Share price, EUR, end of period                      9.89   10.88   12.13   11.50    9.85   13.26
Market capitalization, EUR million               1,504      1,654   1,848   1,752   1,502   2,024
(excl. treasury shares)
Number of shares, million                        152.1      152.1   152.4   152.4   152.4   152.4
(excl. treasury shares)
P/E ratio                                            16.7    23.3    20.1    22.3    17.0    18.4
P/CF ratio                                           20.2     6.7     6.8     8.5     7.1     5.3
P/B ratio                                             1.3     1.4     1.6     1.5     1.3     1.7
Dividend yield, %                                     5.4     4.9     4.4     4.6     5.4     4.2

             JULY 17, 2020   INVESTOR PRESENTATION                                                  71
Revenue split by country
FY 2019

                                                    Other APAC 6%

                                              China 4%

                             Other EMEA 9%                                         USA 27%

                              Norway 1%
                          Netherlands 2%
                              France 2%
                                Italy 2%
                             Russia 2%
                               Spain 2%                                               Canada 7%
                                Poland 2%
                                                                                     Brazil 2%
                                     UK 4%
                                                                                  Uruguay 2%
                                     Germany 4%                              Other Americas 2%
                                              Sweden 5%
                                                                    Finland 15%

          JULY 17, 2020     INVESTOR PRESENTATION                                                 72
Kemira – largest shareholders and
Board of Directors
SHAREHOLDERS ON JUNE 30, 2020                                     KEMIRA BOARD OF DIRECTORS

                                                                           JARI PAASIKIVI
% OF SHARES
                                                                           Chairman
1. Oras Invest                                           20.1%             Member since 2012
                                                                           Oras Invest Oy, CEO
2. Solidium (owned by State of Finland)                  10.2%
3. Varma Mutual Pension Insurance Company                 3.0%             KERTTU                WOLFGANG
                                                                           TUOMAS                BÜCHELE
4. Ilmarinen Mutual Pension Insurance Comp.               2.6%             Vice Chairman         Member in
                                                                           Member                2009-2012 and
5. Kemira Oyj                                             1.6%             since 2010            since 2014
Total number of shares                              155,342,557            SHIRLEY               KAISA
                                                                           CUNNINGHAM            HIETALA
Foreign ownership of shares                              28.3%             Member                Member
                                                                           since 2017            since 2016
Total number of shareholders                            39,607

                                                                           TIMO
                                                                           LAPPALAINEN
                                                                           Member since
                                                                           2014

            JULY 17, 2020   INVESTOR PRESENTATION                                                                73
Kemira’s Management Board
                     JARI ROSENDAL
                     President and CEO
                     With Kemira since 2014

                     KIM POULSEN                                         PETRI CASTRÉN                                       ESA-MATTI PUPUTTI
                     President                                           CFO                                                 EVP, Operational
                     Pulp & Paper                                        With Kemira since 2013                              Excellence
                     With Kemira since 2015                                                                                  With Kemira since 2015

                     ANTTI SALMINEN                                      MATTHEW PIXTON                                      EEVA SALONEN
                     President                                           CTO                                                 EVP, Human Resources
                     Industry & Water                                    With Kemira since 2016                              With Kemira since 2008
                     With Kemira since 2011

Jukka Hakkila, Chief Legal Officer, (with Kemira since 2005) acts as secretary of Management Board and Board of Directors.

               JULY 17, 2020     INVESTOR PRESENTATION                                                                                                74
Important information about financial
figures
Kemira provides certain financial performance measures (alternative performance measures)
on non-GAAP basis. Kemira believes that alternative performance measures, such as organic
growth*, EBITDA, operative EBITDA, cash flow after investing activities, and gearing followed
by capital markets and Kemira management, provide useful information of its comparable
business performance and financial position. Selected alternative performance measures are
also used as performance criteria in remuneration.
Kemira’s alternative performance measures should not be viewed in isolation to the
equivalent IFRS measures and alternative performance measures should be read in
conjunction with the most directly comparable IFRS measures. Definitions of the alternative
performance measures can be found in the Definitions of the key figures in this report, as well
as at www.kemira.com > Investors > Financial information.
All the figures in this interim report have been individually rounded and consequently the sum
of individual figures may deviate slightly from the sum figure presented.
* Revenue growth in local currencies, excluding acquisitions and divestments

               JULY 17, 2020     INVESTOR PRESENTATION                                            75
You can also read