2021 RESULTS PRESENTATION - TFG Limited
←
→
Page content transcription
If your browser does not render page correctly, please read the page content below
2021
     RESULTS                  HALF-
PRESENTATION                  YEAR
   FOR THE HALF-YEAR ENDED
          30 SEPTEMBER 2020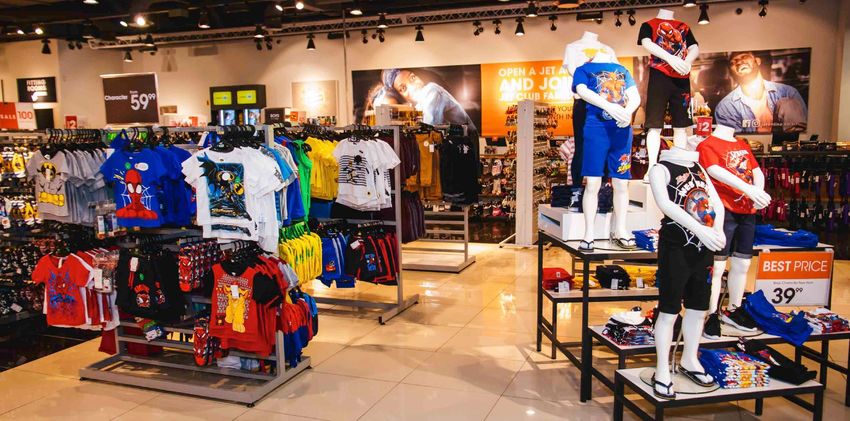
AGENDA
PRESS
PASS
  Anthony Thunström
   Chief Executive Officer
                             STRATEGIC
                             OVERVIEW

         Bongiwe Ntuli
   Chief Financial Officer
                             GROUP FINANCIAL
            Jane Fisher
                             PERFORMANCE
TFG Africa Group Director

    Shane van Niekerk
          TFG Africa: Jet    SEGMENT
                             PERFORMANCE
             Ben Barnett
             TFG London

             Gary Novis      LOOKING
            TFG Australia
                             FORWARD

                                                   TFG RESULTS PRESENTATION
                                               FOR THE SIX MONTHS ENDED 30 SEPTEMBER 2020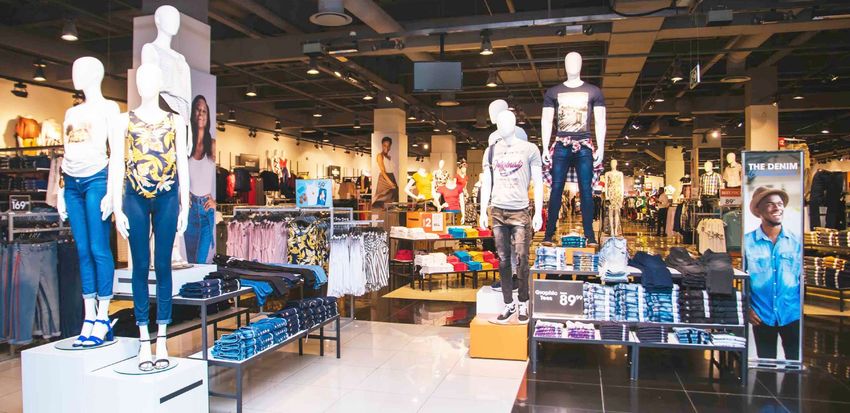
PROGRESS MADE ON KEY
          STRATEGIC PRIORITIES
STRATEGIC FOCUS AREAS                           KEY ACTIONS
                                                •   Launched myTFGworld and Sportscene apps
 Fast-track e-commerce evolution and digital    •   Launched American Swiss and Sterns online
                transformation                  •   Trialing value pure play jewellery brand Galaxy & Co
                                                •   Launched Johnny Bigg online in USA and Europe

                                                • Accelerated investment in digital transformation
         Investment through the cycle
                                                • Re-purposing of existing space

                                                • Rights offer successfully concluded
      Positioning for agility and flexibility   • Net debt down to R2,3bn (March 2020: R8,4bn)^
                                                • Target net debt/EBITDA 1-1.5x by end FY22*

                                                • Jet opportunistic acquisition
            Capture market share:
                                                • Additional local manufacturing capacity being
      Organic growth and opportunistic M&A
                                                  developed

                                                ^ On a pre-IFRS 16 basis for Group
                                                * On a pre-IFRS 16 basis for TFG Africa
  3                                                                                             TFG RESULTS PRESENTATION
                                                                                            FOR THE SIX MONTHS ENDED 30 SEPTEMBER 2020
PERFORMANCE
CONTEXT
COVID-19

Anthony Thunström

MANAGING THROUGH COVID-19

                    • All three major territories in economic recession
      COVID-19      • Consumer confidence and spending under pressure
       IMPACT       • Further lockdowns internationally
                    • Load shedding in South Africa                                                PEOPLE

                   • 34% of TFG Africa product (ex cellular and cosmetics) sourced locally              PEOPLE
     LOCAL           in SA
  Balance sheet
 SOURCING AND      • Local procurement in @home has increased from c.20% to c.50% over
   optimised                                                                                    •Safety and wellbeing of
MANUFACTURING        the last 4 financial years, with a further increase of 10% post COVID-19
    IMPACT           lockdown                                                                    our employees,
                   • Local apparel purchases to increase to R4,3bn by FY25                       customers and suppliers
                                                                                                 was prioritised
                                                                                                •Continued to pay staff in
       COST                                                                                      full throughout
    CONTROL AND    • Trading expenses decreased by 22,8%
                                                                                                 lockdown
     BUSINESS      • Business optimisation continues (HO savings of >R100m to date)
    OPTIMISATION

5                                                                                                         TFG RESULTS PRESENTATION
                                                                                                      FOR THE SIX MONTHS ENDED 30 SEPTEMBER 2020
COVID-19:
                          What did we experience

                         1                         2                              3                             4
                   Store trade Apr - Sept     Inventory & sourcing             E-commerce surge                    Employees

                   26%                        +2
                               Average                                                                      Enabled work from home where
                                                        Group inventory days
                               downtime TFG                                                                           possible
                                                        vs Sept 2019                      TFG Africa

                                                                               +152%
                               Africa & TFG
                                                                                          online turnover
                               Australia
                                                                                          growth May –
                                                                                          Sept 2020         Store operations resumed with

                   39%         Average
                               downtime TFG
                               London
                                              -7%        Group inventory
                                                         value vs Sept 2019
                                                                                                               strict hygiene protocols

                                                                               14%
                                                                                          Group online
                                                                                          turnover           Full salaries and benefits paid

                   R5bn                       +4%
                                                        Local procurement                 contribution              during lockdown
                              Lost turnover             contribution vs Sept              (Sept 2019: 8%)
TFG RESPONSE

                                                        2019

                   Capitalised on previous    Benefitted from flexible         Omni-channel dividend            Protection of the
                     digital investments        local procurement                                                  vulnerable

                                                                                                                      TFG RESULTS PRESENTATION
               6                                                                                                  FOR THE SIX MONTHS ENDED 30 SEPTEMBER 2020
COVID-19:
              What did we observe and impact on TFG

                        ECONOMIC EFFECT*                                                            “GOING OUT” & “FITNESS” ITEMS*

                                                   TFG IMPACT                                                            TFG IMPACT
                                                       Medium to                                                             Short to
                                                      longer term                                                          medium term

                                                                                                                             Demand for
                                                       Customers                                                           sporting apparel
    Household incomes are                                                                           will resume

                                                                                              55%
                                                      increasingly                                  social activities          already
      under even more
                                                   seeking perceived                                as soon as            rebounded. Smart
          pressure
                                                    value for money.                                possible
                                                                                                                            wear will take

          73%                                                                                       will resume
                                                                                                                               longer.

                                                                                              38%
                                                                                                    fitness
        of households                                                                               activities as
     experienced a loss in                                                                          soon as
                                                                                                    possible
            income

      *Based on a TFG digital survey, 11 August 2020, representative of TFG Africa customer base                            TFG RESULTS PRESENTATION
7                                                                                                                       FOR THE SIX MONTHS ENDED 30 SEPTEMBER 2020
COVID-19:
              What did we observe and impact on TFG

                                WORK WEAR*                                                           OMNI-CHANNEL

                                                    TFG IMPACT                                                 TFG IMPACT
                                                       Medium to                                               Short, medium
                                                      longer term                                              & longer term

                                                      Demand for work                                             Demand for online

          43%                                                                                29%
                                                      wear will recover                                            will continue to
                                                      slowly as people                                                 increase
                                                       return to work.                                              exponentially.
   of respondents who                                                                  of South African
  were able to work from                                                               consumers are
  home will negotiate to                                                            shopping more online
      continue WFH                                                                   now than before the
                                                                                          pandemic^

8 *Based on a TFG digital survey, 11 August 2020, representative of TFG Africa   ^ Nielsen                        TFG RESULTS PRESENTATION
   customer base                                                                                              FOR THE SIX MONTHS ENDED 30 SEPTEMBER 2020
COVID-19:
     What did we observe and impact on TFG

           Limited footfall in major shopping centres; online gains traction

           -29%                                                                    Taxi / Commuter Centre

              -20%                                                                 Super Regional Centre

                  -17%                                                             CBD / Town Centre -Large

                    -11%                                                           Regional Centre

                                                                                   Small Regional / Large Community

                                                                                   CBD / Town Centre -Small

                                                                                   Community Centre

                                                                                   Lifestyle Centre

                                                                                   CBD / Town Centre -Medium

                                                                                   Convenience Centre / Free Standing

                                                                                   Neighbourhood Centre

                                                                     152%          ONLINE

    -50%                   0%   50%            100%           150%          200%

                                  TFG AFRICA TURNOVER GROWTH MAY - SEPT

                                                                                                                  TFG RESULTS PRESENTATION
9                                                                                                             FOR THE SIX MONTHS ENDED 30 SEPTEMBER 2020
TFG AFRICA SOCIAL MEDIA:
                   Competitor summary
     COMPETITORS

                                  1 million   2 million   3 million     4 million   5 million   6 million   7 million   8 million    9 million        10 million

                                  FACEBOOK AUDIENCE                   TWITTER AUDIENCE               INSTAGRAM AUDIENCE

11                                                                                                                                  TFG RESULTS PRESENTATION
                                                                                                                                FOR THE SIX MONTHS ENDED 30 SEPTEMBER 2020
STRONG ONLINE TRAFFIC MARKET
SHARE
“Online Only" Brands "Brick & Mortar" Brands
Zando Yuppiechef Edgars
Superbalist 4% 2% 4%
Truworths
10% 5%
TFG
Cottonon
37%
4%
MRP
TFG 10%
24% Takealot
60%
Dischem
8%
Clicks Woolworths
12% 12%
Source: SimilarWeb (Online monitoring tool), measured in user sessions for web and App, April 2020 – September 2020
12 TFG RESULTS PRESENTATION
FOR THE SIX MONTHS ENDED 30 SEPTEMBER 2020SPORTSCENE & myTFGworld APPS
myTFGworld Sportscene
Online App Online App
Launched
50K
Downloads since
launch
in July
36%
of sales come Launched
through the App
1 Sept
13 TFG RESULTS PRESENTATION
FOR THE SIX MONTHS ENDED 30 SEPTEMBER 2020JEWELLERY ONLINE:
Launched 17 Aug 2020 – now 20 TFG Africa e-commerce sites
537K
Site visits since
launch
321K
Site visits since
launch
14 TFG RESULTS PRESENTATION
FOR THE SIX MONTHS ENDED 30 SEPTEMBER 2020JEWELLERY ONLINE:
Galaxy & Co launch as pure-play e-commerce site
• Launching a pure-play jewellery brand serving a
young and dynamic generation
• Everyday fashion fine jewellery for our younger
customers who are lifestyle led, quality & value
driven and inspired by experiences
• Galaxy & Co: trusted brand since 1930
• Compliments the Group’s existing two jewellery
brands serving the mass middle market
15 TFG RESULTS PRESENTATION
FOR THE SIX MONTHS ENDED 30 SEPTEMBER 2020COVID-19:
Accelerated shift to local procurement
Apparel, footwear Homeware Jewellery
and accessories
33% 45% 57%
Locally sourced product Locally sourced product
Locally sourced product
(+15% increase on LY) (+14% increase on LY)
(+3% increase on LY)
34%
Locally sourced product YTD Sept 2020
+4% increase (H1 2021 vs H1 2020)
TFG RESULTS PRESENTATION
16 FOR THE SIX MONTHS ENDED 30 SEPTEMBER 2020JET
Further expansion into value market
TRANSACTION INFO
Acquired
• 382 stores (425 once BLNE transactions finalised)
• c.R5-6bn annualised turnover
• >5 000 employees
• Total assets R2,7bn
• Stock of R473m including good contribution of summer stock
• Transaction value R333,2m
• Provisional gain on bargain purchase R694,3m
Retained solid management team
• Based in Johannesburg at TFG Isando office
• No relocations to Cape Town
KEY DATES
• Effective date 25 Sep 2020 (SA only) – BLNE expected Q4 FY
2021
• System integration by 31 March 2021
TFG RESULTS PRESENTATION
17 FOR THE SIX MONTHS ENDED 30 SEPTEMBER 2020JET
Key reflections to date
SURPRISES CREDIT PROFITABILITY
• Absolutely none • RCS relationship • All stores profitable from day 1
• Prior knowledge helpful • Capital light based on realistic forecasts
INTEGRATION PROGRESS &
CONSIDERATIONS INVENTORY STORE ESTATE
• Integration well under way • Deal premised on R800m of • Full estate DD completed
• Great cultural fit stock; traded down to only • Capex of c.R70m over the next
• Relocated into TFG Isando R473m as at effective date 18m and thereafter R30m-R50m
offices • Stock inherited exceptionally pa for next couple of years
clean: • Rosebank ‘light touch’
• IT integration to be completed
• 25% >6m old refurbishment @R500k tested
by 31 March 2021
• 0% >12m old before acquisition – double digit
• Integration costs c.R180m • New stock clearing at levels growth since re-opening
• Rollout of TFG OneX POS in beyond expectation • Over 200 locations where TFG
progress • Short on certain categories but wasn’t previously represented
getting back into stock during • Potential rollout of another c.150
November Jet stores over time
TFG RESULTS PRESENTATION
18 FOR THE SIX MONTHS ENDED 30 SEPTEMBER 2020JET
Before….
Lack of sufficient store lighting, blocked display windows, clutter….
TFG RESULTS PRESENTATION
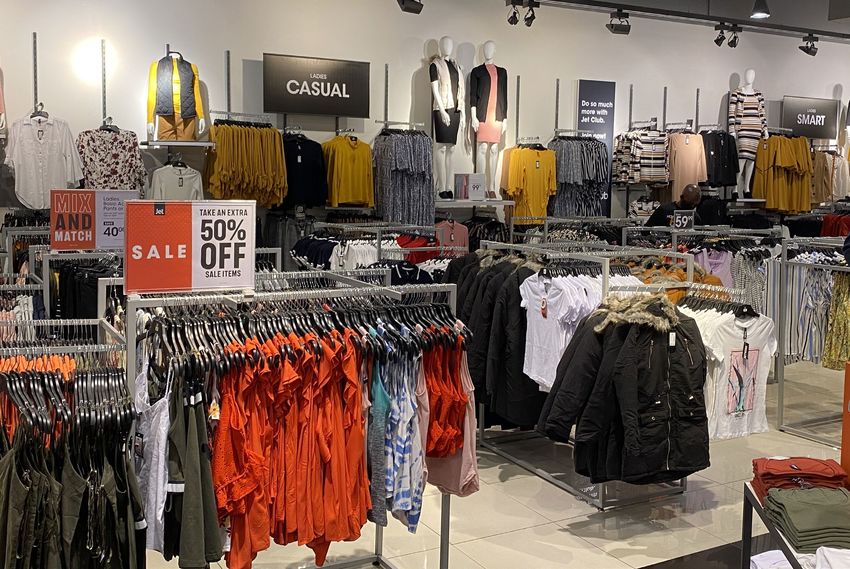
19 FOR THE SIX MONTHS ENDED 30 SEPTEMBER 2020JET
After….
Inviting shopfronts
TFG RESULTS PRESENTATION
20 FOR THE SIX MONTHS ENDED 30 SEPTEMBER 2020JET
After….
Clear focal areas
TFG RESULTS PRESENTATION
21 FOR THE SIX MONTHS ENDED 30 SEPTEMBER 2020JET
After….
Key essential items
TFG RESULTS PRESENTATION
22 FOR THE SIX MONTHS ENDED 30 SEPTEMBER 2020JET
After….
Open flow
TFG RESULTS PRESENTATION
23 FOR THE SIX MONTHS ENDED 30 SEPTEMBER 2020Our Sustainability Pillars
through the Value Chain
SUSTAINABILITY: KEY STRATEGIC PILLAR
Localisation and
job creation
• Retained Level 6 despite code amendments Environmental
• More than R1bn spent in FY20 supporting Procurement and CSI (scorecard) efficiency
• Looking forward – significant investment in priority areas for SA benefit People &
communities
Supply chain &
• Local manufacture spend ~ R1,6bn to increase to R4,3bn in FYE25 Product stewardship
Our • Continued on-shoring capacity creation through own production and
partnerships with over 20 local CMTs
production • Founding member of South African Plastic Pact
• SEDEX compliance
• R1,5bn spent with Black owned and Black women owned suppliers
• R1,7bn spent with local SMME’s
Our suppliers • Deliberate strategy for supplier development (incl non-apparel/services) ~
incubation and spend shifting to empowered suppliers
• Signed up to the Y.E.S. programme, creating c.450 youth work experience
opportunities every year
Our people & • Around 4 000 learners through learnerships and TFG Retail Academy as part
of our “Educate to Employ” strategy
communities
• More than R20m spent directly in community projects
• Direct interventions to support staff generally as well as those most
vulnerable through COVID
TFG RESULTS PRESENTATION
24 Spend figures relates to the current BEE certificate achieved on FY20 spend FOR THE SIX MONTHS ENDED 30 SEPTEMBER 2020GROUP FINANCIAL PERFORMANCE Bongiwe Ntuli
FINANCIAL PERFORMANCE OVERVIEW
                 26,1% decline in Turnover, EBITDA margin decline 1,1%

                                                                                        •   Trade heavily impacted by significant
                                                                                            store closures (c.8 weeks lost turnover)
                                                                                            and further lockdowns in international
                                        HIGHLIGHTS                                          countries
                                                                                        •   Trading expense reduction of 22,8% ~
                                                                                            includes government subsidy, rental
            Turnover R12bn                            EBIT R960m                            reprieves and very stringent cost control
-26,1%      (Sept 2019: +6,5% to R17bn)
                                              7,7%    Margin (Sept 2019: 13,7%)             in line with continued business
                                                                                            optimisation at HO
                                                                                        •   EPS vs. HEPS is Jet provisional bargain
                                                                                            purchase gain on acquisition ~ R694,3m
            Gross margin R6bn                         EPS (PAT R416m)
45,2%       (Sept 2019: 53,2%)               -69,7%   (Sept 2019: +5,4% to 533,4 cps)
                                                                                        •   Gross margin reduction of 8,0% -
                                                                                              • Heavy promotional environment
                                                                                              • COVID-19, further stock provisions
                                                                                                 (additional 5%) especially in TFG
                                                                                                 London businesses
                                                     Headline loss R235m
             EBITDA R3bn                                                                      • Product mix (cellular and
23,9%        Margin (Sept 2019: 25,0%)
                                             -117,1% HEPS -91,0 cps                              homeware sales contribution)
                                                      (Sept 2019: +3,9% to 531,2 cps)

The above information is post-IFRS 16

      26                                                                                                       TFG RESULTS PRESENTATION
                                                                                                           FOR THE SIX MONTHS ENDED 30 SEPTEMBER 2020
TURNOVER DRIVERS
Exceptional performance from Homeware and Cellular categories
MERCHANDISE CATEGORY
2,7%
3,3%
Cosmetics -34,3%
5,5%
CONTRIBUTION
8,9% -42,1%
GROWTH
Jewellery & Accessories
Homeware & Furniture -10,0%
Cellular 17,6%
79,6%
Clothing -28,8%
• Cellular contribution +3,3% and homeware contribution +1,0% compared to September 2019
• Clothing performance: decrease in demand for occasion and formal wear, especially UK due to lockdown restrictions
TFG RESULTS PRESENTATION
27 FOR THE SIX MONTHS ENDED 30 SEPTEMBER 2020TURNOVER DRIVERS
Online Turnover exceeded expectation
GEOGRAPHY TENDER TYPE CHANNEL
18% 14,4%
CONTRIBUTION
CONTRIBUTION
CONTRIBUTION
23,4%
16% 66% 76,6%
85,6%
GROWTH
GROWTH
GROWTH
25,6%
-30,9%
-56,2%
-22,1%
-26,9%
-23,0%
-34,7%
TFG Africa TFG London TFG Australia
ZAR GBP AUD Cash Credit Store Online
Africa & Australia online turnover exceeded
Trade still severely impacted by social TFG Africa cash turnover declined 12,9%
expectation at +115,8% and +66,8%
distancing and government-enforced Credit turnover impacted by stringent
UK online turnover - weaker online department
lockdown restrictions acceptance criteria (QUARTERLY TURNOVER TRENDS:
Significantly improved Q2 ‘21 despite further lockdowns
TFG Africa TFG London TFG Australia Group
Q1 Q2 Q1 Q2 Q1 Q2 Q1 Q2
• Improvements in Q2
turnover recorded in
all regions, even with
the 2nd lockdowns in
international countries
+52,6%
+63,5% • Africa for the month of
September was flat on
+55,9% LY, a remarkable
achievement
+59,9%
TFG RESULTS PRESENTATION
29 FOR THE SIX MONTHS ENDED 30 SEPTEMBER 2020GROSS MARGIN ANALYSIS
Impacted by COVID-19 provisions and competition
TFG TFG TFG
Africa London Australia Group
SEPT 2020
41,1% 44,1% 60,7% 45,2%
SEPT 2019
47,4% 61,7% 64,8% 53,2%
6,3% decline 17,6% decline 4,1% decline 8,0% decline
Decline due to heavy Decline due to Decline due to stock
competition promotional promotional activity, stock provisions (impact of
activity (apparel), stock provision (impact of 6,1%, 1,4%, total c.A$6,4m)
provision (impact of 2,4%, total c.£14,9m) and and change in product
total c.R530m) and increase in wholesale mix (increased sales
change in product mix sales at a lower margin from lower margin
(cellular (up 23%) and athleisure)
homeware at lower
30 TFG RESULTS PRESENTATION
margins) FOR THE SIX MONTHS ENDED 30 SEPTEMBER 2020KEY EXPENSES OVERVIEW
Trading expenses down 23%
YTD YTD
% to retail % to retail
Sept 2020 Sept 2019 % change
turnover turnover
Rm Rm
Depreciation 429,8 3,4 411,8 2,4 4,4
Employee costs 2 232,7 17,8 3 096,3 18,3 (27,9)
Occupancy costs 1 910,5 15,2 2 091,4 12,3 (8,6)
Other operating costs 1 697,7 13,5 2 360,9 13,9 (28,1)
Total trading expenses before IFRS 16 6 270,7 50,0 7 960,4 46,9 (21,2)
Depreciation – leases IFRS 16 1 602,3 12,8 1 504,9 8,9 6,5
Occupancy costs – leases lFRS 16 (1 935,4) (15,4) (1 769,6) (10,4) 9,4
Total trading expenses 5 937,6 47,4 7 695,7 45,4 (22,8)
• Employee costs • Other operating costs
• Decrease of 6,3% excluding the impact of government relief (TERS, Furlough • Savings in travel and marketing costs > R100m
and JobKeeper) – R669,6 million
• Zero salary increases • COVID-19 related expenses
• Savings from Business Optimisation initiatives (HR: annual benefit of R75m),
workstreams continue • Depreciation
• Pre-IFRS 16 depreciation increase driven mostly by store expansion
• Occupancy costs in Australia (+ net 23 outlets since Sept 2019)
• Increase of only 5,7% excluding total rent relief of R301,0m
TFG RESULTS PRESENTATION
31 FOR THE SIX MONTHS ENDED 30 SEPTEMBER 2020IMPACT OF NON-COMP ITEMS
JET RIGHTS OFFER COVID-19
• Acquisition costs • Raised net proceeds of • Government relief
R14,3m c.R3,8bn R796m
• Provisional bargain • Additional shares • Rent relief R301,0m
purchase gain on 94,27m at R41,90 per
share • Additional stock
acquisition R694m
provisions (c.R350m)
• Net impact of R680m on • 2,3x oversubscribed • TFG Africa (~R200m)
PBT • Finance costs net • TFG London (GBP 5,4m)
saving of R32,1m • TFG Australia (AUD 2,7m)
• COVID-19 related
expenses a conservative
c.R30m
TFG RESULTS PRESENTATION
32 FOR THE SIX MONTHS ENDED 30 SEPTEMBER 2020FINANCIAL POSITION Bongiwe Ntuli
FINANCIAL POSITION STRENGTHENED

                                                                                •      Debt equity position improved 41,2% with
                                      FINANCIAL POSITION                               lower debt levels post the rights offer and
                                                                                       deliberate debt reduction on maturity
                                                                                       (R4,3bn)
                 ROCE                                  Current ratio            •      Available facilities as at 30 Sept were
 9,3%            (March 2020: 13,3%)            2,0x                                   R9,2bn (TFG Africa R8,3bn, TFG London
                                                       (March 2020: 1,5x)
                                                                                       £1,6m, TFG Australia A$65m)
                                                                                •      ROCE impacted by lower earnings
                 Debt-to-equity        ratio^          Group inventory days
11,2%            (March 2020: 52,4%)
                                                186                             •      Strong operating cash flow generation of
                                                       (March 2020: 184)
                                                                                       R4,9bn

                                                                                •      Inventory purchases down R2,4bn and
                                                                                       debtors down R717m since Sept 2019
       FCF to net profit                               Net debt to EBITDA ^
608,6% (March 2020: 92,2%)                      0,6x   (March 2020: 1,6x)       •      Net debt to EBITDA of 0,6x compared to LY
                                                                                       Sep 1,6x
                                                                                        • LT target of 1-1.5x by end FY22*

 * on a pre-IFRS 16 basis for Group                                           * on a pre-IFRS 16 basis for TFG Africa

         34                                                                                                                 TFG RESULTS PRESENTATION
                                                                                                                        FOR THE SIX MONTHS ENDED 30 SEPTEMBER 2020
IMPROVED DEBT TO EQUITY
RATIO OF 11,2%
EBITDA to Net debt to Debt to DEBT TO EQUITY RATIO
finance costs EBITDA equity
65,3% 62,0% 57,7% 52,4%
R2,3bn 3,6 0,6 11,2% SEPT 2020
11,2%
Net debt
(pre-IFRS 16) FY2017 FY2018 FY2019 FY2020 H12021
6,8 1,6 52,4% MARCH 2020
Debt To Equity ratio
GROUP DEBT REPAYMENT PROFILE
R11,3bn 5,2 1,6 55,9% SEPT 2020
9,2
Net debt 4,8
(post-IFRS 16)
6,4 2,0 106,4% MARCH 2020
Rbn
• EBITDA at R3bn down 29,5% to last year (post-IFRS 16) (57,1% pre-IFRS 16) -1,1 -1,0 -1,3 -1,7
• Adequate liquidity facilities in place (c.R9,2bn at end September 2020 + cash of R4,8bn) -2,0
• Covenant testing waived for Sept 2020 interims and reset for March 2021
Cash 30 Avail Mar 21 Mar 22 Mar 23 Mar 24 Mar 25
• Dividends will be resumed when appropriate
Sep 20 Facility 30
Sep 20
35 TFG RESULTS PRESENTATION
FOR THE SIX MONTHS ENDED 30 SEPTEMBER 2020GROUP STOCK SUMMARY
GROUP STOCK VALUE GROUP STOCK DAYS
Total R8.4bn
Total R7.5bn 1 164
A$ 106m
248
A$ 88m 1 055 Group & Africa below excludes JET
1 662 £ 75m 211
£ 68m 1 474 186 184 186
177
185
167
489
5 606
4 439
TFG GROUP TFG AFRICA TFG LONDON TFG AUSTRALIA
Sep 20 Mar 20
TFG AFRICA (excl JET) JET TFG LONDON TFG AUSTRALIA Sep 20 Sep 19
• Stock levels managed through partnership approach with suppliers and our QR/own manufacturing in response to trading
conditions
• Stock provisions at end September 2020:
- TFG Africa c.R530m
- TFG Australia c. A$6,4m
36 - TFG London c. £14,9m
TFG RESULTS PRESENTATION
FOR THE SIX MONTHS ENDED 30 SEPTEMBER 2020STRONG CASH GENERATION
R4,3 billion net cash from operations
37 TFG RESULTS PRESENTATION
FOR THE SIX MONTHS ENDED 30 SEPTEMBER 2020CAPEX SPEND
Reduced by 61%
While investment in digital transformation was prioritised,
capital investment was pulled back to preserve liquidity
R197,4m R514,3m
34%
59% (R177m)
IT
EXPAND 69% 64% (R117m)
62%
STORES
62%
MAINTAIN 31% 36% 35% (R318m)
OTHER (R68m)
SEPT 2020 SEPT 2019
6% (R12m) 4% (R19m)
SEPT 2020 SEPT 2019
38 TFG RESULTS PRESENTATION
FOR THE SIX MONTHS ENDED 30 SEPTEMBER 2020FINANCE ~ LOOKING AHEAD
• Working capital management – continued focus
• 2nd Half: Inventory levels to increase partially as we stock up Jet
• Debtor book management
• Capex run rate higher than first half, and will be largely digital and increase in line with
economic recovery and Jet capex plans
• Cash Preservation
• Business Optimisation – extract further efficiencies
• Conclude the Finance and Procurement workstreams
39 TFG RESULTS PRESENTATION
FOR THE SIX MONTHS ENDED 30 SEPTEMBER 2020MANAGING CREDIT DURING COVID Jane Fisher
CREDIT GROWTH

                       NEW ACCOUNTS                                          •   Credit marketing during COVID has been curtailed decreasing demand by
1 200 000                                                              60%       55,0%
1 000 000                                                              50%

 800 000                                                               40%   •   Approval rates have been reduced to less than 10%
 600 000                                                               30%

 400 000                                                               20%   •   Lack of new accounts and the hard lockdown have resulted in credit sales
 200 000                                                               10%       decreasing by 34,7% YoY
        0                                                              0%
             Mar-Sep 2018       Mar-Sep 2019         Mar-Sep 2020
                                                                             •   Active accounts decreased by under 5% to 2,6 million
                      No Applications          Accept Rate

                                                                             •   Contraction in credit sales results in gross book decreasing by 3,1% YoY
            NEW ACCOUNT GROWTH VS. RISK
100%                                                                   30%
                                                                             •   Credit contribution now 35,5%, down from 42,3% PY
                                                                       25%
 50%                                                                         •   Level of delinquency for new accounts opened in FY20 improved
                                                                       20%
                                                                                 significantly vs FY19
  0%                                                                   15%
            2017       2018        2019         2020         H1 2021
 -50%
                                                                       10%
                                                                             •   Delinquencies for H1 FY21 maintained at this lower level
                                                                       5%

-100%                                                                  0%

             YoY New Account Growth (LHS)            Avg 2+@5 (RHS)

41                                                                                                                                       TFG RESULTS PRESENTATION
                                                                                                                                     FOR THE SIX MONTHS ENDED 30 SEPTEMBER 2020
CREDIT QUALITY
Cash Collected % of LY • In-store payment channel still channel of choice accounting for circa 80% of
120% payments, but many customers converted to electronic channels during
100%
lockdown
80%
60%
40% • Customers are paying their accounts and running circa 10% lower than last
20% year
0%
Apr May Jun Jul Aug Sep
• Approximately 50% of the customer base as at March 2020 were given
either one or two payment holidays in April and May
PAYMENT HOLIDAY
2,0 100%
• Payment behaviour of majority of customers remained robust
Millions
1,5 80%
60% • Provision levels have increased to 25,0% from 19,7% in order to be
1,0
40% conservative
0,5 20%
0,0 0%
No Payment 1 Payment Holiday 2 Payment Holidays • Lower write-offs in H1 FY21 due to payment holidays, increased provision
Holiday requirement at Sep-20, but write-off will increase in H2 reducing provision
Account volume (LHS) Up-to-date Sep-20 (RHS) requirement at Mar-21
42 TFG RESULTS PRESENTATION
FOR THE SIX MONTHS ENDED 30 SEPTEMBER 2020CREDIT EBIT SUMMARY
TFG AFRICA % of credit TFG AFRICA % of credit TFG AFRICA
September granted September granted % change
2020 2019
(Rm) (Rm)
Income 927,4 19,5 1 227,3 15,9 (24,4)
Net bad debt (778,4) 16,3 (617,0) 8,0 26,2
Credit costs (239,7) 5,0 (255,6) 3,3 (6,2)
EBIT (90,7) (1,9) 354,7 4,6 (125,6)
Increase in
Income growth Net bad debt Credit costs
affected by due to impact decrease YoY
275 bps rate of payment due to lack of
drop since 20 holiday on new account
March provisions growth
43 TFG RESULTS PRESENTATION
FOR THE SIX MONTHS ENDED 30 SEPTEMBER 2020CREDIT OUTLOOK
• Payment behaviour of the customer base remains
robust and exceeds expectations
• Strict credit lending criteria to remain in place as a
result of the extended lockdown
• Discussions regarding implementation of Debt
Intervention Bill have commenced
• Credit for Jet customers will be managed by RCS
• Additional credit sales to be generated from cross
shopping into Jet from existing customer base
44 TFG RESULTS PRESENTATION
FOR THE SIX MONTHS ENDED 30 SEPTEMBER 2020Shane van Niekerk
STRATEGIC
                  JET BRAND OVERVIEW
                            OVERVIEW
                  KJet
                    eyStores
                       matters foracquired
                             was   the period
                                            in under review seven supermarkets
                                               1965 featuring
                                                                                                                                 POWERED BY TFG

     1965                  1975                   1985   1995                   2005                      2015                             2020

    1965                        1976                        1998                       2007          2012                       2019
     Edcon                Registered the                  Re-listed on            Purchased           Credit              Sale of Active
purchases Sales             Jet brand                        JSE                   by Bain            book                 and exit Jet
 House and Jet                                                                     Capital           sold to                  Mart
     Stores                                                                                          ABSA
   (7 Stores)
               1971                        1982                          2002                 2011                2016                     2020
       Opened 80 Jet stores            Purchased                     Acquire 17           Edgars Active        Sale of Legit          Sale of Jet
         – Introduction of              by SAB                    Supermart Stores         started from         and exit of               to TFG
         home from Dan                                            and rebrand to Jet      failed Discom        Bain Capital
       Hands furniture stores                                      Mart to introduce          Stores
                                                                       General
                                                                    Merchandise

      46                                                                                                                     TFG RESULTS PRESENTATION
                                                                                                                         FOR THE SIX MONTHS ENDED 30 SEPTEMBER 2020
STRATEGIC
JET BRAND OVERVIEW
OVERVIEW
KJet
eyismatters for the period
a meaningful under review
value retailer in Southern Africa
1.1M
R6bn Jet Facebook
Net Sales followers
600k
5300 Jet Club
Employees Facebook
followers
STORE
425 130k
Stores in Instagram
Southern Africa followers
47 TFG RESULTS PRESENTATION
FOR THE SIX MONTHS ENDED 30 SEPTEMBER 2020STRATEGIC OVERVIEW
KJET BRAND
ey matters for the OVERVIEW
period under review
To b e t h e m o s t l o v e d v a l u e r e t a i l e r i n
VISION Southern Africa
To a d d r e s s t h e l i f e s t y l e n e e d s o f v a l u e
MISSION c o n s c i o u s c u s t o m e r s i n c l o t h i n g a n d h o m e
without compromising their aspirations
To e m p o w e r S o u t h A f r i c a n s w i t h t h e t o o l s
PURPOSE they need to write their own futures
48 TFG RESULTS PRESENTATION
FOR THE SIX MONTHS ENDED 30 SEPTEMBER 2020JET BRAND OVERVIEW
We are for everyone in the family
SAVVY + SINGLE TWO 2 TANGO ME + MINE KID ZONE ALL IN THE FAMILY
Kids Only Entire Family
Our Customers are…
Singles Couples Single Parents
• Classic to modern
• Value conscious
• Fashion followers
9% of customers 8% of customers 25% of customers 10% of customers 47% of customers
3% of spend 5% of spend 20% of spend 3% of spend 69% of spend • Look + feel good
Average monthly Average monthly Average monthly Average monthly Average monthly on a budget
household income household income household income household income household income
R6 556 – R8 416 R8 238 – R11 662 R3 594 – R4 687 R9 671 – R12 871 R9 671 – R12 871
• Predominantly
2.6 visits a year 3.8 visits a year 5.4 visits a year 2.5 visits a year 7.9 visits a year
SEM 3-7
R515 average yearly R900 average yearly R1 199 average yearly R535 average yearly R2 230 average yearly
spend spend spend spend spend
Growth opportunity Core customer Growth Opportunity Core customer
TFG RESULTS PRESENTATION
49 FOR THE SIX MONTHS ENDED 30 SEPTEMBER 2020STRATEGIC OVERVIEW
16 POINT PLAN: 2021/2021
Key matters for the period under review
New assortment Store Grid
1 Strategy 5 Cosmetics/Colour 9 Extension 13 Cellular
Availability Credit/Insurance
2 % in Stock/Colour 6 Exit Retail 10 Home 14 and Financial
and Size Services
Store
3 Denim 7 Accessories 11 Supply 15 Segmentation
Enhanced
Rewards/Club and
4 Range Extension 8 School wear 12 Communication
16 Shopping
Experience
50 TFG RESULTS PRESENTATION
FOR THE SIX MONTHS ENDED 30 SEPTEMBER 2020TFG LONDON Ben Barnett
TFG LONDON:
              COVID-19 impact on turnover

                         STORE RE-OPENINGS                                                              TURNOVER
                                                                                   LOCKDOWN                                                      LOCKDOWN
1000     LOCKDOWN                                           LOCKDOWN

                                                       LOCKDOWN
 750                                                                                                                          -37,8%
                                                                                                                  -42,1%
                                                                                                                                              -45,0%

 500
                                                                                                       -62,1%
                                                                                           -66,7%

 250                                                                           -76,7%

   0
        Apr        May         Jun         Jul        Aug        Sep             April      May          June      July        August           Sept

                              Open       Closed                                                     H1 2021     H1 2020      Total

                                                                              • Turnover since the March lockdown has been significantly depressed by
  • Gradual opening of store and concession estate during May in
                                                                                reduced global demand for our key categories
    International markets and from 15 June in the UK, however significantly
                                                                              • ‘Work from home’ policies have reduced formal workwear demand,
    lower levels of footfall
                                                                                whilst containment policies have led to waves of event cancellations,
  • Re-opening of city centre locations generally held back until October
                                                                                reducing demand for occasion wear.
    where office workers remain working from home and tourist numbers are
                                                                              • Pent up demand clearly exists – the government “Eat Out to Help Out”
    significantly down
                                                                                scheme drove sales before 2nd wave led to further UK restrictions

  52                                                                                                                           TFG RESULTS PRESENTATION
                                                                                                                           FOR THE SIX MONTHS ENDED 30 SEPTEMBER 2020
TFG LONDON:
Weak sales, partly mitigated by tight cost control
44,1%
Sept 2020 Sept 2019 Gross margin
% to turnover % to turnover % change (Sept 2019: 61,7%)
£m £m
Retail turnover 88,0 200,7 (56,2)
EBITDA
EBIT
(5,6)
(19,8)
(6,4)
(22,5)
28,4
12,4
14,2
6,2
(119,7)
(259,7) -6,4%
EBITDA* margin
Occupancy costs 13,5 15,3 21,5 10,7 (37,2) (Sept 2019: 14,2%)
Occupancy costs – IFRS 16 (13,6) (15,5) (13,7) (6,8) (0,7)
-22,5%
Depreciation 3,9 4,4 4,5 2,3 (13,3)
Depreciation - leases 10,3 11,7 11,5 5,7 (10,4)
Employment costs 18,0 20,5 37,6 18,7 (52,1)
EBIT* margin
Other operating costs 26,5 30,1 50,0 24,9 (47,0) (Sept 2019: 6,2%)
Total trading expenses 58,6 66,6 111,4 55,5 (47,4)
* Post-IFRS 16 EBITDA and
EBIT
YTD turnover down significantly on prior
Own-website turnover increased 1,6%, Gross margin negatively impacted by Strong cost control, Government support
period due to COVID-19 store closures,
3rd party websites experienced a 30% significant promotional activity in the through furlough scheme and business
work from home policies limiting footfall
decline in online turnover compared to market and higher COVID-19 related rates relief mitigated some of the impact
in city centres and weak demand for
the prior period stock provisioning of drop in gross margin
occasion wear and work wear
53 TFG RESULTS PRESENTATION
FOR THE SIX MONTHS ENDED 30 SEPTEMBER 2020TFG LONDON:
Factors mitigating gross margin shortfall
YTD EBIT Waterfall £m
85,0
12,4 7,9 1,8 19,6 23,5
Reductions in
(19,8) occupancy,
employment and
operating costs
partially mitigate the
significant gross
margin shortfall
Sep-19 EBIT Gross Margin Occupancy Costs Depreciation Employment Other operating costs Sep-20 EBIT
YTD turnover down 56,2% due to store
Occupancy costs down by 37,2% Employments costs down by 52,1%
closures and lower footfall, with Gross
through store closures, negotiated rent through stores closures, structured Other operating costs 47,0% lower as a
Margin down further by 68,7% through
reductions (average 47% rent reduction redundancy program, 20% pay cuts in result of lower concession commission
increased markdown, mix of promotional
on 49 leases with expiry / break clauses) April & May and the government job and tight control of discretionary spend.
sales and prudent COVID-19 related
and rates relief retention scheme
stock provisions
54 TFG RESULTS PRESENTATION
FOR THE SIX MONTHS ENDED 30 SEPTEMBER 2020BALANCE SHEET & CASH FLOW
Robust balance sheet maintained despite trading losses
CASH BALANCES £m STOCK BALANCES £m
46,6 84.5 83.0
Renegotiated payment 79.4
terms with stock suppliers, Gross stock at Mar 2020 of
government agreed £85m reduces to £83m at
27,8 deferrals of direct and Sept 2020 with provisions
24.4
indirect taxes, deferred rent increasing from £10m to
and rates relief, as well as £15m
loan facility draw down
Sep 19 Mar 20 Sep 20 Sep 19 Mar 20 Sep 20
Net Stock Stock Provision
BORROWINGS £m TRADE CREDITORS £m
58.6 32,9
56.6
50.8 28,4 Renegotiated payment
Revolving Credit Facility terms with merchandise
drawn down in full, 3 year 19,4 suppliers, offset by reduced
term with ability to extend new season purchase
to 5 years. volumes
Sep 19 Mar 20 Sep 20 Sep 19 Mar 20 Sep 20
55 TFG RESULTS PRESENTATION
FOR THE SIX MONTHS ENDED 30 SEPTEMBER 2020OUTLOOK
TFG London are repositioning for the post Covid recovery
• UK retail market has rebounded strongly in recent months, with September showing total retail
sales growth +3,4% on the prior year. Household goods have been in double digit growth
• Clothing sales have seen a stark divide between growing sales of casual, athleisure and
sportswear and declining sales of formal work and occasion wear
• We firmly believe however that the strength of our brands is undiminished – our focus is on
ensuring we are optimally positioned for a strong resumption of activity in S/S22
• We continue to drive negotiations with landlords to secure advantageous rents with
flexible lease terms
• We continue to support our strong supplier relationships, retaining brand expertise in
house and externally
• We continue to communicate with our customer base, growing our use of social media to
support remote engagement and the development of our casual clothing offer
• Recognising the acceleration of channel shift away from department store locations, we have
accelerated our site reduction program, whilst driving efficiency gains in store and at head office
56 TFG RESULTS PRESENTATION
FOR THE SIX MONTHS ENDED 30 SEPTEMBER 2020TFG AUSTRALIA Gary Novis
TFG AUSTRALIA:
                           COVlD-19 impact - sales

                                                                                                                Comments:
                                                                                        VIC & NZ                First Wave:
                                                                                                                -     All stores Closed on 27 March
                                                                                                                -     Tested COVID Safe re-opening April
      Prior Year - Sales

                                                                                                                -     All stores re-opened by end of May
                                                                                                                Second Wave:
                                                                                                                -   84 Victorian stores closed 6 August,
                                                                                                                    Govt imposed lockdowns
                                                                                                                -   17 New Zealand stores closed for 2
                                                                                                                    weeks in August
                                                                                                                -   Victorian stores re-opened 28 October
                                                                                                                Highlights:
                                                                                                                -   Strength of team culture
                                                                                                                -   Decisiveness of management team
                                                                                                                -   Grateful for Government initiatives
                           TY
                                                                                                                    (JobKeeper) &
                                                                                                                -   Landlord assistance
                      April         May          June           July           August           September
                                                                                                                Industry Learnings:
                                                                                                                -   Athleisure sector accelerated;
                                                                                                                -   “Occasion” based categories declined
                                                                                                                    with “all events cancelled”;
     Sales largely               Phased        Phased        Eased          2nd Wave Victoria   Victoria 84
     digital only                              reopening     Restrictions   84 stores closed    stores remain
                                                                                                                -   Strategy unchanged
                                 reopening
                                                                            2nd August          closed          -   COVID has accelerated the trend to
                                                                                                                    digital channels
                                                                            2nd Wave NZ
                                                                            17 stores closed
                                                                            for 2 weeks
     Sales (87%)                 Sales (29%)   Sales (10%)   Sales +2%      Sales (24%)         Sales (19%)

58                                                           Comp (2%)      Comp (12%)          Comp (4%)                   TFG RESULTS PRESENTATION
                                 Comp (21%)    Comp (14%)
                                                                                                                        FOR THE SIX MONTHS ENDED 30 SEPTEMBER 2020
TFG AUSTRALIA:
Decline in EBITDA less than turnover decline
Sept 2020 Sept 2019
60,7%
% to turnover % to turnover % change Gross margin
A$m A$m
(Sept 2019: 64,8%)
Turnover 194,1 265,4 (26,9)
EBITDA 60,9 31,4 68,1 25,7 (10,6)
EBIT 18,0 9,3 27,2 10,2 (33,8)
31,4%
Occupancy costs 47,8 24,6 50,0 18,8 (4,4) EBITDA* margin
Occupancy costs – IFRS 16 (41,6) (21,4) (40,0) (15,1) 4,0 (Sept 2019: 25,7%)
Depreciation 5,0 2,6 4,8 1,8 4,2
9,3%
Depreciation - leases 37,9 19,5 36,1 13,6 5,0
Employment costs 39,0 20,1 75,1 28,3 (48,1)
Other operating costs 11,6 6,0 18,8 7,1 (38,3) EBIT* margin
Total trading expenses 99,7 51,4 144,8 54,5 (31,1) (Sept 2019: 10,2%)
* Post-IFRS 16 EBITDA and
EBIT
YTD turnover down on prior period due Strong cost control, rental savings and
Significant reduction in cost of doing
to COVID-19 store closures (initial Government support through salary
Shift to online accelerated with growth of business partially offsetting the reduction
closures and more recent closures in support (JobKeeper program) ($19,4m);
66,8% in turnover and containing the drop in
New Zealand and Victoria), lower footfall which mitigated some of the impact of
EBITDA to 10,6%
and weak demand for occasion wear drop in turnover and gross margin
59 TFG RESULTS PRESENTATION
FOR THE SIX MONTHS ENDED 30 SEPTEMBER 2020TFG AUSTRALIA:
EBIT bridge
EBIT - YTD SEP 19 TO YTD SEP 20
27,2
4.0 18,0
4.4 (0.2)
6.1 (1.2)
16.6 (4.0)
19.4
(54.2)
YTD Sep19 Decline in Jobkeeper Other wage Rent - new & Rent - Restructure Savings - Depreciation Other YTD Sep20
GP savings annual COVID costs travel &
increase savings marketing
- Sales down; mainly due to “closures”
- Underlying “Comp Store” sales numbers substantially better than the “total sales
impact” - Negotiations with landlords resulted in $6,1m of Covid rent abatements
- Digital Sales have accelerated with the best result from Rockwear +110% - Store wage savings from store closures and roster management
- “Occasion” based product impacted by cancellation of “events” and restrictions - Permanent expenditure savings across the board
- “Athleisurewear” growing strongly due to “daily” exercise permitted during
lockdowns
60 TFG RESULTS PRESENTATION
FOR THE SIX MONTHS ENDED 30 SEPTEMBER 2020TFG AUSTRALIA:
Cash, borrowings and facilities
33,6
CASH FLOW - YTD SEP19 VS YTD SEP20 Cash & Facilities:
• Cash in Bank $47,9m
• Available facility $65m (Utilised /drawn $0)
• Facility Covenants satisfied as at September 2020
0 • Improved cash position +$34,1m
• Support from Government & Landlords:
• JobKeeper $16,4m (with $3m received in October)
• COVID Rent Relief $6,1m
• Comparative (Mar19-Sep19) 6-monthly cash flow is zero, due to re-
investment in growth
Balance Sheet:
• Appropriate provisions taken against inventory
• Supplier Payments all within standard terms except for
negotiations with landlords; which progressed subsequent to half
year end
TFG RESULTS PRESENTATION
61 FOR THE SIX MONTHS ENDED 30 SEPTEMBER 2020TFG AUSTRALIA:
Outlook
• Strategy remains unchanged
• COVID-19 has highlighted numerous strengths including:
• The ability to manage wind down and ramp up
• The strength of supplier relationships
• A sound business continuity plan
• The growing online presence of the business
• Confirmation of the strategy
• Strong Culture
• Growth through expansion of existing brands in Australia and New Zealand
continues subject to the appropriate terms being agreed with landlords
• Digital continues to outperform expectations; and we continue to invest to
support the growth
62 TFG RESULTS PRESENTATION
FOR THE SIX MONTHS ENDED 30 SEPTEMBER 2020OUTLOOK & CONCLUSION Anthony Thunström
OUTLOOK: H2

     RETAIL SALES FOR OCTOBER                   H2: 2021 FIN YEAR

                                                •   Trading conditions and consumer confidence remain under pressure, further job
        •   Africa                                  losses expected
            Encouraging performance             •   2nd COVID-19 lockdowns a real threat for near term
            o Turnover +8% (+22% including
                Jet)                            •   Black Friday/ Christmas trade dependant on lockdowns
            o Credit sales down -11%            •   Online turnover contribution expected to grow
            o Cash sales +25% (+52%
                                                •   UK remains a key concern, with further lockdowns imminent from November for initial
                including Jet)
                                                    30 days
                                                      o   Further parent support likely required, however quantum not significant
        •   UK (-38%)
            Remains a concern, further                o   “Last man standing” will win
            lockdowns in November to                  o   Value in use (£240m) to be tested H2 as part of ongoing management
            December                                      processes, once the landscape is better defined
                                                •   Australia well positioned for further growth, especially Rockwear and Johnny Bigg
        •   Australia (-15%)
            Victoria reopened 28 October with   •   Jet: Increased stock purchases to boost turnover growth. Integration expected by end
            first day of trade up 8%                of the financial year
            on LY; 28% up on prior week

                                                                                                                      TFG RESULTS PRESENTATION
64                                                                                                                FOR THE SIX MONTHS ENDED 30 SEPTEMBER 2020
STRATEGIC OUTLOOK
• TFG remains a highly successful retailer with incredibly strong brand positioning
• Over 4 500 outlets which includes c.425 new locations with JET – further TFG
expansion / presence opportunities
• 16m+ Rewards customers
• World class in-house credit
• Partially tapped VAS opportunity
• Ongoing brand & product innovation opportunities
GOING INTO THE NEW
• Customer and Digital FIRST mindset
WORLD
• Benefit of brand diversification has been a strength • UK: cautiously
• TFG is now across all LSM categories confident of market
• JET anchor into lower LSM categories share gains post
economic recovery,
• Strategic investments in digital transformation will continue to be prioritised minimal parent
support envisaged
• Vertical integration of supply chain • Clean balance sheet
• Continued localised quick response manufacturing capacity build and inventory levels
• Partnership approach with key suppliers • Strong cash sales
• Balance sheet strength and very well run
credit book
• Continued HO optimisation
TFG RESULTS PRESENTATION
65 FOR THE SIX MONTHS ENDED 30 SEPTEMBER 2020DISCLAIMER
This announcement contains certain forward-looking statements with respect to
the financial condition and results of operations of The Foschini Group Limited
and its subsidiaries, which by their nature involve risk and uncertainty because
they relate to events and depend on circumstances that may occur in the future.APPENDICES
COVID-19:
                Impact on macro environment

                                                           Business                                  Consumer
                    GDP
                                                          confidence                                 confidence
                                          Improvement in business confidence as
         All three major territories in                                                    Consumer spending remains
                                           economies open – further deterioration
                   recession                                                                    under pressure
                                          expected as restrictions tightened again
                                                with 2nd wave of infections

                   -51%                                   24      Q3 2020                            -23
                Q2 2020 q-o-q                              5      Q2 2020                            Q3 2020
 TFG Africa                                TFG Africa                                 TFG Africa

                   -20%                                    -1    Q3 2020                             -25
                Q2 2020 q-o-q                             -87     Q2 2020                            Sept 2020
 TFG London                               TFG London                                 TFG London

                    -7%                                    -4   Sep 2020                             93,8          Sep 2020
                   Q2 2020                                -65   Mar 2020                             75,6          Apr 2020
TFG Australia                             TFG Australia                              TFG Australia

68                                                                                                             TFG RESULTS PRESENTATION
                                                                                                           FOR THE SIX MONTHS ENDED 30 SEPTEMBER 2020
COVID-19:
Impact on employment
TFG AFRICA TFG LONDON TFG AUSTRALIA
23,3% 4.5% 6.8%
UNEMPLOYMENT UNEMPLOYMENT UNEMPLOYMENT
Q2 2020 Aug 2020 Aug 2020
Expanded unemployment Redundancies at highest Highest levels since
rate increased by 2,3% level since July 2009 Sept 2015
TFG RESULTS PRESENTATION
69 FOR THE SIX MONTHS ENDED 30 SEPTEMBER 2020SEPT 2020 RESULTS
INCOME STATEMENT

                                                    GROUP                        GROUP
                                                               % to turnover                % to turnover                      % change
                                                  Sept 2020                    Sept 2019
Revenue (Rm)                                        13 861,8                     18 567,7                                              (25,3)
Retail turnover (Rm)                                12 530,0                     16 955,2                                              (26,1)
Cost of sales (Rm)                                 (6 866,0)            54,8    (7 928,2)            46,8                              (13,4)
Gross profit (Rm)                                    5 664,0            45,2      9 027,0            53,2                              (37,3)
Interest and other income (Rm)                       1 331,8            10,6      1 612,5             9,5                              (17,4)
Net bad debt (Rm)                                    (778,4)             6,2      (617,0)             3,6                                26,2
Trading expenses (Rm)                              (5 937,6)            47,4    (7 695,7)            45,4                              (22,8)
Operating profit before acquisition costs, gain
                                                      279,8              2,2      2 326,8            13,7                              (88,0)
on bargain purchase and finance costs (Rm)
Acquisition costs (Rm)                                (14,3)             0,1            -                 -                            100,0
Gain on bargain purchase (Rm)                         694,3              5,5            -                 -                            100,0
Finance costs (Rm)                                   (571,0)             4,6      (650,5)             3,8                              (12,2)
Profit before tax (Rm)                                388,8              3,1      1 676,3             9,9                              (76,8)
Income tax expense (Rm)                                27,5              0,2      (443,4)             2,6                            (106,2)
Profit for the year (Rm)                              416,3              3,3      1 232,9             7,3                              (66,2)

Earnings per share                                    161,5                        533,4                                            (69,7%)
The above income statement is post-IFRS 16
   71                                                                                                    TFG RESULTS PRESENTATION
                                                                                                     FOR THE SIX MONTHS ENDED 30 SEPTEMBER 2020
GROUP STATEMENT OF FINANCIAL
POSITION
UNAUDITED AUDITED
Sept 2020 % change Mar-20
Rm Rm
Non‐current assets 22 853,8 6,8 21 403,4
Current assets 20 377,7 (1,8) 20 755,3
Inventory 7 457,2 (11,6) 8 431,1
Trade receivables ‐ retail 6 793,1 (12,5) 7 762,4
Other receivables and prepayments 1 227,8 (17,6) 1 490,4
Concession receivables 80,2 27,9 62,7
Cash and cash equivalents 4 760,2 60,3 2 969,1
Taxation receivable 59,2 49,5 39,6
TOTAL ASSETS 43 231,5 2,5 42 158,7
Equity attributable to equity holders of The Foschini Group Limited 20 263,0 27,1 15 942,6
Non‐current liabilities 12 834,5 3,1 12 447,1
Current liabilities 10 134,0 (26,4) 13 769,0
Interest‐bearing debt 1 401,1 (76,0) 5 849,2
Trade and other payables 5 181,0 8,2 4 786,4
Lease liabilities 3 445,5 14,8 3 001,0
Taxation payable 106,4 (19,6) 132,4
TOTAL LIABILITIES 22 968,5 (12,4) 26 216,1
TOTAL EQUITY AND LIABILITIES 43 231,5 2,5 42 158,7
72 TFG RESULTS PRESENTATION
FOR THE SIX MONTHS ENDED 30 SEPTEMBER 2020REVENUE BREAKDOWN
Retail turnover of
Interest income
-26,1% R12,5bn • Interest rate decrease of 300 bps
91% • Reduced net debtors book
H1 Sept 2020
(R7bn, down 9,6% since Sept
performance
2019)
H1 FY 2021 Interest income of
CONTRIBUTION -22,8% R719m Other income
TO REVENUE
• Value-added services R346m,
4% down 6,2%
5% Other income of • Collection cost recovery R255m,
-10,1% R613m down 16,6%
73 TFG RESULTS PRESENTATION
FOR THE SIX MONTHS ENDED 30 SEPTEMBER 2020TFG AFRICA Bongiwe Ntuli
TFG AFRICA

                                          Sept 2020                                   Sept 2019
                                                                                                                                                  41,1%
                                                              % to turnover                              % to turnover      % change                Gross margin
                                                Rm                                          Rm
                                                                                                                                                 (Sept 2019: 47,4%)
 Turnover                                    8 271,2                                    10 619,6                                (22,1)
 EBITDA                                      2 388,7                    28,9             3 039,4                   28,6         (21,4)
 EBIT                                        1 182,7                    14,3             1 827,4                   17,2         (35,3)
                                                                                                                                                  28,9%
 Occupancy costs                             1 042,5                    12,6             1 196,6                   11,3         (12,9)            EBITDA* margin
 Occupancy costs – IFRS 16                 (1 137,5)                  (13,8)            (1 116,4)                (10,5)            1,9           (Sept 2019: 28,6%)
 Depreciation                                  283,1                     3,4                280,8                   2,6            0,8

                                                                                                                                                 14,3%
 Depreciation - leases                         922,9                    11,2                931,2                   8,8          (0,9)
 Employment costs                            1 368,4                    16,5             1 653,3                   15,6         (17,2)
 Other operating costs                         973,6                    11,8             1 258,6                   11,9         (22,6)              EBIT* margin
 Total trading expenses                      3 453,0                    41,7             4 204,1                   39,6         (17,9)           (Sept 2019: 17,2%)

                                                                                                                                               * Post-IFRS 16 EBITDA and
                                                                                                                                                          EBIT

                                                Margin negatively impacted by
Good turnover performance from cellular
                                              promotional activity linked to tough             Product deflation of -3,6%          Continued focus on cost control
and homeware merchandise categories
                                           trading, stock provision and product mix

   75                                                                                                                                    TFG RESULTS PRESENTATION
                                                                                                                                     FOR THE SIX MONTHS ENDED 30 SEPTEMBER 2020
TFG AFRICA:
Turnover growth split per trading period – improving trends
TFG Africa
41,8%
31,8%
17,6%
8,0% 9,2%
-10,0% -8,9% -7,8%
-10,5%
-12,7%
-15,3%
-22,0% -21,6% -22,1%
-25,7%
-34,3% -35,5%
-41,0%
6-month turnover growth (April – Sept 2020) 5-month turnover growth (May – Sept 2020) 4-month turnover growth (Jun – Sept 2020)
TFG RESULTS PRESENTATION
76 FOR THE SIX MONTHS ENDED 30 SEPTEMBER 2020ADDITIONAL CREDIT INFORMATION
TRANSUNION:
         DETERIORATING CREDIT HEALTH
                                                                  Q3:+16%
                                                                  Q2:+21%
                                                                    YoY

     •    The CCI worsened to 44,0 in Q3 and Q2 of 2020
          following significant YoY growth in defaults, despite
          payment holidays, TERS support, relatively flat
          household cash flow and reduced interest rates

     •    Further payment holidays are not expected, but the
          announced extension of TERS plus improved
          economic activity should moderate the negative trend
          in Q3
78                                                                          TFG RESULTS PRESENTATION
                                                                       FOR THE SIX MONTHS ENDED 30 SEPTEMBER 2020
CREDIT KEY RATIOS
TFG AFRICA TFG AFRICA
Key indicators Sept 2020 Sept 2019 % change
Number of applications 503 613 1 119 000 -55,0%
Accept rates 9,1% 35,8%
Number of new accounts 45 885 400 807 -88,6%
Number of active accounts (‘000) 2 594,3 2 723,6 -4.7%
Credit turnover (Rm) 2 934,4 4 495,3 -34,7%
Credit sales growth % -34,7% -0,5%
Credit % of total turnover 35,5% 42,3%
Gross debtors’ book (Rm) 9 063,3 9 349,1 -3,1%
Overdue values % to debtors’ book 18,2% 14,1%
Buying position % 77,0% 82,4%
Gross bad debt write-off year-on-year growth -25,1% 20,2%
Net bad debt write-off as % of credit transactions (12-month rolling) 11,4% 8,6%
Recoveries year-on-year growth -17,4% -9,5%
Allowance for impairment at reporting date year-on-year growth 23,5% 12,7%
Allowance for impairment as % of debtors book 25,0% 19,7%
79 TFG RESULTS PRESENTATION
FOR THE SIX MONTHS ENDED 30 SEPTEMBER 2020BRAND OVERVIEW
BUSINESS OVERVIEW

                            UPPER MARKET
                   MID TO
            UPPER MARKET
          MID TO
          UPPER
          MARKET

                                     MID MARKET

                                            VALUE MARKET

81                                                      TFG RESULTS PRESENTATION
                                                    FOR THE SIX MONTHS ENDED 30 SEPTEMBER 2020
OUR FOOTPRINT
TFG INTERNATIONAL FOOTPRINT

                                     4 345
                                    TFG OUTLETS

                                         31
                                    COUNTRIES

          2 949                        861                        535
      TFG AFRICA OUTLETS        TFG LONDON OUTLETS
                                                           TFG AUSTRALIA OUTLETS

             66%                        16%                        18%
     Contribution to turnover   Contribution to turnover
                                                           Contribution to turnover

83                                                                          TFG RESULTS PRESENTATION
                                                                        FOR THE SIX MONTHS ENDED 30 SEPTEMBER 2020
OUR FOOTPRINT MOVEMENT SINCE
1 APRIL
2 567
Sept 20 (excl Jet)
861 Sept 20
2 582Sept 19
972 Sept 19
535Sept 20
3 963
Sept 20 (excl Jet)
512Sept 19
4 066 Sept 19
84 TFG RESULTS PRESENTATION
FOR THE SIX MONTHS ENDED 30 SEPTEMBER 2020TFG AFRICA FOOTPRINT
SOUTH AFRICA TOTAL STORES CONCESSION
Gauteng 802 802 0
COUNTRY TOTAL STORES CONCESSIONS
South Africa 2 758 2 758 0 Western Cape 460 460 0
Namibia 102 102 0 Kwazulu-Natal 338 338 0
Zambia 31 31 0 Eastern Cape 248 248 0
Botswana 30 30 0 Mpumulanga 240 240 0
Lesotho 12 12 0 Limpopo 233 233 0
Eswatini 12 12 0 Free State 172 172 0
Kenya 4 4 0 North West 163 163 0
Northern Cape 102 102 0
85 TFG RESULTS PRESENTATION
FOR THE SIX MONTHS ENDED 30 SEPTEMBER 2020TFG LONDON FOOTPRINT
EUROPE TOTAL STORES CONCESSIONS AUSTRALASIA TOTAL STORES CONCESSIONS
UK & Ireland 595 201 394 Hong Kong 20 18 2
Switzerland 42 6 36 Japan 8 0 8
Germany 49 0 49 Singapore 10 2 8
Spain 21 0 21 Australia 3 0 3
Netherlands 12 0 12 Macau 3 0 3
Sweden 9 1 8
Belgium 4 0 4
NORTH AFRICA TOTAL STORES CONCESSIONS
Estonia 2 0 2
UAE 7 0 7
Latvia 1 0 1
Kuwait 5 0 5
Saudi Arabia 7 0 7
NORTH AMERICA TOTAL STORES CONCESSIONS Qatar 5 0 5
USA 34 1 33 Bahrain 2 0 2
Mexico 21 0 21 Oman 1 0 1
86 TFG RESULTS PRESENTATION
FOR THE SIX MONTHS ENDED 30 SEPTEMBER 2020TFG AUSTRALIA FOOTPRINT
AUSTRALIA TOTAL STORES CONCESSIONS
Australia 505 480 25
New Zealand 30 30 0
87 TFG RESULTS PRESENTATION
FOR THE SIX MONTHS ENDED 30 SEPTEMBER 20202021
RESULTS HALF-
PRESENTATION YEAR
FOR THE HALF-YEAR ENDED
30 SEPTEMBER 2020You can also read