Tortoise forensics: conservation genetics of the leopard tortoise
←
→
Page content transcription
If your browser does not render page correctly, please read the page content below
SALAMANDRA 57(1): 139–145
Conservation genetics of Stigmochelys pardalis in southern Africa
SALAMANDRA
15 February 2021 ISSN 0036–3375 German Journal of Herpetology
Tortoise forensics: conservation genetics of the leopard tortoise
Stigmochelys pardalis in southern Africa
Urban Dajčman1,2, Margaretha D. Hofmeyr3, Paula Ribeiro Anunciação2,
Flora Ihlow2 & Melita Vamberger2
1)
University Ljubljana, Biotechnical Faculty, Department of Biology, Jamnikarjeva 101, 1000 Ljubljana, Slovenia
2)
Museum of Zoology, Senckenberg Dresden, A. B. Meyer Building, 01109 Dresden, Germany
3)
Chelonian Biodiversity and Conservation, Department of Biodiversity and Conservation Biology,
University of the Western Cape, Bellville 7535, South Africa
Corresponding author: Melita Vamberger, e-mail: melita.vamberger@senckenberg.de
Manuscript received: 22 June 2020
Accepted: 17 October 2020 by Edgar Lehr
Abstract. Sub-Saharan Africa harbours an outstanding diversity of tortoises of which the leopard tortoise Stigmochelys
pardalis is the most widespread. Across its’ range the species is impacted by habitat transformation, over-collection for hu-
man consumption and the pet trade, road mortality, and electrocution by electric fences. Most leopard tortoises in south-
ern Africa are nowadays restricted to reserves and private farms. So far confiscated tortoises are frequently released into a
nearby reserve without knowledge on their area of origin. This is problematic, as it has been demonstrated that the leopard
tortoise harbours five distinct mitochondrial lineages, of which three occur in the southern portion of the species’ distri-
butional range (South Africa, Namibia, and Botswana). Using 14 microsatellite loci corresponding to 270 samples collect-
ed throughout southern Africa, we found a clear substructuring in the north constituting four clusters (western, central,
north-eastern, and eastern). Genetic diversity was particularly high in the north-east and decreased towards the south. In
addition, we found a significant size difference between the studied populations. Our basic morphological analysis showed
that tortoises from the southern cluster tend to grow bigger than tortoises from the north. We established a comprehensive
genetic database for South Africa and Namibia that can serve as a conservation management tool for the assignment and
potential release of translocated or seized leopard tortoises based on genetic affiliation.
Key words. Conservation management, management units, microsatellites, Namibia, pet trade, sub-Saharan Africa, South
Africa, Testudinidae.
Introduction already disappeared from few areas in eastern and west-
ern South Africa (Hofmeyr & Baard 2014). Natural bush
Tortoises and turtles are among the most imperilled bio- fires and deliberate fires set to promote regrowth and in-
ta on the planet, with approximately 60.4% of 356 species crease forage quality for livestock account for a major pro-
threatened or recently extinct (Lovich et al. 2018, Turtle portion of injuries and mortalities (Kabugumila 2001),
Conservation Coalition 2018). Of 121 tortoises that ex- while severe droughts and road mortality also contribute
isted since the Pleistocene, 69 (57%) already disappeared to population decline (Boycott & Bourquin 2000). To-
(Lovich et al. 2018). The impacts that are responsible for day the vast majority of tortoises, including S. pardalis, are
this alarming situation include habitat destruction, cli- found on privately owned fenced farm land and reserves.
mate change, unsustainable overexploitation for human Unfortunately, their large body size and highly domed car-
consumption as well as for the international pet trade, and apace make leopard tortoises susceptible to being killed by
the introduction of pathogens (Wimberger et al. 2011, electric fences (Burger & Branch 1994, Arnot & Molteno
Lovich et al. 2018). These also apply to the leopard tortoise 2017, Macray 2017).
Stigmochelys pardalis (Bell, 1828) (Evans 1988). Between Recent molecular genetic analyses revealed the species to
1987 and 1991, S. pardalis accounted for 76% of tortoises constitute five distinct mitochondrial lineages (Spitzweg et
exported from Africa for the international pet trade and al. 2019). One is distributed in the south, a second in the
declines in some areas have been attributed to unsustain- north-west, and a third in the north-east of southern Africa,
able collection and trade (Branch 2012). Over the last five while two additional lineages are distributed further north
years 171,444 living S. pardalis, have been exported from (Spitzweg et al. 2019). Using microsatellites Spitzweg et al.
Africa for commercial purposes (CITES trade database (2019) revealed the southern mitochondrial clade to match
2020). As a consequence, the once widespread species is with a well-defined southern nuclear cluster, whilst the
now considered threatened in some regions, while it has north-western and north-eastern clades of southern Africa
© 2021 Deutsche Gesellschaft für Herpetologie und Terrarienkunde e.V. (DGHT), Mannheim, Germany
Open access at http://www.salamandra-journal.com 139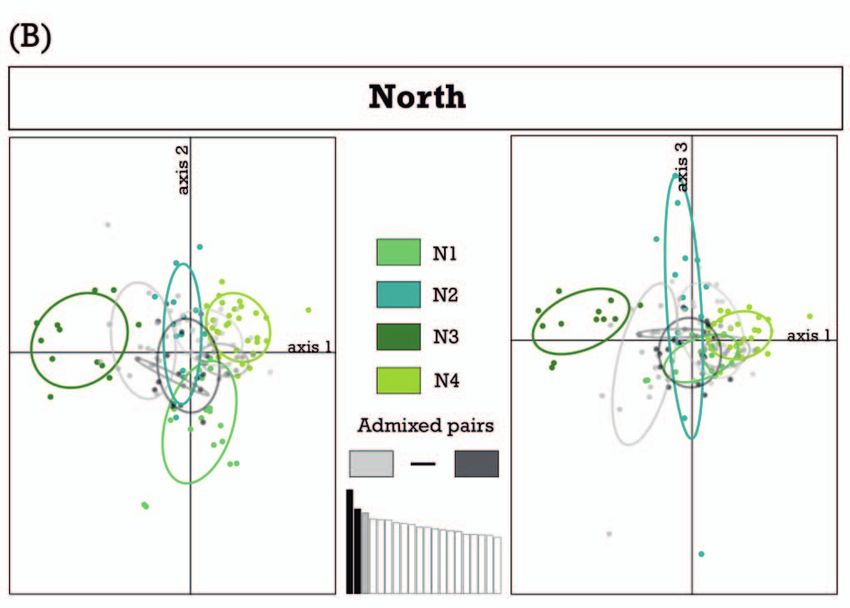
Urban Dajčman et al.
corresponded to another nuclear cluster with three subclus- STRUCTURE searches for partitions which are, as far as
ters. Besides the genetic diversity, the leopard tortoise ex- possible, in Hardy-Weinberg equilibrium and linkage equi-
presses considerable geographic variation in body size, shell librium. Unsupervised analyses were selected because this
shape, and colouration. Loveridge and Williams (1957) approach clusters samples strictly according to their genetic
attributed these differences to subspecies variation. How- information, without making presumptions about popula-
ever, the distribution of the mitochondrial lineages or the tion structuring (e.g. geographic distances, sampling sites).
respective nuclear clusters does not match with the recog- All calculations were performed for K = 1–10, and the most
nized subspecies (Fritz et al. 2010, Spitzweg et al. 2019). likely number of clusters (K) was determined using the ΔK
These findings demonstrate the importance of the applica- method (Evanno et al. 2005) as implemented in the soft-
tion of conservation genetic techniques to preserve the ge- ware STRUCTURE HARVESTER (Earl & von Holdt
netic diversity of the species. While previous studies suf- 2012) and mean Ln probabilities. Calculations were repeat-
fered from incomplete sampling in some areas (Spitzweg et ed 10 times for each K using a MCMC chain of 750,000
al. 2019) our present study adds crucial data from northern generations and a burn-in of 250,000 generations. Popu-
South Africa completing these sampling gaps. lation structuring and individual admixture were visual-
We examined the population structure and reveal ge- ized using DISTRUCT 1.1 (Rosenberg 2004). Individuals
netic differentiation of S. pardalis using fine scale analyses with a membership proportion below 80% were considered
of nuclear microsatellite markers. We deliver an essential to have admixed ancestries (Barilani et al. 2007, Randi
database for future conservation relocation practices that 2008). STRUCTURE is prone to bias from uneven sample
will improve the conservation management and preserva- sizes (Puechmaille 2016) and typically detects only the
tion of the genetic diversity of S. pardalis. uppermost hierarchical level of population differentiation
(Evanno et al. 2005). Therefore, the analysis was repeated
for subsamples corresponding to previously identified clus-
Material and methods ters but excluding admixed individuals (Supplementary
Sampling, selection of microsatellite loci, document S1). In addition, STRUCTURE was repeated for
and general data evaluation strategy each of the respective subclusters of the northern cluster.
Further, Principal Component Analyses (PCAs) were
In total, 270 leopard tortoises from all across South Africa, performed to examine population structuring using mi-
adjacent Namibia, and southern Mozambique were studied crosatellite data and the package ADEGENET (Jombart
(Supplementary document S1). These include 204 speci 2008) for Cran R 3.2.3 (R Development Core Team 2015).
mens previously sampled (Spitzweg et al. 2019). For genet- PCAs are less sensitive to sample size and are independ-
ic analyses, a small amount of blood or tissue was collected ent from population genetic assumptions (Puechmaille
from live tortoises in accordance with methods approved 2016). Two distinct PCAs were executed. In the first anal-
by the Ethics Committee of the University of the Western ysis, all 270 individuals were included, and symbols were
Cape (Ethics Reference Number (AR 19/4/1). All speci- coloured after STRUCTURE clusters (north, south, ad-
mens were subsequently released at their respective col- mixed). The second PCA included only the tortoises from
lection site. Blood samples were preserved on FTA classic the northern STRUCTURE cluster (151 individuals), with
cards (Whatman, GE Healthcare, Munich, Germany) and symbol colours corresponding to STRUCTURE subclus-
stored at room temperature. For most tortoises sampled in ters (N1, N2, N3, N4, Admixed).
South Africa, the carapace length (CL) was measured to
the nearest 1 mm using a measuring tape. Fieldwork and
sampling in South Africa was permitted by the Limpopo Diversity within and divergence
Provincial Government (ZA/LP/91608), the Department of between population clusters
Environmental Affairs, Biodiversity Northern Cape Prov-
ince (245/2015), Ezemvelo KZN Wildlife (OP 139/2017), and Diversity and divergence were estimated for population clus-
Biodiversity North West Province (NW 6124/10/2018). ters revealed by STRUCTURE. A frequency table for mic-
The same 14 nuclear microsatellite loci were targeted as rosatellite alleles was produced using COVERT 1.31 (Glau-
in our previous study on S. pardalis (Spitzweg et al. 2019). bitz 2004). ARLEQUIN 3.5.2.1 (Excoffier & Lischer
For DNA extraction, PCR, and genotyping information see 2010) was applied to infer locus specific observed (HO) and
Spitzweg et al. 2019. expected (HE) heterozygosity and to perform AMOVAs
(10,000 permutations) for microsatellite clusters revealed
by STRUCTURE. FSTAT 2.9.3.2 (Goudet 1995) was used
Data analyses to compute values for locus specific allelic richness.
For conservation genetic purposes microsatellite data
of 270 leopard tortoises were analysed using the unsu- Morphology
pervised Bayesian clustering approach of STRUCTURE
2.3.4 (Pritchard et al. 2000, Hubisz et al. 2009), apply- Data on carapace length (CL) of 137 adult tortoises was an-
ing the admixture model and correlated allele frequencies. alysed using the packages DPLYR (Wickham et al. 2019),
140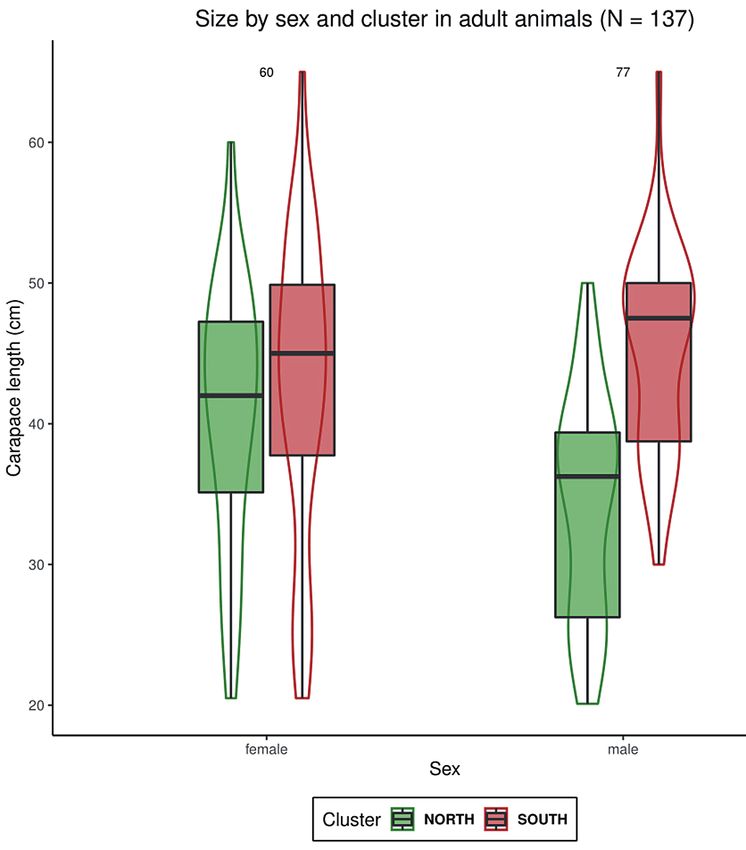
Conservation genetics of Stigmochelys pardalis in southern Africa
TIDYR (Wickham & Henry 2019), and MULTCOMP was only observed in a few sites in the Provinces Western
(Hothorn et al. 2008) and visualized using the packag- Cape, Northern Cape, and North West (grey coloured sec-
es GGPLOT2 (Wickham 2016), GGTHEMES (Arnold tion of pie charts; Supplementary document S2). In addi-
2019), and KNITR (Xie 2019) for Cran R 3.2.3. A two-way tion, tortoises from both clusters were found to live in close
ANOVA was applied using main genetic clusters identified proximity to each other in several localities (Supplemen-
by STRUCTURE (south/north) and sex as fixed effects to tary document S2).
test for significant difference in carapace length (response Additional STRUCTURE runs for each of the two clus-
variable). Subsequently, differences were identified using a ters excluding admixed individuals revealed K = 1 as the best
Tukey HSD test (Dubitzky et al. 2013). solution for the southern cluster but suggested further struc-
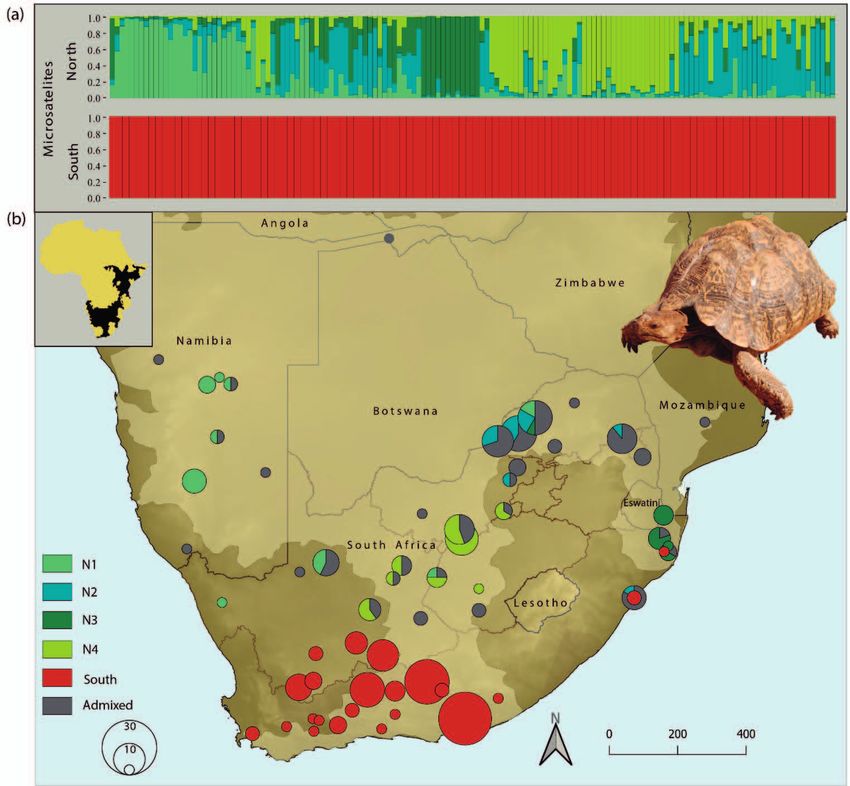
turing for the northern subset (K = 4; Fig. 1, Supplementary
document S1). Thus, the northern subset (Fig. 1b: N1) includ-
Results ed a cluster corresponding to samples from Namibia and
Population structuring the South African Northern Cape Province. Two additional
clusters (Fig. 1b: N2, N4) contained samples from central-
Using all samples (N = 270) STRUCTURE revealed two southern Africa with a clear north–south separation. The
clusters as the best solution (Supplementary documents S2, fourth cluster (Fig. 1b: N3) corresponded to a smaller area in
S3), one corresponding to southern sampling sites and the the north-east of South Africa, and southern Mozambique.
other to more northern sites within South Africa, adjacent A high number of tortoises from central and north-eastern
Namibia, and southern Mozambique. Admixed ancestry South Africa showed admixed ancestries (Fig. 1b).
Figure 1. a) Genotypic clustering of the two subsets (northern and southern, excluding admixed individuals) as inferred by STRUC-
TURE. The runs with the best probability values are shown. Distinct clusters are colour coded corresponding to STRUCTURE inferred
clusters (see b). Within each cluster an individual is represented by a vertical bar that reflects its ancestry. Mixed ancestry is indicated
by differently coloured segments corresponding to inferred genetic percentages of the respective cluster. b) The distribution range
of S. pardalis is displayed as shaded area according to Baker et al. 2015 and Spitzweg et al. 2019. Individual sampling sites were
lumped for clarity. Symbol sizes refer to the respective sample size. Slices represent percentages of individuals with mixed ancestries
or conflicting cluster assignments. For original sites see Supplementary document S1. Inset shows the whole putative distributional
range (black) of Stigmochelys pardalis according to TTWG (2017).
141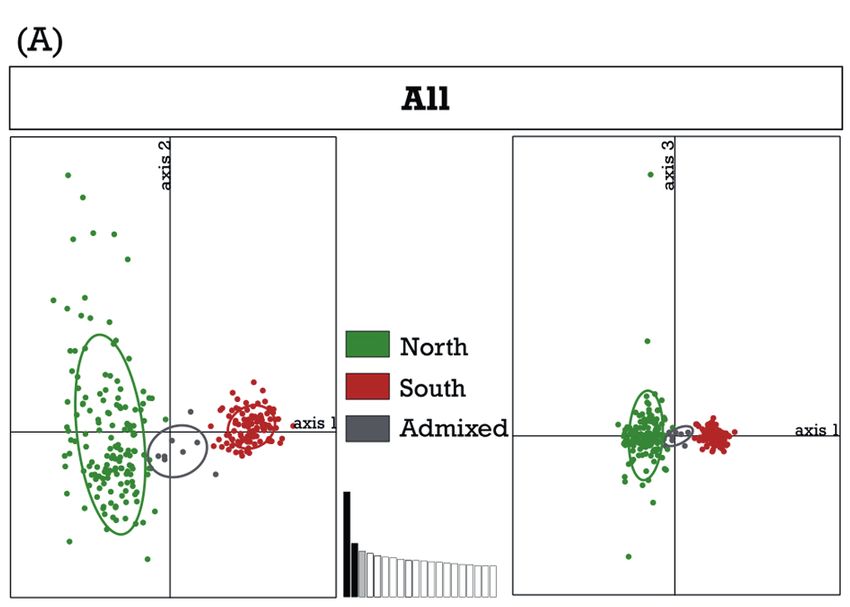
Urban Dajčman et al.

   STRUCTURE runs for each of the four clusters of the            Table 1. Genetic diversity of STRUCTURE clusters excluding
northern subset revealed K = 1 as the best solution in all        admixed individuals. n – number of individuals; nA – number
four runs (Supplementary document S4). Therefore, no ad-          of alleles; nĀ –average number of alleles per locus; nP – number
ditional substructure could be found in the north.                of private alleles; AR – allelic richness; HO – average observed
                                                                  heterozygosity; HE – average expected heterozygosity.
   Principal Component Analyses (PCAs) supported the
results of the STRUCTURE runs and the near absence of
admixture between tortoises of the northern and southern           Cluster     n      nA     nĀ     nP     AR      HO       HE
cluster, but indicated a high level of admixture between the       North      151    130   18.6    138   17.611   0.709    0.803
four clusters of the northern subset (Fig. 2).                     South      110    261    9.3      7    9.237   0.549    0.622
                                                                   N1          19    117    8.4     17    7.245   0.748    0.784
                                                                   N2          15    151   10.8     28    9.954   0.773    0.841
              Diversity within and divergence
                                                                   N3          12     95    6.8      8    6.786   0.685    0.721
               between structure clusters
                                                                   N4          28    134    9.6     22    9.297   0.675    0.743
In agreement with its nuclear genomic substructuring
(Supplementary document S1, 2), genetic diversity was             to 0.107 (Table 2). In accordance, an AMOVA for the north-
higher among tortoises from the northern cluster than it          ern and southern clusters revealed 14.49% of the molecular
was in the south (Table 1). However, despite similar sample       variance to occur among and 85.51% within the two clusters.
sizes, the northern cluster had a higher haplotype diver-         Regarding the northern subclusters N1–N4 (Fig. 1) only
sity. For microsatellites the average number of alleles per       6.24% of the molecular variance was found to occur among,
locus (nĀ = 18.6) in the north was twice as high as for the       while 93.76% of variance occurred within subclusters.
southern cluster (nĀ = 9.3). The northern cluster had al-
most twenty times more private alleles (np = 138) compared
to the southern cluster (np = 7). The observed pattern was                                 Morphology
also reflected by a higher heterozygosity in the north (HO =
0.709) than in the south (HO = 0.549).                            A two-way ANOVA was conducted that examined the ef-
    When comparing the four clusters of the northern sub-         fect of genetic cluster and sex on body size of 137 S. parda-
set (N1–N4, Fig. 1) the highest genetic diversity was ob-         lis. The northern cluster was composed of 42 males (mean
served within subcluster N2. With an average of 10.8, sub-        CL = 34.3 ± 7.9 cm SD) and 28 females (mean CL = 40.8 ±
cluster N2 had the highest number of alleles per locus, fol-      9.3 cm SD) whereas the southern cluster contained 35
lowed by subcluster N4 (9.6), N1 (8.4), and N3 (6.8). In          males (mean CL = 45.4 ± 7.3 cm SD) and 32 females (mean
concordance, subcluster N2 also had the highest number            CL 42.7 ± 10.9 cm SD). We found a statistically significant
of private alleles (np = 28) while subcluster N3 had the low-     difference in carapace length between clusters (nsouthern = 67,
est (np = 8).                                                     nnorthern = 70; two-way ANOVA: F (1) = 22.79, p = > 0.001)
    The two main clusters (northern and southern, Sup-            but not in sexes (nmales = 77, nfemales = 60; two-way ANO-
plementary document S2) differed by an FST value of 0.145         VA: F (1) = 1.50, p = 0.236). A subsequent Tukey HSD post
(p < 0.05) while the northern subclusters N1–N4 (Fig. 1) dif-     hoc test based on the results of the ANOVA interaction be-
fered by substantially lower FST values ranging from 0.039        tween location and sex (F (1) = 9.04, p = > 0.01) revealed

Figure 2. Principal Component Analyses (PCAs) using microsatellite data of A) 270 individuals (all samples) and B) 151 individuals
of the northern cluster coloured according to STRUCTURE results. For A) axes 1–3 explain 10.25%, 5.22%, and 4.47% of variance;
for B) axes 1–3 explain 6.45%, 5.27% and 5.01%, respectively. Ovals indicate 95% confidence intervals.

142
Conservation genetics of Stigmochelys pardalis in southern Africa
Table 2. Fixation indices (FST values) for microsatellite data of the support a natural occurrence in this region. In addition,
northern subclusters N1–N4 (Fig. 2). All values are statistically we investigated the geographic variation in body size due
significant (p < 0.05). to the observations of Loveridge and Williams (1957).
We demonstrate a pronounced geographic variation in
N1 N2 N3 carapace length of male tortoises between the two major
N2 0.039 – microsatellite clusters from the north and south (Fig. 3).
Males of the southern cluster reach carapace lengths of up
N3 0.093 0.051 –
to 65 cm (mean CL = 45.4 ± 7.3 cm SD) while males from
N4 0.059 0.031 0.107
the northern cluster stay significantly smaller (max CL =
50 cm, mean = 34.3 ± 7.9 cm SD; Fig. 3). Although S. par-
that male tortoises from the southern cluster were signifi- dalis females generally grow larger than males (Branch
cantly larger (Tukey HSD test, p < 0.001) than male tor- 2012) we could not confirm a significant difference in cara-
toises from the northern cluster (Fig. 3). In contrast no pace length between southern and northern females. Most
significant difference was observed between northern and probably a combination of environmental factors such as
southern female tortoises (Tukey HSD test p = 0.84). With- aridity, seasonality, and food availability are responsible for
in the northern cluster, females were found to be signifi- shaping the morphological variation in S. pardalis. Simi-
cantly larger (Tukey HSD test p = 0.02) than males while larly, Loehr et al. (2007) reported aridification to be cor-
no intersexual difference could be demonstrated between related with lower average and maximum body size in fe-
females and males from the southern cluster (Tukey HSD males of the world’s smallest tortoise, Chersobius signatus.
test p = 0.59). It is important to determine the geographic origin of
seized leopard tortoises, as they can be locally adapted to
a specific climate and might not survive non-analogous en-
Discussion vironmental conditions as demonstrated by Wimberger
et al. (2009). Our basic morphological analyses show that
In recent years wildlife forensics became a key means of body size is not necessarily a proxy for geographic origin,
enforcing legislation surrounding the illegal trade in pro- even though considerable geographic variation was expect-
tected and threatened species (Mucci et al. 2014, Ogden & ed (Loveridge & Williams 1957). Furthermore, releasing
Linacre 2015), which also holds true in South Africa. How- animals from different genetic clusters in inappropriate re-
ever, the identification of the geographic origin of seized
animals is based on our ability to assign a sample to a par-
ticular population. This requires the source population to
be sufficiently genetically distinct from other populations
and is usually reliant on the existence of population data
from multiple geographic areas (Ogden & Linacre 2015).
Our study provides a comprehensive genetic database for
wildlife forensics of translocated or seized leopard tortois-
es in southern Africa developed in collaboration with the
South African National Biodiversity Institute (SANBI) and
the Gauteng Department of Agriculture and Rural Devel-
opment (GDARD). Compared to Spitzweg et al. (2019),
our sampling covers the whole distribution range of S. par-
dalis in South Africa, closing previous sampling gaps in
central and northern South Africa. Here, we confirm the
pronounced north–south genetic differentiation in south-
ern African leopard tortoises reported by Spitzweg et al.
(2019) (Supplementary document S2) and demonstrate the
distribution of the southern cluster to stretch further to the
north than anticipated. According to Baker et al. (2015)
there is a major distribution gap for leopard tortoises in the
western part of the Northern Cape Province and the north-
western part of the Western Cape Province. However, we
confirmed S. pardalis from the southern parts of the North-
ern Cape Province, well within the proposed distributional
gap, and reveal these tortoises to belong to the southern
cluster (Supplementary document S2). Even though many Figure 3. Differences in carapace length of females and males
herpetologists believe that S. pardalis has been introduced from the major microsatellite clusters (south and north). Box-
in western South Africa (Hofmeyr & Baard 2014), our re- plots show median, minimum, and maximum. Violin plots show
sults and field observations (confirming viable population) the probability density of data.
143Urban Dajčman et al.
gions can result in extinction or genetic pollution of local len, K. von de Merwe, L. Fourié, T. Nimeng, K. Coetzee, R.
gene pools (Butler 1994, Fitzpatrick & Shaffer 2007). and J. van Loggerenberg, A. and C. van Niekerk, Q. Krüger,
A similar case was suspected in France where certain popu- J. Gers, A. Jordaan (Sand Spoor Safaris), R. Schulenburg, M.
Chokwe (Masebe Nature Reserve), E. and D. Nel (Segodi Game
lations of the European pond turtle Emys orbicularis appear Lodge), Bovlei farm, Kanariesfontein farm (Louisa and her fam-
to be polluted with genes from Italian populations (Vam- ily), Blaukranz farm, Reneyke farm who supported us logistical-
berger et al. 2015), but the impact has not been investi- ly during fieldwork and allowed sampling on their properties. We
gated. While our results are in agreement with Spitzweg et thank all the nature reserves (Athestone, Boskop Dam, Bloemhof,
al. (2019) in finding no substructuring in the southern clus- D’Nyala, Highveld, Kgaswane, Leshiba Wilderness, Mokolo Dam,
ter (Fig. 1), our increased sampling revealed the northern Vaalkop Dam) who kindly permitted sampling, and provided rang-
cluster to harbour an additional fourth subcluster (N4) in- ers or accommodation during field work.
stead of three as previously assumed (Spitzweg et al. 2019).
The additional subcluster occurs in the eastern part of the References
Northern Cape, throughout the Free State, and in the south-
ern part of the North West Province of South Africa (Fig. 1). Arnold, J. B. (2019): ggthemes: Extra Themes, Scales and Geoms
A high number of tortoises sampled in central and north- for ‘ggplot2’. – R package version 4.2.0.
eastern South Africa show admixed ancestries (Fig. 1; grey Arnot, L. & S. Molteno (2017): How to reduce tortoise electro-
coloured sections of pie charts). The reason for this may be cution mortalities. – Farmer’s Weekly, 17004: 36–38. – Avail-
the close proximity to the O. R. Tambo International Air- able at https://www.farmersweekly.co.za/animals/game-and-
port in Johannesburg, where tortoises are frequently confis- wildlife/reduce-tortoise-electrocution-mortalities/, accessed
cated and released nearby. The phylogeographic pattern of 07.02.2020.
S. pardalis parallels with that of the puff adder Bitis arietans Baker, P. J., J. Kabigumila, T. Leuteritz, M. Hofmeyr & J. M.
(Barlow et al. 2013) and freshwater terrapins of the genus Ngwava (2015): Stigmochelys pardalis. – The IUCN Red List of
Threatened Species, e.T163449A1009442.
Pelomedusa (Vamberger et al. 2018) supporting a natu-
ral distribution pattern. The distribution of the southern Barilani, M., A. Sfougaris, A. Giannakopoulos, N. Mucci,
C. Tabarroni, & E. Randi (2007): Detecting introgressive hy-
cluster of S. pardalis corresponds well with subclade Ic of bridisation in rock partridge populations (Alectoris graeca) in
Pelomedusa galeata, while the northern subclusters N3 and Greece through Bayesian admixture analyses of multilocus gen-
N4 correspond to Pelomedusa subclades Ib and Ia (Vam- otypes. – Conservation Genetics, 8: 343–354.
berger et al. 2018). The northern subclusters N1 and N2 Barlow A., K. Baker, C. R. Hendry, L. Peppin, T. Phelps, K. A.
mirror the distribution of Pelomedusa subrufa (Vamber Tolley, C. A. Wüster & W. Wüster (2013): Phylogeography of
ger et al. 2018). Stigmochelys pardalis is one component of the widespread African puff adder (Bitis arietans) reveals mul-
the South African biota whose phylogeographic structure tiple Pleistocene refugia in southern Africa. – Molecular ecolo
was shaped by physiography and climate, as has also been gy, 22: 1134–1157.
demonstrated for Pelomedusa (Vamberger et al. 2018). To Boycott, R. C. & O. Bourquin (2000): The southern African tor-
preserve the genetic diversity and geographic structure of toise book: A guide to southern African tortoises, terrapins and
S. pardalis, we propose five management units for southern turtles. – Privately published, KwaZulu–Natal, South Africa.
Africa. These correspond to the two major microsatellite Branch, B. (2012): Tortoises, terrapins & turtles of Africa. − Pen-
clusters and the northern subclusters N1–N4 (Fig. 1). Using guin Random House, South Africa.
our genetic database, the confiscated tortoises should be ge- Burger, M. & W. R. Branch (1994): Tortoises mortality caused by
netically tested and assigned to one of the five microsatellite electrified fences in the Thomas Baines Nature Reserve. – South
clusters before being considered for reintroduction into the African Journal of Wildlife Research, 24: 32–37.
wild. If assignment to a genetic cluster is successful, release Butler, D. (1994): Bid to protect wolves from genetic pollution.
in a safe location within the distributional boundaries of – Nature, 370: 497–497.
the correct genetic cluster can be considered. However, a CITES Trade Database – UNEP World Conservation Monitoring
suitable release protocol should include a thorough pre-re- Centre, Cambridge, UK. – Available at https://trade.cites.org,
accessed 21.09.2020.
lease health screening to prevent the introduction of patho-
gens into wild populations (Wimberger et al. 2011). This Dubitzky, W., O. Wolkenhauer, K. H. Cho & H. Yokota (2013):
Encyclopedia of Systems Biology. − Springer, New York, USA.
study represents the foundation for further conservation
management decisions and future conservation actions for Earl, D. A. & B. M. von Holdt (2012): Structure harvester: A
website and program for visualizing structure output and im-
leopard tortoises in southern Africa.
plementing the Evanno method. – Conservation Genetics Re-
sources, 4: 359–361.
Acknowledgements Evanno, G., S. Regnaut & J. Goudet (2005): Detecting the
number of clusters of individuals using the software structure:
This work was funded by the Deutsche Gesellschaft für Herpeto A simulation study. – Molecular Ecology, 14: 2611–2620.
logie und Terrarienkunde (German Society for Herpetology and Evans, D. (1988): Leopard tortoise – Geochelone pardalis (Bell,
Herpetoculture; DGHT), the British Chelonia Group (BCG) and 1828). – pp. 5–11 in: Luxmoore, R., B. Groombridge, & S.
the Mapula trust. We would like to thank the SGN-SNSD-Mol-Lab, Broad (eds): Significant trade in wildlife: A review of selected
P. and E. Naude (Die Ark), R. Bartholomew, H. van Niekerk, species in CITES Appendix II. Volume 2: Reptiles and inverte-
B. and R. Steenkamp, N. and A. van Zyl, A. and C. F. Verneu- brates – IUCN, Cambridge, UK.
144Conservation genetics of Stigmochelys pardalis in southern Africa
Excoffier, L. & H. Lischer (2010): Arlequin suite ver 3.5: a new se- R Development Core Team (2015). R: A language and environment
ries of programs to perform population genetics analyses under for statistical computing. – R Foundation for Statistical Com-
Linux and Windows. – Molecular Ecology Resources, 10: 564–567. puting, Vienna, Austria.
Fitzpatrick, B. M. & H. B. Shaffer (2007): Hybrid vigor between Randi, E. (2008): Detecting hybridization between wild species
native and introduced salamanders raises new challenges for and their domesticated relatives. – Molecular Ecology, 17: 285–
conservation. – Proceedings of the National Academy of Sci- 293.
ences, 104: 15793–15798. Rosenberg, N. A. (2004): Distruct: A program for the graphical
Fritz, U., S. R. Daniels, M. D. Hofmeyr, J. González, C. L. Bar- display of population structure. – Molecular Ecology Notes, 4:
rio–Amorós, P. Široký & H. Stuckas (2010): Mitochondrial 137–138.
phylogeography and subspecies of the wide-ranging sub-Saha- Spitzweg, C., M. D. Hofmeyr, U. Fritz & M. Vamberger (2019):
ran leopard tortoise Stigmochelys pardalis (Testudines: Testudi- Leopard tortoises in southern Africa have greater genetic diver-
nidae) – a case study for the pitfalls of pseudogenes and Gen- sity in the north than in the south (Testudinidae). – Zoologica
Bank sequences. – Journal of Zoological Systematics and Evo- Scripta, 48: 57–68.
lutionary Research, 48: 348–359.
TTWG [Turtle Taxonomy Working Group: Rhodin, A. G. J., J. B.
Glaubitz, J. C. (2004): Convert: A user friendly program to refor- Iverson, R. Bour, U. Fritz, A. Georges, H. B. Shaffer & P. P.
mat diploid genotypic data for commonly used population ge- van Dijk] (2017): Turtles of the world: Annotated checklist and
netic software packages. – Molecular Ecology Notes, 4: 309–310. atlas of taxonomy, synonymy, distribution, and conservation
Goudet, J. (1995): Fstat (Version 1.2): A computer program to cal- status (8th ed.). − Chelonian Research Monographs 7: 1–292.
culate F statistics. – Journal of Heredity, 86: 485–486. Turtle Conservation Coalition (2018): Turtles in trouble: The
Hofmeyr, M. D. & H. W. B. Baard (2014): Stigmochelys pardalis world’s 25+ most endangered tortoises and freshwater turtles.
(Bell, 1828) Leopard Tortoise; Mountain Tortoise. – pp. 84–85 Report, 2. − Hemlock Printers, Canada, 84 pp.
in: Bates, M. F., W. R. Branch, A. M. Bauer, M. Burger, J. Vamberger, M., H. Stuckas, F. Sacco, S. D'Angelo, M. Ar-
Marais, G. J. Alexander & M. S. de Villiers: Atlas and Red culeo, M. Cheylan & U. Fritz (2015): Differences in gene flow
List of the Reptiles of South Africa, Lesotho and Swaziland – in a twofold secondary contact zone of pond turtles in southern
South African National Biodiversity Institute, South Africa. Italy (Testudines: Emydidae: Emys orbicularis galloitalica, E. o.
Hothorn, T., F. Bretz & P. Westfall (2008): Simultaneous infer- hellenica, E. trinacris). – Zoologica Scripta, 44: 233–249.
ence in general parametric models. – Biometrical Journal, 50: Vamberger M., M. D. Hofmeyr, F. Ihlow & U. Fritz (2018):
346–363. In quest of contact: phylogeography of helmeted terrapins
Hubisz, M. J., D. Falush, M. Stephens & J. K. Pritchard (2009): (Pelomedusa galeata, P. subrufa sensu stricto). – PeerJ 6: e4901,
Inferring weak population structure with the assistance of sample doi.org/10.7717/peerj.4901.
group information. – Molecular Ecology Resources, 9: 1322–1332. Wickham, H. & L. Henry (2019): tidyr: Easily Tidy Data with
Jombart, T. (2008): Adegenet: A R package for the multivariate ‘spread()’ and ‘gather()’ Functions. – R package version 0.8.3.
analysis of genetic markers. – Bioinformatics, 24: 1403–1405. Wickham, H., R. François, L. Henry & K. Müller (2019): dplyr:
Kabugumila, J. (2001): Incidence of injuries and mortality in the A grammar of data manipulation. – R package version 0.8.3.
leopard tortoise, Geochelone pardalis, in northern Tanzania. – Wickham, H. (2016): ggplot2: Elegant graphics for data analysis. –
Tanzania Journal of Science, 27: 101–106. Springer Verlag, New York, USA.
Loehr, V. J. T., M. D. Hofmeyr & B. T. Henen (2007): Growing Wimberger, K., A. J. Armstrong & C. T. Downs (2009): Can re-
and shrinking in the smallest tortoise, Homopus signatus signa- habilitated leopard tortoises, Stigmochelys pardalis, be success-
tus: the importance of rain. – Oecologia, 153: 479–488. fully released into the wild? – Chelonian Conservation and Bi-
Loveridge, A. & E. E. Williams (1957): Revision of the African ology, 8: 173–184.
tortoises and turtles of the suborder Cryptodira. – Bulletin of Wimberger, K., A. J. Armstrong & M. Penning (2011): Health
the Museum of Comparative Zoology, Harvard, 115: 161–557. checks of rehabilitated leopard tortoise, Stigmochelys pardalis,
Lovich, J. E., J. R. Ennen, M. Agha & J. Whitfield Gibbons before release into the wild. African Journal of Wildlife Re-
(2018): Where have all the turtles gone, and why does it matter? search, 41: 229–235.
– BioScience, 68: 771–781. Xie, Y. (2019): knitr: A general-purpose Tool for dynamic report
Macray, M. B. (2017): Tortoise mortalities along fences in the generation in R. – R package version 1.23.
south eastern Karoo, South Africa. – Dissertation. University of
Cape Town, South Africa.
Supplementary data
Mucci, N., C. Mengoni & E. Randi (2014): Wildlife DNA foren-
sics against crime: Resolution of a case of tortoise theft. – Foren-
sic Science International: Genetics, 8: 200–202. The following data are available online:
Ogden, R. & A. Linacre (2015): Wildlife forensic science: A review Supplementary document S1. Samples of Stigmochelys pardalis
of genetic geographic origin assignment. – Forensic Science In- used in the present study.
ternational: Genetics, 18: 152–159. Supplementary document S2. Genotypic clustering of 270 leopard
Pritchard, J. K., M. Stephens & P. Donnelly (2000): Inference tortoises (Stigmochelys pardalis) from 66 sites.
of population structure using multilocus genotype data. – Ge- Supplementary document S3. Delta K and Ln P values for STRUC-
netics, 155: 945–959. TURE runs for the complete data set and for each of the two clus-
Puechmaille, S. J. (2016): The program structure does not reli- ters, South and North, separately.
ably recover the correct population structure when sampling is Supplementary document S4. Delta K and Ln P values for STRUC-
uneven: subsampling and new estimators alleviate the problem. TURE runs for each northern subcluster (N1–N4) separately.
– Molecular Ecology Resources, 16: 608–627.
145You can also read