Bats as putative Zaire ebolavirus reservoir hosts and their habitat suitability in Africa - Nature
←
→
Page content transcription
If your browser does not render page correctly, please read the page content below
www.nature.com/scientificreports
OPEN Bats as putative Zaire ebolavirus
reservoir hosts and their habitat
suitability in Africa
1*
Lisa K. Koch , Sarah Cunze1, Judith Kochmann2 & Sven Klimpel1,2
The genus Ebolavirus comprises some of the deadliest viruses for primates and humans and associated
disease outbreaks are increasing in Africa. Different evidence suggests that bats are putative reservoir
hosts and play a major role in the transmission cycle of these filoviruses. Thus, detailed knowledge
about their distribution might improve risk estimations of where future disease outbreaks might occur.
A MaxEnt niche modelling approach based on climatic variables and land cover was used to investigate
the potential distribution of 9 bat species associated to the Zaire ebolavirus. This viral species has led
to major Ebola outbreaks in Africa and is known for causing high mortalities. Modelling results suggest
suitable areas mainly in the areas near the coasts of West Africa with extensions into Central Africa,
where almost all of the 9 species studied find suitable habitat conditions. Previous spillover events and
outbreak sites of the virus are covered by the modelled distribution of 3 bat species that have been
tested positive for the virus not only using serology tests but also PCR methods. Modelling the habitat
suitability of the bats is an important step that can benefit public information campaigns and may
ultimately help control future outbreaks of the disease.
Today, many infectious diseases occurring in humans are zoonotic and originate from infected wild a nimals1.
Among these emerging diseases, diseases caused by filoviruses pose major health threats, since these viruses
belong to the most lethal primate pathogens with average death rates of 50%2,3. In recent years, the genus Ebola-
virus has gained much attention. The genus Ebolavirus was first identified in 1976 in the area of present-day
Democratic Republic of the Congo (near the Ebola River) and the species of this genus are endemic in at least
14 African countries today.
Until today, five viral species of the genus Ebolavirus, namely the Zaire ebolavirus (ZEBOV), the Sudan ebola-
virus, the Taï Forest ebolavirus, the Bundibugyo ebolavirus and the Reston ebolavirus are known. While the first
four species are assumed to be endemic to Africa and have led to numerous disease outbreaks in several African
countries so far4,5, Reston ebolavirus is probably native to Asian countries, e.g. the Philippines and China3,6,7.
Similar to the Marburg virus, the different species within the genus Ebolavirus, except Reston ebolavirus, cause
haemorrhagic fever, which includes various symptoms like fever, vomiting, diarrhoea and muscle p ain4,8.
Besides their common symptoms, the five viral species differ in their pathogenicity, from asymptotic infections
caused by Reston ebolavirus in humans to high mortality rates of up to 77–88% in case of ZEBOV i nfections6,9–11.
The largest outbreak of the Ebola virus disease (EVD) until today occurred in Western Africa between 2014
and 2016. Starting in December 2013 with a probable spillover of the virus from infected b ats12, the epidemic
spread to other parts of Africa. The largest impact and number of EVD cases were recorded in Guinea, Sierra
Leone and Liberia. During this epidemic, over 15,000 laboratory-confirmed Ebola cases and over 11,000 deaths
were reported4,8. In addition, the outbreak that has started in 2018 in the Democratic Republic of the Congo
(North Kivu Province) and the surrounding countries evidently suggests that rapid surveys and further inves-
tigations are ever more relevant. Single Ebola cases have also been reported from Europe (e.g. Spain or the
Netherlands) and the U SA5,8 and can be linked to previous stays or aid missions in the affected areas.
Until today, the transmission cycle of ZEBOV, especially within the animal reservoirs, has not been fully
understood. Although many of the human Ebola outbreaks in Africa can be linked to infected great apes and
duikers, these animals are not regarded as the natural reservoir hosts of the virus due to their high mortality
rates6,13,14. Since the virus’ first detection more than 40 years ago, a number of possible reservoir hosts (including
1
Institute for Ecology, Evolution and Diversity, Goethe-University, Max‑von‑Laue‑Str. 13, 60438 Frankfurt/Main,
Germany. 2Senckenberg Biodiversity and Climate Research Centre, Senckenberg Gesellschaft für Naturforschung,
60438 Frankfurt/Main, Germany. *email: l.koch@bio.uni‑frankfurt.de
Scientific Reports | (2020) 10:14268 | https://doi.org/10.1038/s41598-020-71226-0 1
Vol.:(0123456789)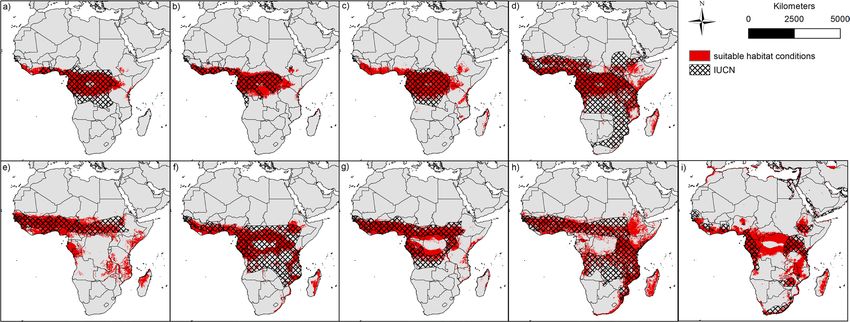
www.nature.com/scientificreports/
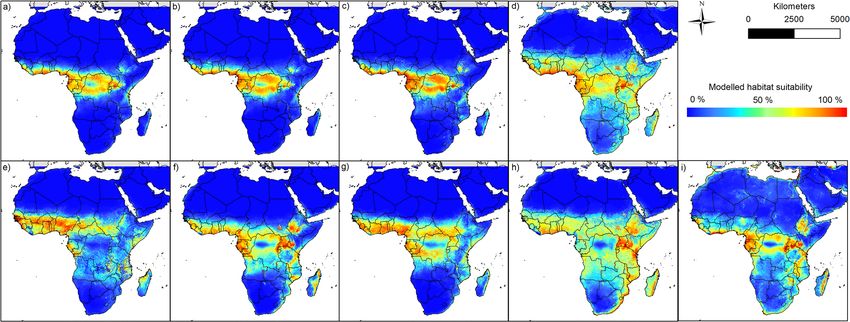
Figure 1. Multi-coloured modelling results of the nine bat species: (a) Epomops franqueti, (b) Hypsignathus
monstrosus, (c) Myonycteris torquata, (d) Eidolon helvum, (e) Epomophorus gambianus, (f) Lissonycteris
angolensis, (g) Micropteropus pusillus, (h) Mops condylurus, (i) Rousettus aegyptiacus. The maps were generated
using Esri ArcGIS 10.6 (https://www.esri.com/en-us/home)67.
bats, birds, reptiles, molluscs, arthropods and plants) have been under consideration for potential reservoir
hosts5,6,15,16. Peterson et al. suggested that an Ebola reservoir host is likely to be a small mammal, which would not
show many s ymptoms17. Additionally, some studies revealed that among mammalian taxa (with the exception of
rodents), bats seem to be a major reservoir hosts bearing a large number of zoonotic pathogens, e.g. viruses like
the Marburg virus or Hendra and Nipah v iruses18,19. In particular, the long-term infection and asymptomatic
survival following an infection with the virus is considered a key aspect for reservoir hosts and may indicate a
co-evolution between the reservoir and the v irus13,17,19,20. In a laboratory experiment by Swanepoel et al., the
authors showed that while plants, reptiles, invertebrates and some vertebrates had been refractory to the infec-
tions in experimental inoculation, ZEBOV was able to replicate in three bat species (Tadarida condylura (= Mops
condylurus), T. pumila, and Epomophorus wahlbergi)6. In additional laboratory experiments, the authors could
also isolate the virus in the faeces of these bats 21 days after the inoculation of the virus6. Until today, antibodies
against the different Ebola species have been detected in at least 14 bat species, including 9 species which had
antibodies against ZEBOV (Eidolon helvum, Epomophorus gambianus, Lissonycteris angolensis, Micropteropus
pusillus, Mops condylurus, Rousettus aegyptiacus, Epomops franqueti, Hypsignathus monstrosus, and Myonycteris
torquata). Whereas these 9 bat species had been all tested positive for ZEBOV using serology methods, only
Epomops franqueti, Hypsignathus monstrosus and Myonycteris torquata had additionally been tested positive by
PCR methods9,15,16,21–24. PCR evidences for Rousettus aegyptiacus have been ambiguous and inconsistent16,20,25.
From those bat species that had been shown to be susceptible for ZEBOV, the virus could then infect other
animals such as non-human primates, duikers (antelopes) or humans. Once the virus has spilled over from a wild
animal to a human, it can be transmitted from human to human4,5. It has been postulated that humans might
become infected with the virus through close contact with blood or other body fluids from infected persons or
when handling or eating so-called bushmeat form e.g. bats roosting in or near to human d wellings13,26–28.
The distribution of a virus is generally restricted to the distribution of the natural reservoir host17. In the case
of Ebola, current evidence suggests that bats might play a major role in the transmission cycle of the filoviruses
and might act as reservoir hosts. The approach taken here was to model their habitat suitability and compare
their potential distribution with previous spill over events. We modelled the habitat suitability for the 9 spe-
cies associated with ZEBOV due to the high mortality rate associated with this viral species and its presumed
responsibility for most outbreaks in A frica4,29.
Results
The generated habitat suitability models captured the occurrence data of the bat species to large parts, with good
to very good AUC value > 0.84 (see Supplementary Material S4). Suitable habitats for the putative reservoir spe-
cies currently prevail from Western to Eastern Africa, including large parts of Central Africa (see Figs. 1 and 2).
More specifically, suitable areas are located below the Sahara and range from Guinea, Sierra Leone and Liberia
in the west across the Central African Republic, Republic of the Congo and the Democratic Republic of the
Congo, to Sudan and Uganda in the east. For some species (see Rousettus aegyptiacus or Mops condylurus) the
areas even extend to the southern parts of Africa (e.g. east coast of South Africa). According to the models, no
favourable habitat conditions prevail in the large deserts of Africa (e.g. Sahara or Namib), with only a very small
number of occurrence data being recorded in those regions (Supplementary Materials S1 and S3). In addition,
the habitat suitability of some species (e.g. Epomophorus gambianus and Mops condylurus) in the Congo Basin
is significantly lower than in the surrounding area.
Comparing the currently assumed distribution of bat species as represented by the IUCN polygons (Fig. 3),
our modelling results mostly show a match for all species. Only small areas in southern West Africa (see
Scientific Reports | (2020) 10:14268 | https://doi.org/10.1038/s41598-020-71226-0 2
Vol:.(1234567890)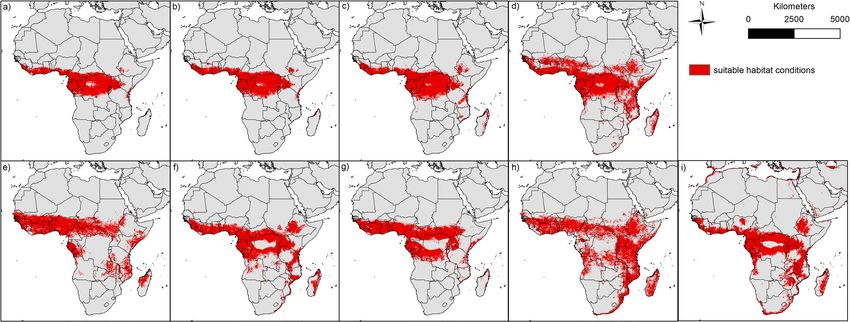
www.nature.com/scientificreports/
Figure 2. Binary modelling results of the nine bat species: (a) Epomops franqueti, (b) Hypsignathus monstrosus,
(c) Myonycteris torquata, (d) Eidolon helvum, (e) Epomophorus gambianus, (f) Lissonycteris angolensis, (g)
Micropteropus pusillus, (h) Mops condylurus, (i) Rousettus aegyptiacus. The maps were generated using Esri
ArcGIS 10.6 (https://www.esri.com/en-us/home)67.
Figure 3. Binary modelling results of the nine bat species (red) and current status of distribution according
to IUCN (hatched): (a) Epomops franqueti, (b) Hypsignathus monstrosus, (c) Myonycteris torquata, (d)
Eidolon helvum, (e) Epomophorus gambianus, (f) Lissonycteris angolensis, (g) Micropteropus pusillus, (h)
Mops condylurus, (i) Rousettus aegyptiacus. The maps were generated using Esri ArcGIS 10.6 (https://www.esri.
com/en-us/home)67.
Myonycteris torquata), the Congo Basin (see Rousettus aegyptiacus) and Madagascar (see e.g. Mops condylurus)
are not covered by the IUCN polygons, although they have suitable conditions according to our models.
Based on their modelled habitat suitability (Fig. 1), the different bat species can be classified into different
groups. The suitable habitats of the first group (Epomops franqueti (Fig. 1a), Hypsignathus monstrosus (Fig. 1b)
and Myonycteris torquata (Fig. 1c)) range from the areas near the coasts of West and Central Africa and from
there further inland. In the east, suitable modelled areas reach up to western Kenya and Tanzania. Compared
to the other two groups, the modelled potential distribution to the east and south does not extend very far. The
second group, which includes the species Epomophorus gambianus (Fig. 1e), Lissonycteris angolensis (Fig. 1f),
Micropteropus pusillus (Fig. 1g) and Rousettus aegyptiacus (Fig. 1i), has a broader modelled range compared to
the first group. The areas modelled suitable for this group extend in the west to the southern regions of Mali and
Burkina Faso. According to the modelling results, this group also finds more suitable areas in Central Africa,
which partly extend to the north of Angola in the south, where Rousettus aegyptiacus already occurs (see Sup-
plementary Material S1). Towards the east, the suitable habitats of this group are also rather small, and hardly
reach areas in Ethiopia and Somalia. The third group, consisting of Eidolon helvum (Fig. 1d) and Mops condylurus
(Fig. 1h), finds suitable conditions in large parts of Africa. The areas modelled suitable for this group exceed
areas of the other two groups, especially in the east and the south and range from northern areas directly south
of the Sahara to the countries of Mozambique and South Africa, where both species had already been detected
Scientific Reports | (2020) 10:14268 | https://doi.org/10.1038/s41598-020-71226-0 3
Vol.:(0123456789)
www.nature.com/scientificreports/
Figure 4. Binary modelling results of bat species (red) and previous ZEBOV spillover (white circles) and
outbreak events (black circles) for the CDC and Judson et al.65,66: (a) for the 3 bat species tested positive for
ZEBOV by serology and PCR method, (b) for all 9 investigated bat species tested serologically positive for
ZEBOV. The maps were generated using Esri ArcGIS 10.6 (https://www.esri.com/en-us/home)67.
(Supplementary Material S1). Considering an east–west direction, the suitable habitats of the species of this
group extend from Somalia and Ethiopia in the east to Guinea and Sierra Leone in the west.
In addition to the modelling results of the single species, we combined all binary outputs for the 3 species that
had been tested positive by serology and PCR methods (Fig. 4a) as well as for all 9 species, including the previ-
ous three species and the six species that had only been tested ZEBOV positive by serology (Fig. 4b). This was
done in order to better estimate the total extent of the area with potentially suitable habitats and to test whether
the extent would cover areas where previous spillover events and outbreak sites of the ZEBOV were recorded
(Fig. 4a,b). The spillover events and outbreak sites considered here are located in Central Africa, especially in
Gabon, the Republic of the Congo and the Democratic Republic of the Congo and Western Africa (e.g. Liberia
and Sierra Leone). The modelled habitat suitability of the subset of the 3 species nearly covers all considered
previous spillover event and outbreak sites. Considering all 9 putative reservoir species the area modelled as
suitable is even larger. The area extends from Senegal, Gambia and Liberia in West Africa, across the southern
parts of Mali, Niger and Chad to the eastern parts of Ethiopia and Somalia. In the south, the suitable area for
the 9 species extends to the northern parts of Angola and Zambia, along the east coast even to South Africa.
Regarding the land cover, all of the investigated putative reservoir species find suitable habitats in the areas
of the tropical rainforest near the coasts of West and Central Africa and further inland in Central Africa. In the
south, the area extends into the southern woodlands and savannah areas for some species like Mops condylurus
or Rousettus aegyptiacus. For the majority of species, the first two variables explaining more than 70–80% of
the variance, are mostly land cover and temperature seasonality (Bio04). The land cover variable alone is often
responsible for more than 60% of the explained variance (Supplementary Material S4) and the species show dif-
ferent patterns with regard to the land cover types modelled to be suitable (Supplementary Material S5). Other
variables such as the annual mean temperature (Bio01) and precipitation in the wettest month (Bio13) have very
little explanatory value for the variance in the model and values range between 0 and 3.94% and between 0.1 and
7.25% for Bio1 and Bio13, respectively.
Discussion
In recent years, bats have increasingly been recognized as putative reservoir hosts for several viruses including
different species within the genus Ebolavirus and due to the associated health threat they became the focus of
many studies. Since the species of the genus Ebolavirus are highly dependent on the reservoir host, knowledge
about their reservoir host’s distribution is important. The aim of the study was to investigate the habitat suitability
for 9 currently known putative reservoir species of the deadly ZEBOV in Africa, with 3 of these species having
been tested positive for ZEBOV not only by serology but also PCR methods.
All the models in this study estimated the distribution of the investigated species well, with suitable habitat
conditions in the sub-Saharan regions of West and Central Africa, especially in the areas of forests and wood-
lands. For some species, suitable habitats even extend to the southeast of Africa and the eastern coast (e.g.
Eidolon helvum and Mops condylurus), which is in accordance with their currently known distribution (see
Supplementary Material S1). In the Congo Basin, the models of many species assume poor habitat conditions.
These poor habitat conditions are paralleled by the comparatively few occurrence records found in this area
(Supplementary Materials S1 and S3)30,31. This might be explained by unique habitat conditions, particularly in
the equatorial regions in the centre of the Congo basin. The Congo Basin is mainly covered with forest and with
about 1.7 million k m2 it is the second largest rainforest in the world. In general, the Congo Basin is to be clas-
sified as an intermediate tropical region, with average rainfall between 1,000 and 1,750 mm per year, however,
equatorial areas differ from those a mounts32. In particular, the heavy rainfall in the equatorial areas with an
average of 2000 mm and the lower temperatures compared to the ambient areas could pose a challenge for the
putative reservoir hosts. On the one hand, it is assumed that heavy rainfall could lead to energetic costs for bats.
Scientific Reports | (2020) 10:14268 | https://doi.org/10.1038/s41598-020-71226-0 4
Vol:.(1234567890)www.nature.com/scientificreports/
On the other hand, flight characteristics of insects are influenced by frequent and heavy rainfall, which could
indirectly affect the habitat suitability of the insectivorous species like (Mops condylurus) in these regions30,33,34.
Although the precipitation variables in the model of Mops condylurus are comparatively important explanatory
variables, they do not have a very high explanatory power in general compared to the other species. Erickson
and West (2002) could detect a strong negative correlation between the flight activity of insectivorous bats and
low temperatures35. Thus, the comparatively lower and less variable temperatures in the equatorial areas of the
basin (~ 23 to 24 °C mean annual temperature) might also influence the habitat suitability in this a rea32. In the
case of Mops condylurus, it is known that this species prefers temperatures of about 35–40 °C in its roosting areas,
similar to their basal metabolic rate30. Similar results were found for the frugivorous species Rousettus aegyptia-
cus. This species was found in resting areas with temperatures between 29–35 °C, which also corresponds to its
metabolic optimum30. However, the poor habitat suitability in this region might also be due to a sampling bias
or a general lack of scientific occurrence data from the equatorial r ainforest36, occurrences from this the region
might have been underestimated in the model.
The modelled habitat suitabilities are also in good accordance with the currently assumed distribution of
the nine bat species according to the IUCN. Differences between the IUCN polygons and the model (e.g. in
Madagascar) may indicate dispersal b arriers36. For example, although the habitats in Madagascar are modelled
suitable for the species, they are very likely unable to reach them. Other discrepancies between the IUCN maps
and our habitat suitability maps might indicate that species occupy a larger range but have not been recorded in
parts of this range. The available distribution data might therefore underestimate the actual distribution. In this
case, our maps would provide a better estimate of the actual distribution of the putative Ebola reservoir hosts,
and help identify regions where Ebola might occur. However, the observed differences could also arise from the
fact that our models identify areas where habitats are suitable, but where the species are not present. The absence
of species in these areas despite modelled habitat suitability could be due to the dispersal limitations or lacking
accessibility of the sites (e.g. Madagascar), or due to the fact that relevant factors that exclude the occurrence of
a species were not considered in the model, e.g. availability of certain food types or interspecific competition
with other bat species.
The areas modelled as suitable in our study are also in accordance with results of former studies29,34. In
comparison to these studies, we used a more recent data set of occurrences (until 2019) and climate variables
(worldclim data containing the average for the years 1970–2000)37. Moreover, this study is not only based on
modelling using climatic factors, but also uses land cover variables, which might help to better assess the bats’
habitat requirements.
Land cover plays an important role in almost all models (variable contribution with mostly over 60%) and
therefore has an important explanatory effect. This might be because the bat species require trees as resting and
roosting places, but also for feeding, since eight of the nine investigated species mainly feed on f ruits30,34. More
specifically, the results indicate that bats mainly find suitable conditions in the forests (e.g. land cover classes 40
and 170 in Supplementary Material S5). However, all of the investigated species also show a strong association
with artificial surfaces and associated areas (land cover class 190). For many of the investigated bat species this
could be explained by the fact that these species live or roost close to urban areas and human dwellings (e.g.
Eidolon helvum or Rousettus aegyptiacus)30,38.
Bat species roosting in great densities in crowded colonies might facilitate intra- and interspecies transmis-
sion of viral infections and increase the infection risk in the surrounding a reas30,38–41. Generally, there is a high
risk of accumulation of viruses and parasites in large groups of bats and individuals might be more vulnerable
to infections due to their close p roximity26,40–43. One species usually roosting in large groups (sometimes up to
more than one million bats) is Eidolon helvum30,38. This species is one of the most hunted species and considered
a main source of bushmeat for inhabitants of West and Central Africa, which makes it an important species for a
virus spillover from bats to human populations30,38,44. Although the causes of EVD outbreaks and the associated
factors are still largely unknown, an epidemiological study was able to show a link between an outbreak of EVD in
the Democratic Republic of the Congo and an increased flight activity and aggregation of bats during migration
in combination with subsequent hunting of these b ats20,45. Eidolon helvum and Mops condylurus are migratory
species and their activity ranges vary between 1,190 and 1,437 ha. They also have large foraging distances of up
to 4.8 km, and Eidolon helvum sometimes migrates over distances between 250 and 2000 km per s eason30,38,41.
Migratory bat species might therefore promote and facilitate the viral spread/transmission of ZEBOV, even across
biomes or c ontinents41. Given that the migratory routes and intrinsic drivers of the bats are largely unknown,
future behavioural and ecological studies are necessary and could also benefit a better understanding of how
to limit a possible spread of the virus. In order to examine the migration behaviour more effectively, modelling
results with higher temporal resolution may also be useful. Such results might highlight suitable habitats of the
species over the timespan of a year and thus, facilitate sampling on the one hand and help draw possible conclu-
sions on migration behaviour on the other hand. These facts might indicate an important role of E. helvum in
the transmission of the virus, however Ng et al. could experimentally show that this species has not been much
susceptible to the v irus46. Their experiment might therefore indicate that E. helvum is genetically not well suited
for cellular virus infections and the antibodies previously detected in this species could have been generated
against a related filovirus or, since their experiments have been based on in-vitro cell culture data, they might
not necessarily reflect the situation in nature.
The modelled distribution of the three species that had been tested positive for ZEBOV by different meth-
ods (serology and PCR) overlaps with nearly all of the previous spillover events and outbreak sites extracted
from literature (Fig. 4a) located in central African, seemingly supporting the importance of Epomops franqueti,
Hypsignathus monstrosus and Myonycteris torquata, as putative ZEBOV reservoirs. This assumption is also in
accordance with the results of a study by Pourrut et al., who were able to detect ZEBOV-specific antibodies
serologically in all three species (namely Epomops franqueti, Hypsignathus monstrosus and Myonycteris torquata)
Scientific Reports | (2020) 10:14268 | https://doi.org/10.1038/s41598-020-71226-0 5
Vol.:(0123456789)www.nature.com/scientificreports/
Species Number of occurrence records
Epomops franqueti 341
Hypsignathus monstrosus 219
Myonycteris torquata 143
Eidolon helvum 635
Epomophorus gambianus 346
Lissonycteris angolensis 130
Micropteropus pusillus 397
Mops condylurus 358
Rousettus aegyptiacus 483
Total 3,052
Table 1. Number of occurrence records of the bat species in Africa. The corresponding references to the
GBIF50 and African Chiroptera Reports 2018 and 201930,31 occurrence data can be found in the Supplementary
Material (see Supplementary Materials S1–S3).
during the outbreaks in 2001 and 2003 in Gabon and in the Republic of the Congo16. Whether the other six
other species (Eidolon helvum, Epomophorus gambianus, Lissonycteris angolensis, Micropteropus pusillus, Mops
condylurus and Rousettus aegyptiacus), which had only been tested positive for ZEBOV using serology tests but
are partly overlapping in their distribution with the other 3 bat species, might similarly act a putative reservoir
hosts, requires further molecular investigations. However, since cross-reactivity of antibodies cannot be excluded,
the detection of ZEBOV-specific antibodies could also indicate a related but perhaps not yet discovered virus
strain, rather than actual antibodies against the Zaire ebolavirus47,48.
In addition to the putative African reservoir hosts, it could also be beneficial to examine other bat species
outside Africa regarding their potential to act as reservoir hosts for the Zaire ebolavirus or other filovirus spe-
cies. Until now, only a small amount (~ 15%) of the global bat species (over 1,200 species) has been examined
for viruses20,49. One virus that should certainly be further analysed is the Lloviu virus. This filovirus was recently
found in the bat species Miniopterus schreibersii in southern E urope2. However, in comparison to the Ebola spe-
cies from Africa and the Philippines, which can remain asymptomatic in living bats, the Lloviu virus was only
found in dead and not in living b ats2,20.
To our knowledge, our study is the first study that investigated all currently known putative reservoir species
of the deadly ZEBOV in Africa on a single species level. The models generated here reveal information about
the environmental niche and the potential distribution of the bats. In relation to future outbreaks of the EVD,
this information might potentially allow a better estimation of where precautionary steps and preventive actions
might become necessary in the future to protect local human populations.
Material and methods
Occurrence data and environmental variables. In this study, we included a bat species as putative res-
ervoir host if it had at least been serologically tested positive for ZEBOV. According to this criterion, 9 putative
reservoir host species were identified. Among those, 3 had additionally been tested positive for ZEBOV by PCR
method, which might further indicate their relevance as Ebola reservoir h osts9,15,16,21–24.
In order to not only map a broad area including all 9 putative reservoir hosts, but also a more conservative
and narrow map, the three species were treated separately in an additional analysis. The occurrences of the 9
reservoir species (associated to the ZEBOV) included a total number of 3,052 data points (see Table 1).
The occurrence data within the study area (Africa and Arabian Peninsula: 37.81 to − 35.85 N and − 29.17
to 61.33 E) originate from the Global Biodiversity Information Facility (GBIF) and the African Chiroptera
Reports30,31,50. The data was compiled in R (version 3.43, R Core Team 2017) with the R-Package “rgbif ”51,52 and
the corresponding references to the GBIF and African Chiroptera Reports occurrence data can be found in the
Supplementary Material (see Supplementary Materials S2 and S3). Subsequently, the occurrence records were
matched to the raster of the environmental variables with a grid size of ~ 10 k m2.
To model the distribution of the bat species, both climate and land cover variables served as predictor vari-
ables. The climatic variables were provided by worldclim (version 2.0)37 and consist of interpolated empirical
data, which is averaged for the years 1970–2000 with a spatial resolution of 5 arc minutes. This spatial resolution
is in accordance with the resolution of about 10 km2 at the equator. Bat activity patterns are known to be affected
by temperature and p recipitation35,53,54. A careful pre-selection resulted in a subset of eight out of the nineteen
available variables, which were considered ecologically important for the species and showed only little inter-
correlation. We modelled the ecological niche of the 9 bat species using the annual mean temperature (Bio1),
temperature seasonality (Bio04), max temperature of the warmest month (Bio05), min temperature of the coldest
month (Bio06), the annual precipitation (Bio12), precipitation of wettest month (Bio13), precipitation of driest
month (Bio14) and precipitation seasonality (Bio15). These variables reflect the mean, minima and maxima and
variability of the annual temperature and precipitation patterns.
The land cover variable was extracted from the GlobCover 2009 land cover map covering Africa and the
Arabian Peninsula and was provided by the European Space Agency (ESA) and the Université Catholique de
Louvain55. This map offers a regionally-tuned MERIS (Medium Resolution Imaging Spectrometer classification)
Scientific Reports | (2020) 10:14268 | https://doi.org/10.1038/s41598-020-71226-0 6
Vol:.(1234567890)www.nature.com/scientificreports/
classification for the year 2009 and comprises 22 different land cover classes according to the United Nations
Land Cover Classification S ystem55,56. The resolution of the land cover data was set to 5 arc min in order to match
the worldclim climate data and the occurrence data.
Niche modelling and diversity maps. The habitat suitability for the 9 bat species was modelled using
a basic species distribution modelling approach (also called ecological niche modelling) that combines the
observed occurrences of the species with the prevailing climatic conditions and land cover. We used a maximum
entropy approach conducted in the freeware MaxEnt57, which is one of the most commonly applied algorithms
determining species distributions. This algorithm is based on presence-only data, which benefits modelling
small and mobile species as their absence is difficult to determine. Moreover, the algorithm scores well in studies
comparing different algorithms58. According to the MaxEnt default settings we only used linear, quadratic and
product features and enhanced the number of iterations to 500 000 in order to ensure c onvergence59.
Multi-coloured climatic suitability was converted into binary modelling results (only suitable habitat: 1 or
unsuitable habitat: 0) applying an equal training sensitivity and specificity threshold60,61. The threshold minimizes
the difference between sensitivity and specificity as optimization criterion62,63. In order to compare our modelled
range of the investigated bat species with their currently assumed distribution defined by the IUCN (see Sup-
plementary Material S6), we added the IUCN polygons over our binary modelling r esults64.
To assess the potential modelled distribution of the bat species in relation to previous ZEBOV spillover and
outbreak events, we used the spillover events from Judson et al. as well as the outbreak sites from the CDC website
65,66
and compared them with the modelled bat habitats to indicate areas where at least one species is modelled
to find suitable conditions. This comparison was done for the 3 species tested positive for ZEBOV by multiple
methods (Fig. 4a) and taking all nine species into account (Fig. 4b).
Software. We used a maximum entropy approach conducted in the freeware MaxEnt57 to model the habitat
suitability for the bat species. Further analyses were done using the statistical programme R (version 3.43)52
using the R-Package “rgbif ”51 to access GBIF data ESRI ArcGIS (Release 10.6)67. ESRI ArcGIS was also used to
generate maps.
Received: 29 September 2019; Accepted: 5 August 2020
References
1. Olival, K. J. et al. Host and viral traits predict zoonotic spillover from mammals. Nature 546, 646–650 (2017).
2. Negredo, A. et al. Discovery of an ebolavirus-like filovirus in Europe. PLoS Pathog. 7, 1–8 (2011).
3. Atherstone, C., Roesel, K. & Grace, D. Ebola Risk Assessment in the Pig Value Chain in Uganda. ILRI Research Report 34. Nairobi,
Kenya: International Livestock Research Institute (2014).
4. CDC. Centers for Disease Control and Prevention (CDC). Ebola Virus Disease Distribution Map: cases of Ebola Virus Disease in
Africa Since 1976 (2019). https://www.cdc.gov/vhf/ebola/histor y/distribution-map.html. Accessed August 3rd 2019.
5. WHO. World Health Organization (WHO) Ebola virus disease - fact-sheet. (2019). https://www.who.int/health-topics/ebola
/#tab=overview. Accessed September 20th 2018.
6. Swanepoel, R. et al. Experimental inoculation of plants and animals with Ebola virus. Emerg. Infect. Dis. 2, 321–325 (1996).
7. Cantoni, D., Hamlet, A., Michaelis, M., Wass, M. N. & Rossmann, J. S. Risks posed by Reston, the forgotten Ebolavirus. mSphere
1, 1–10 (2016).
8. GIDEON. GIDEON: Stephan Berger. Ebola: Global Status (GIDEON Informatics, Inc., Los Angeles, 2019).
9. Pourrut, X. et al. Spatial and temporal patterns of Zaire ebolavirus antibody prevalence in the possible reservoir bat species. J.
Infect. Dis. 196, S176–S183 (2007).
10. Gire, S. et al. Genomic surveillance elucidates Ebola virus orgin and transmission during the 2014 outbreak. Science 12, 1–13
(2014).
11. Taniguchi, S. et al. Reston ebolavirus antibodies in bats, the Philippines. Emerg. Infect. Dis. 17, 1559–1560 (2011).
12. Schar, D. & Daszak, P. Ebola economics: the case for an upstream approach to disease emergence. EcoHealth 11, 451–452 (2014).
13. Voigt, C. C. Bats in the anthropocene: conservation of bats in a changing world. Springer, Berlin. https://doi.org/10.1007/978-3-
319-25220-9 (2015).
14. Leendertz, S. A. J., Gogarten, J. F., Düx, A., Calvignac-Spencer, S. & Leendertz, F. H. Assessing the evidence supporting fruit bats
as the primary reservoirs for ebola viruses. EcoHealth 13, 18–25 (2016).
15. Pourrut, X. et al. The natural history of Ebola virus in Africa. Microbes Infect. 7, 1005–1014 (2005).
16. Pourrut, X. et al. Large serological survey showing cocirculation of Ebola and Marburg viruses in Gabonese bat populations, and
a high seroprevalence of both viruses in Rousettus aegyptiacus. BMC Infect. Dis. 9, 159 (2009).
17. Peterson, T. T., Carroll, D. S., Mills, J. N. & Johnson, K. M. Potential mammalian filovirus reservoirs. Emerg. Infect. Dis. 10,
2073–2081 (2004).
18. Allen, T., Murray, K., Olival, K. J. & Daszak, P. The Influcence of global environmental change on infectious disease dynamics:
workshop summary. Global change and infectious disease dynamics. Eight critical questions for pandemic prediction (2012).
19. Olival, K. J., Weekley, C. & Daszak, P. Are bats really ‘special’ as viral reservoirs? What do we know and need to know? In Bats and
Viruses: a new frontier of emerging infectious diseases (eds Wang, L.-F. & Cowled, C.) 281–294 (Wiley, Hoboken, 2015).
20. Olival, K. & Hayman, D. Filoviruses in bats: current knowledge and future directions. Viruses 6, 1759–1788 (2014).
21. Leroy, E. M. et al. Fruit bats as reservoirs of Ebola virus. Nature 438, 575–576 (2005).
22. Hayman, D. T. S. et al. Long-term survival of an urban fruit bat seropositive for ebola and lagos bat viruses. PLoS ONE 5, 2008–2010
(2010).
23. Hayman, D. T. S. et al. Ebola virus antibodies in fruit bats, Ghana, West Africa. Emerg. Infect. Dis. 18, 1207–1209 (2012).
24. De Nys, H. M. et al. Survey of Ebola viruses in frugivorous and insectivorous bats in Guinea, Cameroon, and the Democratic
Republic of the Congo, 2015–2017. Emerg. Infect. Dis. 24, 2228–2240 (2018).
25. Sylla, M. et al. Chiropteran and Filoviruses in Africa: unveiling an ancient history. African J. Microbiol. Res. 9, 1446–1472 (2015).
Scientific Reports | (2020) 10:14268 | https://doi.org/10.1038/s41598-020-71226-0 7
Vol.:(0123456789)www.nature.com/scientificreports/
26. Gay, N. et al. Parasite and viral species richness of Southeast Asian bats: fragmentation of area distribution matters. Int. J. Parasitol.
Parasites Wildl. 3, 161–170 (2014).
27. CDC. Bushmeat. Centers for Disease Control and Prevention (CDC). (2018). https://www.cdc.gov/importation/bushmeat.html.
Accessed January 21st 2020.
28. Bonwitt, J. et al. Unintended consequences of the ‘bushmeat ban’ in West Africa during the 2013–2016 Ebola virus disease epidemic.
Soc. Sci. Med. 200, 166–173 (2018).
29. Pigott, D. M. et al. Mapping the zoonotic niche of Ebola virus disease in Africa. Elife 3, e04395 (2014).
30. ACR. African Chiroptera Report 2018. AfricanBats NPC. (2018). https://doi.org/10.13140/RG.2.2.18794.82881
31. ACR. African Chiroptera Report 2019. AfricanBats NPC. (2019). https://doi.org/10.13140/RG.2.2.27442.76482.1990-6471
32. Haensler, A., Saeed, F. & Jacob, D. Assessment of projected climate change signals over central Africa based on a multitude of
global and regional climate projections. in Climate Change Scenarios for the Congo Basin (eds. Haensler, A., Jacob, D., Kabat, P. &
Ludwig, F.) 11–42 (2013).
33. Voigt, C. C., Schneeberger, K., Voigt-Heucke, S. L., Lewanzik, D. & Supplement, D. Rain increases the energy cost of bat flight
Subject collections Email alerting service rain increases the energy cost of bat flight. Society https: //doi.org/10.1098/rsbl.2011.0313
(2011).
34. PREDICT. Distribution and seasonality of potential Ebola bat reservoirs. Emerg. Dis. Insights (2016).
35. Erickson, J. L. & West, S. D. The influence of regional climate and nightly weather conditions on activity patterns of insectivorous
bats. Acta Chiropterologica 4, 17–24 (2002).
36. Peterson, A. T. et al. Ecological Niches and Geographic Distributions. Ecological Niches and Geographic Distributions (MPB-49)
(2011). https://doi.org/10.23943/princeton/9780691136868.001.0001
37. Fick, S. E. & Hijmans, R. J. WorldClim 2: new 1-km spatial resolution climate surfaces for global land areas. Int. J. Climatol. 37,
4302–4315 (2017).
38. Peel, A. J. et al. Continent-wide panmixia of an African fruit bat facilitates transmission of potentially zoonotic viruses. Nat. Com-
mun. 4, 1–14 (2013).
39. Arneberg, P., Skorping, A., Grenfell, B. & Read, A. F. Host densities as determinants of abundance in parasite communities. Proc.
R. Soc. B Biol. Sci. 265, 1283–1289 (1998).
40. Altizer, S. et al. Social organization and parasite risk in mammals: integrating theory and empirical studies. Annu. Rev. Ecol. Evol.
Syst. 34, 517–547 (2003).
41. Calisher, C. H., Childs, J. E., Field, H. E., Holmes, K. V. & Schountz, T. Bats: Important reservoir hosts of emerging viruses. Clin.
Microbiol. Rev. 19, 531–545 (2006).
42. Loehle, C. Social barriers to pathogen transmission in wild animal populations. Ecology 76, 326–335 (1995).
43. Nunn, C. L., Jordán, F., McCabe, C. M., Verdolin, J. L. & Fewell, J. H. Infectious disease and group size: more than just a numbers
game. Philos. Trans. R. Soc. B Biol. Sci. 370, (2015).
44. Alexander, K. A. et al. What factors might have led to the emergence of ebola in West Africa?. PLoS Negl. Trop. Dis. 9, 1–26 (2015).
45. Leroy, E. M. et al. Human Ebola outbreak resulting from direct exposure to fruit bats in Luebo, Democratic Republic of Congo,
2007. Vector-Borne Zoonotic Dis. 9, 723–728 (2009).
46. Ng, M. et al. Filovirus receptor NPC1 contributes to species-specific patterns of ebolavirus susceptibility in bats. Elife 4, 1–22
(2015).
47. MacNeil, A., Reed, Z. & Rollin, P. E. Serologic cross-reactivity of human IgM and IgG antibodies to five species of Ebola virus.
PLoS Negl. Trop. Dis. 5, e1175 (2011).
48. Schuh, A. J. et al. Comparative analysis of serologic cross-reactivity using convalescent sera from filovirus-experimentally infected
fruit bats. Sci. Rep. 9, 1–12 (2019).
49. Olival, K. J., Epstein, J. H., Wang, L. F., Field, H. E. & Daszak, P. Are bats unique viral reservoirs? In New Directions in Conservation
Medicine Applied Cases of Ecological Health Aguirre (eds Aguirre, A. A. et al.) 195–212 (Oxford University Press, Oxford, 2012).
50. GBIF. Global Biodiversity Information Facility. GBIF Home Page (2018).
51. Chamberlain, S., Boettiger, C., Ram, K., Brave, V. & McGlinn, D. rgbif: Interface to the Global Biodiversity Information Facility
API. R package version 0.9.3. https://github.com/ropensci/rgbif (2016).
52. R Core Team. R: A language and environment for statistical computing. R Foundation for Statistical Computing, Vienna, Austria.
https://www.R-project.org/ (2017).
53. Geluso, K. N. & Geluso, K. Effects of environmental factors on capture rates of insectivorous bats, 1971–2005. J. Mammal. 93,
161–169 (2012).
54. Wolbert, S. J., Zellner, A. S. & Whidden, H. P. Bat activity, insect biomass, and temperature along an elevational gradient. Northeast.
Nat. 21, 72–85 (2014).
55. Arino, O. et al. Global land cover map for 2009 (GlobCover 2009). © European Space Agency (ESA) & Université catholique de
Louvain (UCL), PANGAEA. https://doi.org/10.1594/PANGAEA.787668 (2012)
56. Bicheron, P. et al. GLOBCOVER - Products Description and Validation Report (2008).
57. Phillips, S. J., Dudík, M. & Schapire, R. E. [Internet] Maxent software for modeling species niches and distributions (Version 3.4.1).
https://biodiversityinformatics.amnh.org/open_source/maxent/. Accessed 2019 (2017).
58. Elith, J. et al. Novel methods improve prediction of species ’ distributions from occurrence data. Ecography (Cop.) 29, 129–151
(2006).
59. Cunze, S. & Tackenberg, O. Decomposition of the maximum entropy niche function: a step beyond modelling species distribution.
Environ. Model. Softw. 72, 250–260 (2015).
60. Jiménez-Valverde, A. & Lobo, J. M. Threshold criteria for conversion of probability of the species presence to either-or- presence–
absence. Acta Oecologica 31, 361–369 (2007).
61. Liu, C., White, M. & Newell, G. Selecting thresholds for the prediction of species occurrence with presence-only data. J. Biogeogr.
40, 778–789 (2013).
62. Schröder, B. & Richter, O. Are habitat models transferable in space and time?. Zeitschrift für Ökologie und Naturschutz 8, 195–205
(2000).
63. Lobo, J. M., Jiménez-Valverde, A. & Real, R. AUC: a misleading measure of the performance of predictive distribution models.
Glob. Ecol. Biogeogr. 17, 145–151 (2008).
64. IUCN. IUCN (International Union for Conservation of Nature and Natural Resources). The IUCN Red List of Threatened Species.
Version 2019-3. https://www.iucnredlist.org (2020). https://www.iucnredlist.org/search.
65. CDC. Ebola Virus Disease Distribution Map: Cases of Ebola Virus Disease in Africa Since 1976. (2019). https://www.cdc.gov/vhf/
ebola/histor y/distribution-map.html. Accessed July 28th 2020.
66. Judson, S. D., Fischer, R., Judson, A. & Munster, V. J. Ecological contexts of index cases and spillover events of different Ebolaviruses.
PLoS Pathog. 12, 1–17 (2016).
67. ESRI. Environmental Systems Research Institute (ESRI). ArcGIS Release 10.6. Redlands, CA (2018).
Scientific Reports | (2020) 10:14268 | https://doi.org/10.1038/s41598-020-71226-0 8
Vol:.(1234567890)www.nature.com/scientificreports/
Author contributions
L.K.K., S.C., J.K., and S.K. conceived of the study and wrote the manuscript. L.K.K., S.C., J.K., and S.K. revised
the manuscript. S.C. carried out the analysis and created the figures. L.K.K. compiled the data and participated
in the data analysis. All authors gave final approval for publication and agree to be held accountable for the work
performed therein.
Funding
Open Access funding provided by Projekt DEAL.
Competing interests
The authors declare no competing interests.
Additional information
Supplementary information is available for this paper at https://doi.org/10.1038/s41598-020-71226-0.
Correspondence and requests for materials should be addressed to L.K.K.
Reprints and permissions information is available at www.nature.com/reprints.
Publisher’s note Springer Nature remains neutral with regard to jurisdictional claims in published maps and
institutional affiliations.
Open Access This article is licensed under a Creative Commons Attribution 4.0 International
License, which permits use, sharing, adaptation, distribution and reproduction in any medium or
format, as long as you give appropriate credit to the original author(s) and the source, provide a link to the
Creative Commons license, and indicate if changes were made. The images or other third party material in this
article are included in the article’s Creative Commons license, unless indicated otherwise in a credit line to the
material. If material is not included in the article’s Creative Commons license and your intended use is not
permitted by statutory regulation or exceeds the permitted use, you will need to obtain permission directly from
the copyright holder. To view a copy of this license, visit http://creativecommons.org/licenses/by/4.0/.
© The Author(s) 2020
Scientific Reports | (2020) 10:14268 | https://doi.org/10.1038/s41598-020-71226-0 9
Vol.:(0123456789)You can also read